Monitor Azure Kubernetes Service
This article describes:
- The types of monitoring data you can collect for this service.
- Ways to analyze that data.
Note
If you're already familiar with this service and/or Azure Monitor and just want to know how to analyze monitoring data, see the Analyze section near the end of this article.
When you have critical applications and business processes that rely on Azure resources, you need to monitor and get alerts for your system. The Azure Monitor service collects and aggregates metrics and logs from every component of your system. Azure Monitor provides you with a view of availability, performance, and resilience, and notifies you of issues. You can use the Azure portal, PowerShell, Azure CLI, REST API, or client libraries to set up and view monitoring data.
- For more information on Azure Monitor, see the Azure Monitor overview.
- For more information on how to monitor Azure resources in general, see Monitor Azure resources with Azure Monitor.
Important
Kubernetes is a complex distributed system with many moving parts. Monitoring at multiple levels is required. Although AKS is a managed Kubernetes service, the same rigor around monitoring at multiple levels is still required. This article provides high level information and best practices for monitoring an AKS cluster.
- For detailed monitoring of the complete Kubernetes stack, see Monitor Kubernetes clusters using Azure services and cloud native tools.
- For collecting metric data from Kubernetes clusters, see Azure Monitor managed service for Prometheus.
- For collecting logs in Kubernetes clusters, see Azure Monitor features for Kubernetes monitoring.
- For data visualization, see Azure Workbooks and Monitor your Azure services in Grafana.
Insights
Some services in Azure have a built-in monitoring dashboard in the Azure portal that provides a starting point for monitoring your service. These dashboards are called insights, and you can find them in the Insights Hub of Azure Monitor in the Azure portal.
Azure Monitor Container insights collect custom metrics for nodes, pods, containers, and persistent volumes. For more information, see Metrics collected by Container insights.
Monitoring data
AKS generates the same kinds of monitoring data as other Azure resources that are described in Monitoring data from Azure resources. See Monitoring AKS data reference for detailed information on the metrics and logs created by AKS. Other Azure services and features collect other data and enable other analysis options as shown in the following diagram and table.

| Source | Description |
|---|---|
| Platform metrics | Platform metrics are automatically collected for AKS clusters at no cost. You can analyze these metrics with metrics explorer or use them for metric alerts. |
| Prometheus metrics | When you enable metric scraping for your cluster, Azure Monitor managed service for Prometheus collects Prometheus metrics and stores them in an Azure Monitor workspace. Analyze them with prebuilt dashboards in Azure Managed Grafana and with Prometheus alerts. |
| Activity logs | Activity log is collected automatically for AKS clusters at no cost. These logs track information such as when a cluster is created or has a configuration change. To analyze it with your other log data, send the Activity log to a Log Analytics workspace. |
| Resource logs | Control plane logs for AKS are implemented as resource logs. Create a diagnostic setting to send them to Log Analytics workspace where you can analyze and alert on them with log queries in Log Analytics. |
| Container insights | Container insights collect various logs and performance data from a cluster including stdout/stderr streams and store them in a Log Analytics workspace and Azure Monitor Metrics. Analyze this data with views and workbooks included with Container insights or with Log Analytics and metrics explorer. |
Resource types
Azure uses the concept of resource types and IDs to identify everything in a subscription. Resource types are also part of the resource IDs for every resource running in Azure. For example, one resource type for a virtual machine is Microsoft.Compute/virtualMachines. For a list of services and their associated resource types, see Resource providers.
Azure Monitor similarly organizes core monitoring data into metrics and logs based on resource types, also called namespaces. Different metrics and logs are available for different resource types. Your service might be associated with more than one resource type.
For more information about the resource types for AKS, see Azure Kubernetes Service monitoring data reference.
Data storage
For Azure Monitor:
- Metrics data is stored in the Azure Monitor metrics database.
- Log data is stored in the Azure Monitor logs store. Log Analytics is a tool in the Azure portal that can query this store.
- The Azure activity log is a separate store with its own interface in the Azure portal.
You can optionally route metric and activity log data to the Azure Monitor logs store. You can then use Log Analytics to query the data and correlate it with other log data.
Many services can use diagnostic settings to send metric and log data to other storage locations outside Azure Monitor. Examples include Azure Storage, hosted partner systems, and non-Azure partner systems, by using Event Hubs.
For detailed information on how Azure Monitor stores data, see Azure Monitor data platform.
Azure Monitor platform metrics
Azure Monitor provides platform metrics for most services. These metrics are:
- Individually defined for each namespace.
- Stored in the Azure Monitor time-series metrics database.
- Lightweight and capable of supporting near real-time alerting.
- Used to track the performance of a resource over time.
Collection: Azure Monitor collects platform metrics automatically. No configuration is required.
Routing: You can also usually route platform metrics to Azure Monitor Logs / Log Analytics so you can query them with other log data. For more information, see the Metrics diagnostic setting. For how to configure diagnostic settings for a service, see Create diagnostic settings in Azure Monitor.
For a list of all metrics it's possible to gather for all resources in Azure Monitor, see Supported metrics in Azure Monitor.
For a list of available metrics for AKS, see Azure Kubernetes Service monitoring data reference.
Metrics play an important role in cluster monitoring, identifying issues, and optimizing performance in the AKS clusters. Platform metrics are captured using the out of the box metrics server installed in kube-system namespace, which periodically scrapes metrics from all Kubernetes nodes served by Kubelet. You should also enable Azure Managed Prometheus metrics to collect container metrics and Kubernetes object metrics, such as object state of Deployments. For more information, see Collect Prometheus metrics from an AKS cluster.
AKS also exposes metrics from critical Control Plane components such as API server, ETCD, Scheduler through Azure Managed Prometheus. This feature is currently in preview. For more information, see Monitor Azure Kubernetes Service (AKS) control plane metrics (preview).
Non-Azure Monitor based metrics
This service provides other metrics that aren't included in the Azure Monitor metrics database.
The following Azure services and features of Azure Monitor can be used for extra monitoring of your Kubernetes clusters. You can enable these features during AKS cluster creation from the Integrations tab in the Azure portal, Azure CLI, Terraform, Azure Policy, or onboard your cluster to them later. Each of these features might incur cost, so refer to the pricing information for each before you enabled them.
| Service / Feature | Description |
|---|---|
| Container insights | Uses a containerized version of the Azure Monitor agent to collect stdout/stderr logs, and Kubernetes events from each node in your cluster. The feature supports a variety of monitoring scenarios for AKS clusters. You can enable monitoring for an AKS cluster when it's created by using Azure CLI, Azure Policy, the Azure portal, or Terraform. If you don't enable Container insights when you create your cluster, see Enable Container insights for Azure Kubernetes Service (AKS) cluster for other options to enable it. Container insights store most of its data in a Log Analytics workspace, and you typically use the same log analytics workspace as the resource logs for your cluster. See Design a Log Analytics workspace architecture for guidance on how many workspaces you should use and where to locate them. |
| Azure Monitor managed service for Prometheus | Prometheus is a cloud-native metrics solution from the Cloud Native Compute Foundation. It's the most common tool used for collecting and analyzing metric data from Kubernetes clusters. Azure Monitor managed service for Prometheus is a fully managed Prometheus-compatible monitoring solution in Azure. If you don't enable managed Prometheus when you create your cluster, see Collect Prometheus metrics from an AKS cluster for other options to enable it. Azure Monitor managed service for Prometheus stores its data in an Azure Monitor workspace, which is linked to a Grafana workspace so that you can analyze the data with Azure Managed Grafana. |
| Azure Managed Grafana | Fully managed implementation of Grafana, which is an open-source data visualization platform commonly used to present Prometheus data. Multiple predefined Grafana dashboards are available for monitoring Kubernetes and full-stack troubleshooting. If you don't enable managed Grafana when you create your cluster, see Link a Grafana workspace. You can link it to your Azure Monitor workspace so it can access Prometheus metrics for your cluster. |
Monitor AKS control plane metrics (preview)
This section shows you how to use the control plane metrics (preview) feature. Collect metrics from the control plane and view the telemetry in Azure Monitor. The control plane metrics feature is fully compatible with Prometheus and Grafana. The feature provides more visibility into the availability and performance of the control plane components, such as the API server, ETCD, Scheduler, Autoscaler, and controller manager. You can use these metrics to maximize overall observability and maintain operational excellence for your AKS cluster.
Prerequisites and limitations
- Control plane metrics (preview) only supports Azure Monitor managed service for Prometheus.
- Private link isn't supported.
- You can only customize the default ama-metrics-settings-config-map. All other customizations aren't supported.
- The AKS cluster must use managed identity authentication.
Install aks-preview extension
Important
AKS preview features are available on a self-service, opt-in basis. Previews are provided "as is" and "as available," and they're excluded from the service-level agreements and limited warranty. AKS previews are partially covered by customer support on a best-effort basis. As such, these features aren't meant for production use. For more information, see the following support articles:
Install or update the
aks-previewAzure CLI extension using theaz extension addoraz extension updatecommand.# Install the aks-preview extension az extension add --name aks-preview # Update the aks-preview extension az extension update --name aks-preview
Register AzureMonitorMetricsControlPlanePreview flag
Register the
AzureMonitorMetricsControlPlanePreviewfeature flag using theaz feature registercommand.az feature register --namespace "Microsoft.ContainerService" --name "AzureMonitorMetricsControlPlanePreview"It takes a few minutes for the status to show Registered.
Verify the registration status using the
az feature showcommand.az feature show --namespace "Microsoft.ContainerService" --name "AzureMonitorMetricsControlPlanePreview"When the status reflects Registered, refresh the registration of the Microsoft.ContainerService resource provider using the
az provider registercommand.az provider register --namespace "Microsoft.ContainerService"
Enable control plane metrics on your AKS cluster
You can enable control plane metrics with the Azure Monitor managed service for Prometheus add-on when creating a new cluster or updating an existing cluster.
Enable control plane metrics on a new AKS cluster:
To collect Prometheus metrics from your Kubernetes cluster, see Enable Prometheus and Grafana for AKS clusters and follow the steps on the CLI tab for an AKS cluster.
Enable control plane metrics on an existing AKS cluster
If your cluster already has the Prometheus add-on, update the cluster to ensure it starts collecting control plane metrics using the
az aks updatecommand.az aks update --name $CLUSTER_NAME --resource-group $RESOURCE_GROUP
Note
Unlike the metrics collected from cluster nodes, control plane metrics are collected by a component which isn't part of the ama-metrics add-on. Enabling the AzureMonitorMetricsControlPlanePreview feature flag and the managed Prometheus add-on ensures control plane metrics are collected. After enabling metric collection, it can take several minutes for the data to appear in the workspace.
Query control plane metrics
Control plane metrics are stored in an Azure Monitor workspace in the cluster's region. You can query the metrics directly from the workspace or through the Azure managed Grafana instance connected to the workspace.
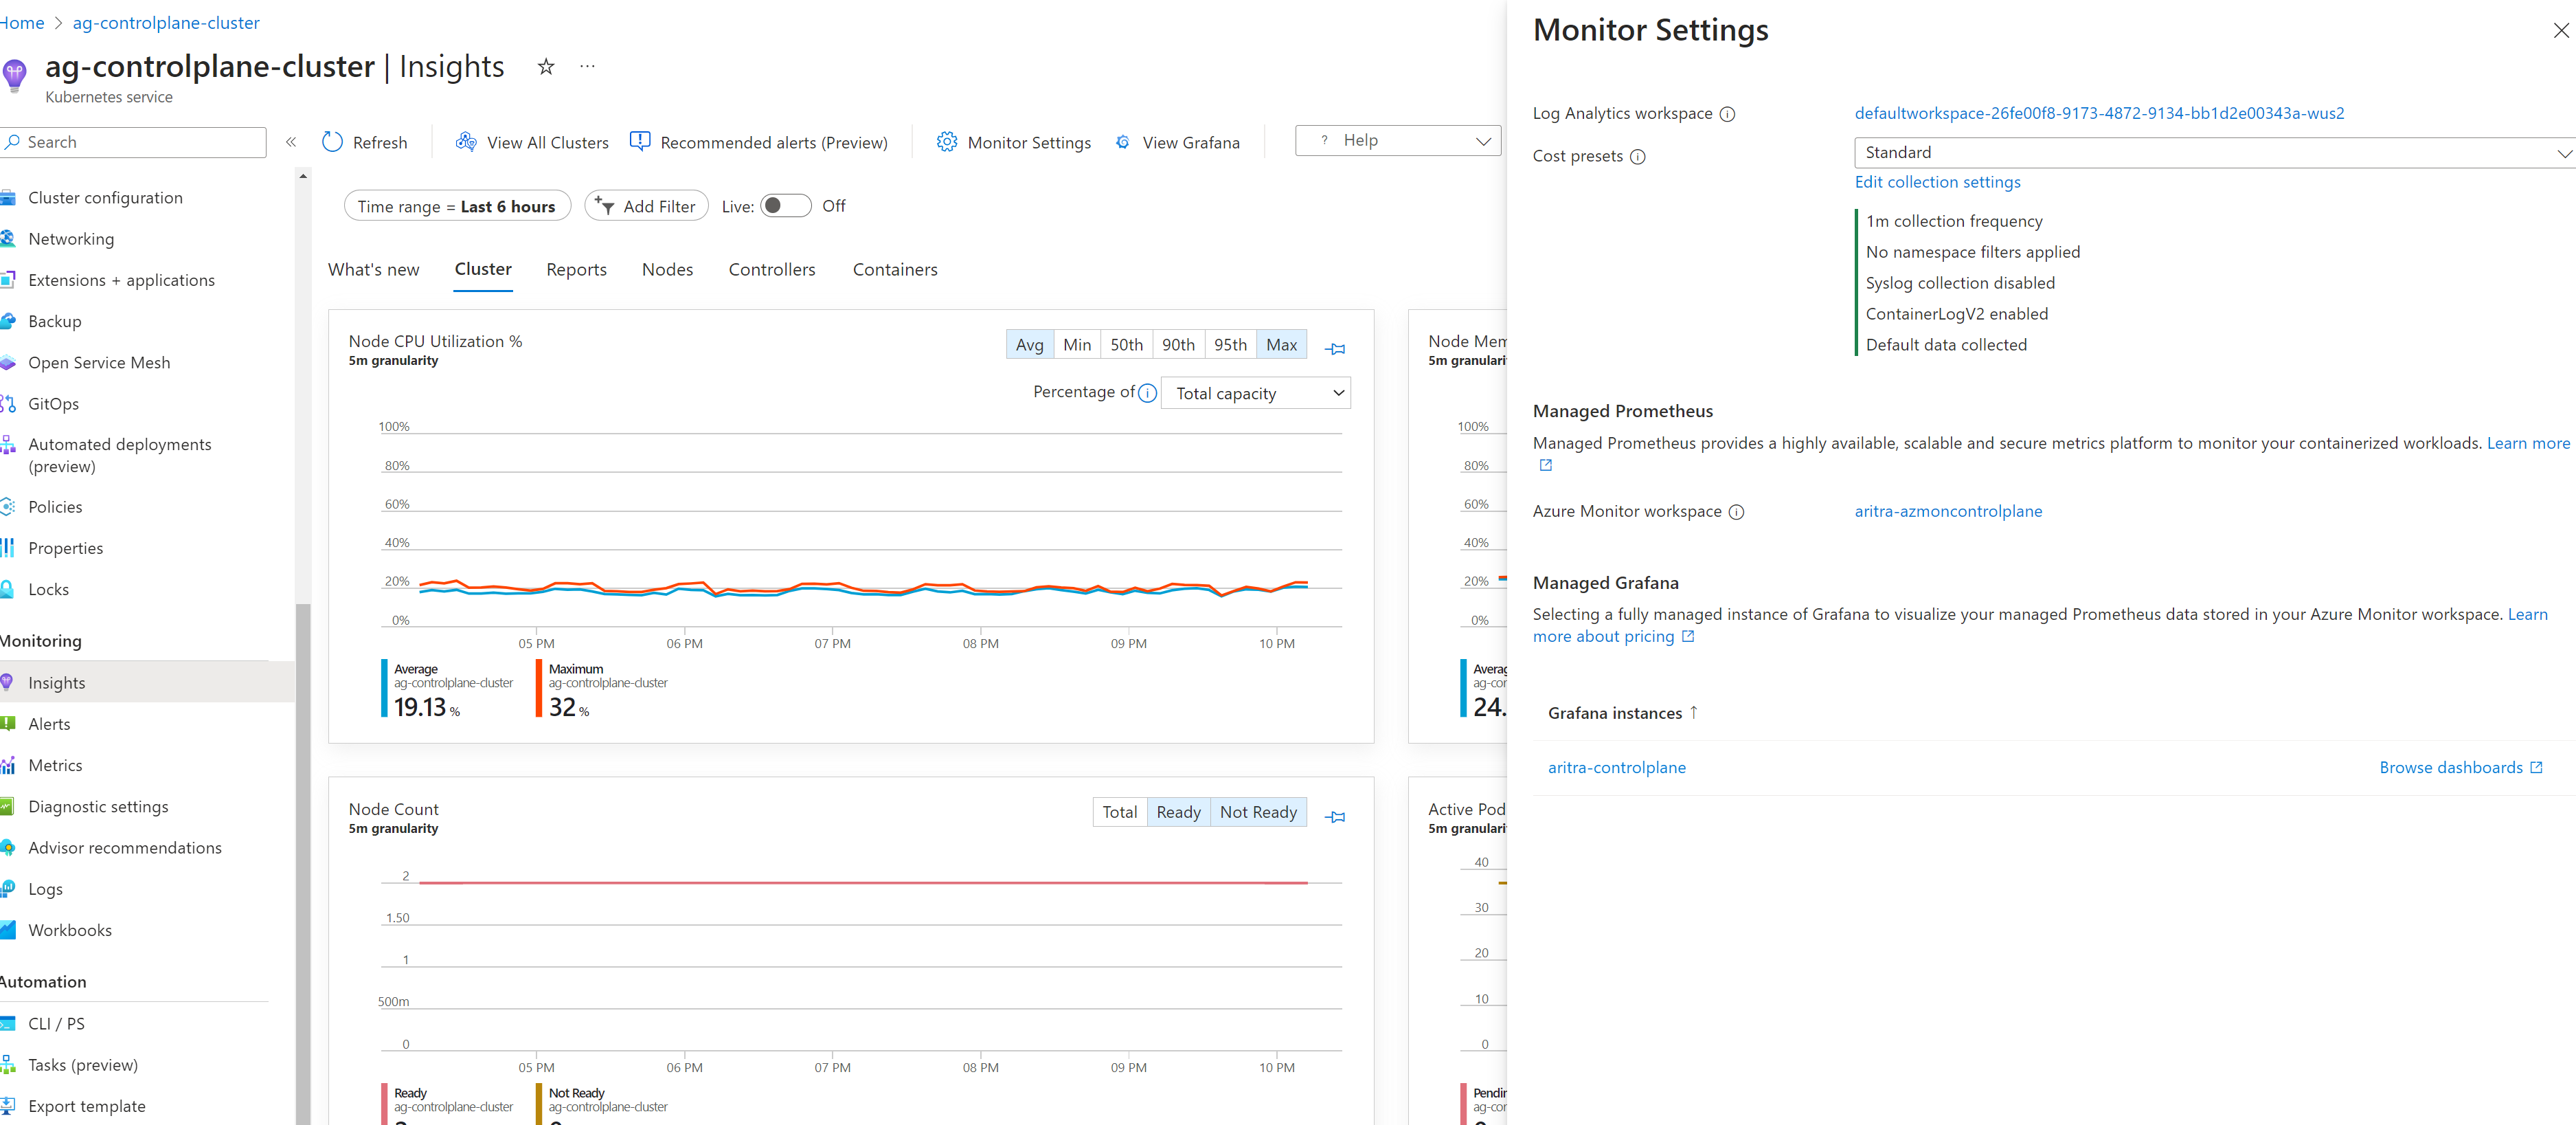
View the control plane metrics in the Azure Monitor workspace using the following steps:
In the Azure portal, navigate to your AKS cluster.
Under Monitoring, select Insights.

Note
AKS provides dashboard templates to help you view and analyze your control plane telemetry data in real-time. If you're using Azure managed Grafana to visualize the data, you can import the following dashboards:
Customize control plane metrics
AKS includes a preconfigured set of metrics to collect and store for each component. API server and etcd are enabled by default. You can customize this list through the ama-settings-configmap.
The default targets include the following values:
controlplane-apiserver = true
controlplane-cluster-autoscaler = false
controlplane-kube-scheduler = false
controlplane-kube-controller-manager = false
controlplane-etcd = true
All ConfigMaps should be applied to the kube-system namespace for any cluster.
For more information about minimal-ingestion profile metrics, see Minimal ingestion profile for control plane metrics in managed Prometheus.
Ingest only minimal metrics from default targets
When setting
default-targets-metrics-keep-list.minimalIngestionProfile="true", only the minimal set of metrics are ingested for each of the default targets:controlplane-apiserverandcontrolplane-etcd.Ingest all metrics from all targets
Collect all metrics from all targets on the cluster using the following steps:
Download the ConfigMap file ama-metrics-settings-configmap.yaml and rename it to
configmap-controlplane.yaml.Set
minimalingestionprofile = false.Under
default-scrape-settings-enabled, verify that the targets you want to scrape are set totrue. The only targets you can specify are:controlplane-apiserver,controlplane-cluster-autoscaler,controlplane-kube-scheduler,controlplane-kube-controller-manager, andcontrolplane-etcd.Apply the ConfigMap using the
kubectl applycommand.kubectl apply -f configmap-controlplane.yamlAfter the configuration is applied, it takes several minutes before the metrics from the specified targets scraped from the control plane appear in the Azure Monitor workspace.
Ingest a few other metrics in addition to minimal metrics
The
minimal ingestion profilesetting helps reduce the ingestion volume of metrics, as it only collects metrics used by default dashboards, default recording rules, and default alerts are collected. To customize this setting, use the following steps:Download the ConfigMap file ama-metrics-settings-configmap and rename it to
configmap-controlplane.yaml.Set
minimalingestionprofile = true.Under
default-scrape-settings-enabled, verify that the targets you want to scrape are set totrue. The only targets you can specify are:controlplane-apiserver,controlplane-cluster-autoscaler,controlplane-kube-scheduler,controlplane-kube-controller-manager, andcontrolplane-etcd.Under
default-targets-metrics-keep-list, specify the list of metrics for thetruetargets. For example:controlplane-apiserver= "apiserver_admission_webhook_admission_duration_seconds| apiserver_longrunning_requests"Apply the ConfigMap using the
kubectl applycommand.kubectl apply -f configmap-controlplane.yaml
After the configuration is applied, it takes several minutes before the metrics from the specified targets scraped from the control plane appear in the Azure Monitor workspace.
Ingest only specific metrics from some targets
Download the ConfigMap file ama-metrics-settings-configmap and rename it to
configmap-controlplane.yaml.Set
minimalingestionprofile = false.Under
default-scrape-settings-enabled, verify that the targets you want to scrape are set totrue. The only targets you can specify here arecontrolplane-apiserver,controlplane-cluster-autoscaler,controlplane-kube-scheduler,controlplane-kube-controller-manager, andcontrolplane-etcd.Under
default-targets-metrics-keep-list, specify the list of metrics for thetruetargets. For example:controlplane-apiserver= "apiserver_admission_webhook_admission_duration_seconds| apiserver_longrunning_requests"Apply the ConfigMap using the
kubectl applycommand.kubectl apply -f configmap-controlplane.yamlAfter the configuration is applied, it takes several minutes before the metrics from the specified targets scraped from the control plane appear in the Azure Monitor workspace.
Troubleshoot control plane metrics issues
Make sure the feature flag AzureMonitorMetricsControlPlanePreview is enabled and the ama-metrics pods are running.
Note
The troubleshooting methods for Azure managed service Prometheus don't directly translate here, as the components scraping the control plane aren't present in the managed Prometheus add-on.
ConfigMap formatting
Make sure you're using proper formatting in the ConfigMap and that the fields, specifically
default-targets-metrics-keep-list,minimal-ingestion-profile, anddefault-scrape-settings-enabled, are correctly populated with their intended values.Isolate control plane from data plane
Start by setting some of the node related metrics to
trueand verify the metrics are being forwarded to the workspace. This helps determine if the issue is specific to scraping control plane metrics.Events ingested
Once you applied the changes, you can open metrics explorer from the Azure Monitor overview page or from the Monitoring section the selected cluster and check for an increase or decrease in the number of events ingested per minute. It should help you determine if a specific metric is missing or if all metrics are missing.
Specific metric isn't exposed
There are cases where metrics are documented, but aren't exposed from the target and aren't forwarded to the Azure Monitor workspace. In this case, it's necessary to verify other metrics are being forwarded to the workspace.
No access to the Azure Monitor workspace
When you enable the add-on, you might specify an existing workspace that you don't have access to. In that case, it might look like the metrics aren't being collected and forwarded. Make sure that you create a new workspace while enabling the add-on or while creating the cluster.
Disable control plane metrics on your AKS cluster
You can disable control plane metrics at any time by disabling the managed Prometheus add-on and unregistering the AzureMonitorMetricsControlPlanePreview feature flag.
Remove the metrics add-on that scrapes Prometheus metrics using the
az aks updatecommand.az aks update --disable-azure-monitor-metrics --name $CLUSTER_NAME --resource-group $RESOURCE_GROUPDisable scraping of control plane metrics on the AKS cluster by unregistering the
AzureMonitorMetricsControlPlanePreviewfeature flag using theaz feature unregistercommand.az feature unregister "Microsoft.ContainerService" --name "AzureMonitorMetricsControlPlanePreview"
FAQ
Can I scrape control plane metrics with self hosted Prometheus?
No, you currently can't scrape control plane metrics with self hosted Prometheus. Self hosted Prometheus can only scrape the single instance depending on the load balancer. The metrics aren't reliable, as there are often multiple replicas of the control plane metrics are only visible through managed Prometheus
Why is the user agent not available through the control plane metrics?
Control plane metrics in Kubernetes don't have the user agent. The user agent is only available through the control plane logs available in the diagnostic settings.
Azure Monitor resource logs
Resource logs provide insight into operations that were done by an Azure resource. Logs are generated automatically, but you must route them to Azure Monitor logs to save or query them. Logs are organized in categories. A given namespace might have multiple resource log categories.
Collection: Resource logs aren't collected and stored until you create a diagnostic setting and route the logs to one or more locations. When you create a diagnostic setting, you specify which categories of logs to collect. There are multiple ways to create and maintain diagnostic settings, including the Azure portal, programmatically, and though Azure Policy.
Routing: The suggested default is to route resource logs to Azure Monitor Logs so you can query them with other log data. Other locations such as Azure Storage, Azure Event Hubs, and certain Microsoft monitoring partners are also available. For more information, see Azure resource logs and Resource log destinations.
For detailed information about collecting, storing, and routing resource logs, see Diagnostic settings in Azure Monitor.
For a list of all available resource log categories in Azure Monitor, see Supported resource logs in Azure Monitor.
All resource logs in Azure Monitor have the same header fields, followed by service-specific fields. The common schema is outlined in Azure Monitor resource log schema.
For the available resource log categories, their associated Log Analytics tables, and the log schemas for AKS, see Azure Kubernetes Service monitoring data reference.
AKS control plane/resource logs
Control plane logs for AKS clusters are implemented as resource logs in Azure Monitor. Resource logs aren't collected and stored until you create a diagnostic setting to route them to one or more locations. You typically send them to a Log Analytics workspace, which is where most of the data for Container insights is stored.
See Create diagnostic settings for the detailed process for creating a diagnostic setting using the Azure portal, CLI, or PowerShell. When you create a diagnostic setting, you specify which categories of logs to collect. The categories for AKS are listed in AKS monitoring data reference.
Important
There can be substantial cost when collecting resource logs for AKS, particularly for kube-audit logs. Consider the following recommendations to reduce the amount of data collected:
- Disable kube-audit logging when not required.
- Enable collection from kube-audit-admin, which excludes the get and list audit events.
- Enable resource-specific logs as described here and configure
AKSAudittable as basic logs.
See Monitor Kubernetes clusters using Azure services and cloud native tools for further recommendations and Cost optimization and Azure Monitor for further strategies to reduce your monitoring costs.
AKS supports either Azure diagnostics mode or resource-specific mode for resource logs. This mode specifies the tables in the Log Analytics workspace where the data is sent. Azure diagnostics mode sends all data to the AzureDiagnostics table, while resource-specific mode sends data to AKS Audit, AKS Audit Admin, and AKS Control Plane as shown in the table at Resource logs.
Resource-specific mode is recommended for AKS for the following reasons:
- Data is easier to query because it's in individual tables dedicated to AKS.
- Supports configuration as basic logs for significant cost savings.
For more information on the difference between collection modes including how to change an existing setting, see Select the collection mode.
Note
It is also possible to configure Diagnostic settings through the CLI. In these cases, it is not guaranteed to work successfully as it doesn't check for the cluster's provisioning state. Please make sure to check the diagnostic settings of the cluster to reflect after configuring it.
az monitor diagnostic-settings create --name AKS-Diagnostics --resource /subscriptions/xxxxxxxx-xxxx-xxxx-xxxx-xxxxxxxxxxxx/resourceGroups/myresourcegroup/providers/Microsoft.ContainerService/managedClusters/my-cluster --logs '[{"category": "kube-audit","enabled": true}, {"category": "kube-audit-admin", "enabled": true}, {"category": "kube-apiserver", "enabled": true}, {"category": "kube-controller-manager", "enabled": true}, {"category": "kube-scheduler", "enabled": true}, {"category": "cluster-autoscaler", "enabled": true}, {"category": "cloud-controller-manager", "enabled": true}, {"category": "guard", "enabled": true}, {"category": "csi-azuredisk-controller", "enabled": true}, {"category": "csi-azurefile-controller", "enabled": true}, {"category": "csi-snapshot-controller", "enabled": true}]' --workspace /subscriptions/xxxxxxxx-xxxx-xxxx-xxxx-xxxxxxxxxxxx/resourcegroups/myresourcegroup/providers/microsoft.operationalinsights/workspaces/myworkspace --export-to-resource-specific true
Sample log queries
Important
When you select Logs from the menu for an AKS cluster, Log Analytics is opened with the query scope set to the current cluster. This means that log queries will only include data from that resource. If you want to run a query that includes data from other clusters or data from other Azure services, select Logs from the Azure Monitor menu. See Log query scope and time range in Azure Monitor Log Analytics for details.
If the diagnostic setting for your cluster uses Azure diagnostics mode, the resource logs for AKS are stored in the AzureDiagnostics table. You can distinguish different logs with the Category column. For a description of each category, see AKS reference resource logs.
| Description | Log query |
|---|---|
| Count logs for each category (Azure diagnostics mode) |
AzureDiagnostics | where ResourceType == "MANAGEDCLUSTERS" | summarize count() by Category |
| All API server logs (Azure diagnostics mode) |
AzureDiagnostics | where Category == "kube-apiserver" |
| All kube-audit logs in a time range (Azure diagnostics mode) |
let starttime = datetime("2023-02-23"); let endtime = datetime("2023-02-24"); AzureDiagnostics | where TimeGenerated between(starttime..endtime) | where Category == "kube-audit" | extend event = parse_json(log_s) | extend HttpMethod = tostring(event.verb) | extend User = tostring(event.user.username) | extend Apiserver = pod_s | extend SourceIP = tostring(event.sourceIPs[0]) | project TimeGenerated, Category, HttpMethod, User, Apiserver, SourceIP, OperationName, event |
| All audit logs (resource-specific mode) |
AKSAudit |
| All audit logs excluding the get and list audit events (resource-specific mode) |
AKSAuditAdmin |
| All API server logs (resource-specific mode) |
AKSControlPlane | where Category == "kube-apiserver" |
To access a set of prebuilt queries in the Log Analytics workspace, see the Log Analytics queries interface and select resource type Kubernetes Services. For a list of common queries for Container insights, see Container insights queries.
AKS data plane/Container Insights logs
Container Insights collect various types of telemetry data from containers and Kubernetes clusters to help you monitor, troubleshoot, and gain insights into your containerized applications running in your AKS clusters. For a list of tables and their detailed descriptions used by Container insights, see the Azure Monitor table reference. All these tables are available for log queries.
Cost optimization settings allow you to customize and control the metrics data collected through the container insights agent. This feature supports the data collection settings for individual table selection, data collection intervals, and namespaces to exclude the data collection through Azure Monitor Data Collection Rules (DCR). These settings control the volume of ingestion and reduce the monitoring costs of container insights. Container insights Collected Data can be customized through the Azure portal, using the following options. Selecting any options other than All (Default) leads to the container insights experience becoming unavailable.
| Grouping | Tables | Notes |
|---|---|---|
| All (Default) | All standard container insights tables | Required for enabling the default container insights visualizations |
| Performance | Perf, InsightsMetrics | |
| Logs and events | ContainerLog or ContainerLogV2, KubeEvents, KubePodInventory | Recommended if you enabled managed Prometheus metrics |
| Workloads, Deployments, and HPAs | InsightsMetrics, KubePodInventory, KubeEvents, ContainerInventory, ContainerNodeInventory, KubeNodeInventory, KubeServices | |
| Persistent Volumes | InsightsMetrics, KubePVInventory |
The Logs and events grouping captures the logs from the ContainerLog or ContainerLogV2, KubeEvents, KubePodInventory tables, but not the metrics. The recommended path to collect metrics is to enable Azure Monitor managed service Prometheus for Prometheus from your AKS cluster and to use Azure Managed Grafana for data visualization. For more information, see Manage an Azure Monitor workspace.
ContainerLogV2 schema
Azure Monitor Container Insights provides a schema for container logs known as ContainerLogV2, which is the recommended option. This format includes the following fields to facilitate common queries for viewing data related to AKS and Azure Arc-enabled Kubernetes clusters:
- ContainerName
- PodName
- PodNamespace
In addition, this schema is compatible with Basic Logs data plan, which offers a low-cost alternative to standard analytics logs. The Basic log data plan lets you save on the cost of ingesting and storing high-volume verbose logs in your Log Analytics workspace for debugging, troubleshooting, and auditing. It doesn't affect costs for analytics and alerts. For more information, see Manage tables in a Log Analytics workspace.
ContainerLogV2 is the recommended approach and is the default schema for customers onboarding container insights with Managed Identity Auth using ARM, Bicep, Terraform, Policy, and Azure portal. For more information about how to enable ContainerLogV2 through either the cluster's Data Collection Rule (DCR) or ConfigMap, see Enable the ContainerLogV2 schema.
Azure activity log
The activity log contains subscription-level events that track operations for each Azure resource as seen from outside that resource; for example, creating a new resource or starting a virtual machine.
Collection: Activity log events are automatically generated and collected in a separate store for viewing in the Azure portal.
Routing: You can send activity log data to Azure Monitor Logs so you can analyze it alongside other log data. Other locations such as Azure Storage, Azure Event Hubs, and certain Microsoft monitoring partners are also available. For more information on how to route the activity log, see Overview of the Azure activity log.
View Azure Kubernetes Service (AKS) container logs, events, and pod metrics in real time
In this section, you learn how to use the live data feature in Container Insights to view Azure Kubernetes Service (AKS) container logs, events, and pod metrics in real time. This feature provides direct access to kubectl logs -c, kubectl get events, and kubectl top pods to help you troubleshoot issues in real time.
Note
AKS uses Kubernetes cluster-level logging architectures. The container logs are located inside /var/log/containers on the node. To access a node, see Connect to Azure Kubernetes Service (AKS) cluster nodes.
For help with setting up the live data feature, see Configure live data in Container Insights. This feature directly accesses the Kubernetes API. For more information about the authentication model, see Kubernetes API.
View AKS resource live logs
Note
To access logs from a private cluster, you need to be on a machine on the same private network as the cluster.
In the Azure portal, navigate to your AKS cluster.
Under Kubernetes resources, select Workloads.
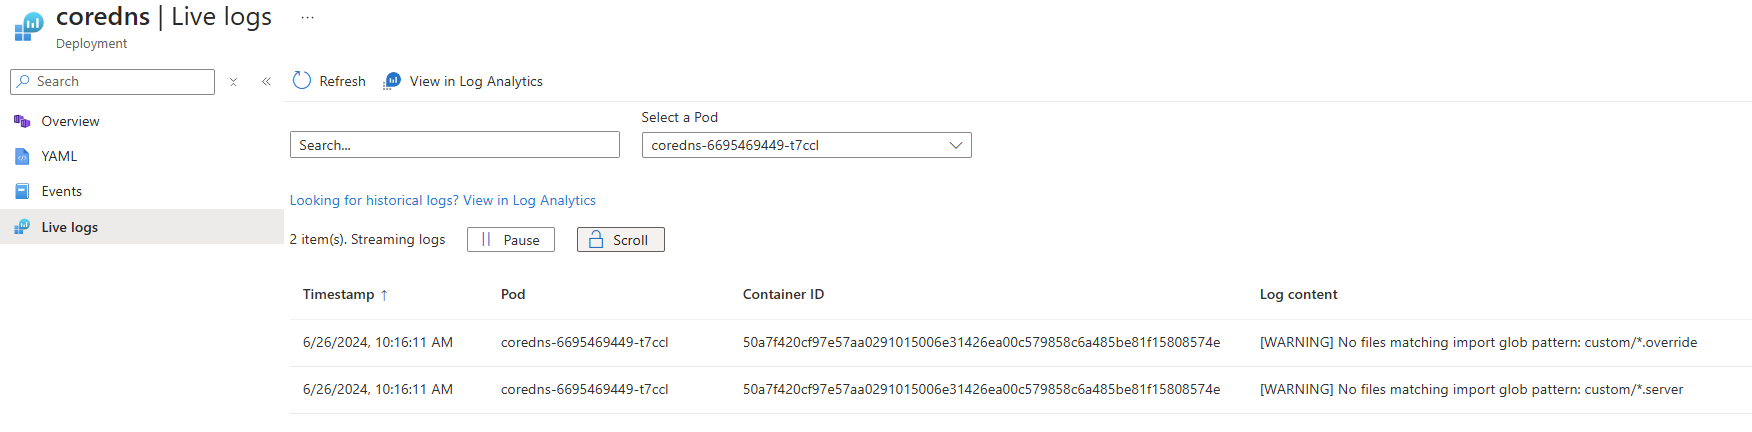
Select the Deployment, Pod, Replica Set, Stateful Set, Job, or Cron Job that you want to view logs for, and then select Live Logs.
Select the resource you want to view logs for.
The following example shows the logs for a Pod resource:

View live logs
You can view real time log data as the container engine generates it on the Cluster, Nodes, Controllers, or Containers.
In the Azure portal, navigate to your AKS cluster.
Under Monitoring, select Insights.
Select the Cluster, Nodes, Controllers, or Containers tab, and then select the object you want to view logs for.
On the resource Overview, select Live Logs.
Note
To view the data from your Log Analytics workspace, select View Logs in Log Analytics. To learn more about viewing historical logs, events, and metrics, see How to query logs from Container Insights.
After successful authentication, if data can be retrieved, it begins streaming to the Live Logs tab. You can view log data here in a continuous stream. The following image shows the logs for a Container resource:


View live events
You can view real-time event data as the container engine generates it on the Cluster, Nodes, Controllers, or Containers.
In the Azure portal, navigate to your AKS cluster.
Under Monitoring, select Insights.
Select the Cluster, Nodes, Controllers, or Containers tab, and then select the object you want to view events for.
On the resource Overview page, select Live Events.
Note
To view the data from your Log Analytics workspace, select View Events in Log Analytics. To learn more about viewing historical logs, events, and metrics, see How to query logs from Container Insights.
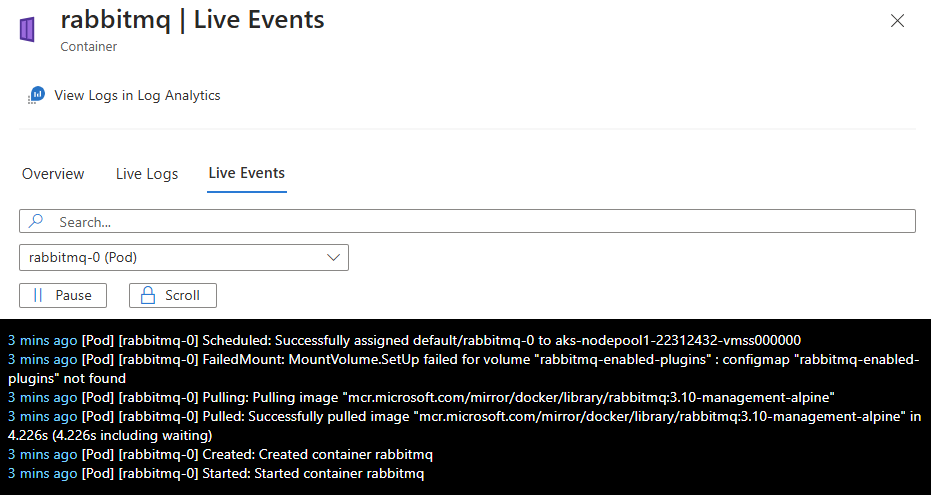
After successful authentication, if data can be retrieved, it begins streaming to the Live Events tab. The following image shows the events for a Container resource:

View metrics
You can view real-time metrics data as the container engine generates it on the Nodes or Controllers by selecting a Pod resource.
In the Azure portal, navigate to your AKS cluster.
Under Monitoring, select Insights.
Select the Nodes or Controllers tab, and then select the Pod object you want to view metrics for.
On the resource Overview page, select Live Metrics.
Note
To view the data from your Log Analytics workspace, select View Events in Log Analytics. To learn more about viewing historical logs, events, and metrics, see How to query logs from Container Insights.
After successful authentication, if data can be retrieved, it begins streaming to the Live Metrics tab. The following image shows the metrics for a Pod resource:


Analyze monitoring data
There are many tools for analyzing monitoring data.
Azure Monitor tools
Azure Monitor supports the following basic tools:
Metrics explorer, a tool in the Azure portal that allows you to view and analyze metrics for Azure resources. For more information, see Analyze metrics with Azure Monitor metrics explorer.
Log Analytics, a tool in the Azure portal that allows you to query and analyze log data by using the Kusto query language (KQL). For more information, see Get started with log queries in Azure Monitor.
The activity log, which has a user interface in the Azure portal for viewing and basic searches. To do more in-depth analysis, you have to route the data to Azure Monitor logs and run more complex queries in Log Analytics.
Tools that allow more complex visualization include:
- Dashboards that let you combine different kinds of data into a single pane in the Azure portal.
- Workbooks, customizable reports that you can create in the Azure portal. Workbooks can include text, metrics, and log queries.
- Grafana, an open platform tool that excels in operational dashboards. You can use Grafana to create dashboards that include data from multiple sources other than Azure Monitor.
- Power BI, a business analytics service that provides interactive visualizations across various data sources. You can configure Power BI to automatically import log data from Azure Monitor to take advantage of these visualizations.
Azure Monitor export tools
You can get data out of Azure Monitor into other tools by using the following methods:
Metrics: Use the REST API for metrics to extract metric data from the Azure Monitor metrics database. The API supports filter expressions to refine the data retrieved. For more information, see Azure Monitor REST API reference.
Logs: Use the REST API or the associated client libraries.
Another option is the workspace data export.
To get started with the REST API for Azure Monitor, see Azure monitoring REST API walkthrough.
Monitoring overview page in Azure portal
The Monitoring tab on the Overview page for your AKS cluster resource offers a quick way to start viewing monitoring data in the Azure portal. This tab includes graphs with common metrics for the cluster separated by node pool. You can select any of these graphs to further analyze the data in the metrics explorer.
The Monitoring tab also includes links to Managed Prometheus and Container Insights for the cluster. If you need to enable these tools, you can enable them here. You might also see a banner at the top of the screen recommending that you enable other features to improve monitoring of your cluster.
Tip
You can access monitoring features for all AKS clusters in your subscription by selecting Azure Monitor on the Azure portal home page.
Kusto queries
You can analyze monitoring data in the Azure Monitor Logs / Log Analytics store by using the Kusto query language (KQL).
Important
When you select Logs from the service's menu in the portal, Log Analytics opens with the query scope set to the current service. This scope means that log queries will only include data from that type of resource. If you want to run a query that includes data from other Azure services, select Logs from the Azure Monitor menu. See Log query scope and time range in Azure Monitor Log Analytics for details.
For a list of common queries for any service, see the Log Analytics queries interface.
Alerts
Azure Monitor alerts proactively notify you when specific conditions are found in your monitoring data. Alerts allow you to identify and address issues in your system before your customers notice them. For more information, see Azure Monitor alerts.
There are many sources of common alerts for Azure resources. For examples of common alerts for Azure resources, see Sample log alert queries. The Azure Monitor Baseline Alerts (AMBA) site provides a semi-automated method of implementing important platform metric alerts, dashboards, and guidelines. The site applies to a continually expanding subset of Azure services, including all services that are part of the Azure Landing Zone (ALZ).
The common alert schema standardizes the consumption of Azure Monitor alert notifications. For more information, see Common alert schema.
Types of alerts
You can alert on any metric or log data source in the Azure Monitor data platform. There are many different types of alerts depending on the services you're monitoring and the monitoring data you're collecting. Different types of alerts have various benefits and drawbacks. For more information, see Choose the right monitoring alert type.
The following list describes the types of Azure Monitor alerts you can create:
- Metric alerts evaluate resource metrics at regular intervals. Metrics can be platform metrics, custom metrics, logs from Azure Monitor converted to metrics, or Application Insights metrics. Metric alerts can also apply multiple conditions and dynamic thresholds.
- Log alerts allow users to use a Log Analytics query to evaluate resource logs at a predefined frequency.
- Activity log alerts trigger when a new activity log event occurs that matches defined conditions. Resource Health alerts and Service Health alerts are activity log alerts that report on your service and resource health.
Some Azure services also support smart detection alerts, Prometheus alerts, or recommended alert rules.
For some services, you can monitor at scale by applying the same metric alert rule to multiple resources of the same type that exist in the same Azure region. Individual notifications are sent for each monitored resource. For supported Azure services and clouds, see Monitor multiple resources with one alert rule.
Recommended alert rules
For some Azure services, you can enable recommended out-of-the-box alert rules.
The system compiles a list of recommended alert rules based on:
- The resource provider's knowledge of important signals and thresholds for monitoring the resource.
- Data that tells what customers commonly alert on for this resource.
Note
Recommended alert rules are available for:
- Virtual machines
- Azure Kubernetes Service (AKS) resources
- Log Analytics workspaces
Prometheus metrics based alerts
When you enable collection of Prometheus metrics for your cluster, you can download a collection of recommended Prometheus alert rules. This download includes the following rules:
| Level | Alerts |
|---|---|
| Cluster level | KubeCPUQuotaOvercommit KubeMemoryQuotaOvercommit KubeContainerOOMKilledCount KubeClientErrors KubePersistentVolumeFillingUp KubePersistentVolumeInodesFillingUp KubePersistentVolumeErrors KubeContainerWaiting KubeDaemonSetNotScheduled KubeDaemonSetMisScheduled KubeQuotaAlmostFull |
| Node level | KubeNodeUnreachable KubeNodeReadinessFlapping |
| Pod level | KubePVUsageHigh KubeDeploymentReplicasMismatch KubeStatefulSetReplicasMismatch KubeHpaReplicasMismatch KubeHpaMaxedOut KubePodCrashLooping KubeJobStale KubePodContainerRestart KubePodReadyStateLow KubePodFailedState KubePodNotReadyByController KubeStatefulSetGenerationMismatch KubeJobFailed KubeContainerAverageCPUHigh KubeContainerAverageMemoryHigh KubeletPodStartUpLatencyHigh |
See How to create log alerts from Container Insights and How to query logs from Container Insights. Log alerts can measure two different things, which can be used to monitor in different scenarios:
- Result count: Counts the number of rows returned by the query and can be used to work with events such as Windows event logs, Syslog, and application exceptions.
- Calculation of a value: Makes a calculation based on a numeric column and can be used to include any number of resources. An example is CPU percentage.
Depending on the alerting scenario required, log queries need to be created comparing a DateTime to the present time by using the now operator and going back one hour. To learn how to build log-based alerts, see Create log alerts from Container insights.
AKS alert rules
The following table lists some suggested alert rules for AKS. These alerts are just examples. You can set alerts for any metric, log entry, or activity log entry listed in the Azure Kubernetes Service monitoring data reference.
| Condition | Description |
|---|---|
| CPU Usage Percentage > 95 | Fires when the average CPU usage across all nodes exceeds the threshold. |
| Memory Working Set Percentage > 100 | Fires when the average working set across all nodes exceeds the threshold. |
Advisor recommendations
For some services, if critical conditions or imminent changes occur during resource operations, an alert displays on the service Overview page in the portal. You can find more information and recommended fixes for the alert in Advisor recommendations under Monitoring in the left menu. During normal operations, no advisor recommendations display.
For more information on Azure Advisor, see Azure Advisor overview.
Note
If you're creating or running an application that runs on your service, Azure Monitor application insights might offer more types of alerts.
Network Observability
Network observability is an important part of maintaining a healthy and performant Kubernetes cluster. By collecting and analyzing data about network traffic, you can gain insights into how your cluster is operating and identify potential problems before they cause outages or performance degradation.
When the Network Observability add-on is enabled, it collects and converts useful metrics into Prometheus format, which can be visualized in Grafana. When enabled, the collected metrics are automatically ingested into Azure Monitor managed service for Prometheus. A Grafana dashboard is available in the Grafana public dashboard repo to visualize the network observability metrics collected by Prometheus. For more information, see Network Observability setup for detailed instructions.
Related content
- See Azure Kubernetes Service monitoring data reference for a reference of the metrics, logs, and other important values created for AKS.
- See Monitoring Azure resources with Azure Monitor for general details on monitoring Azure resources.

Azure Kubernetes Service