Control the OT traffic monitored by Microsoft Defender for IoT
This article is one in a series of articles describing the deployment path for OT monitoring with Microsoft Defender for IoT.

Microsoft Defender for IoT OT network sensors automatically run deep packet detection for IT and OT traffic, resolving network device data, such as device attributes and behavior.
After installing, activating, and configuring your OT network sensor, use the tools described in this article to analyze the traffic that's detected automatically, add extra subnets if needed, and control the traffic information included in Defender for IoT alerts.
Prerequisites
Before performing the procedures in this article, you must have:
An OT network sensor installed, configured, and activated.
Access to your OT network sensor and on-premises management console as an Admin user. For more information, see On-premises users and roles for OT monitoring with Defender for IoT.
This step is performed by your deployment teams.
Analyze your deployment
After onboarding a new OT network sensor to Microsoft Defender for IoT, validate that your sensor is deployed correctly by analyzing the traffic being monitored.
To analyze your network:
Sign into your OT sensor as an Admin user and select System settings > Basic > Deployment.
Select Analyze. The analysis starts, and a tab is shown for each interface that's monitored by the sensor. Each tab shows the subnets detected by the indicated interface.
Each interface tab shows the following details:
- Connection status, indicated by a green or red connection icon in the tab name. For example, in the image above, the eth1 interface shows as green, and is therefore connected.
- The total number of detected subnets and VLANs, shown at the top of the tab.
- The protocols detected on each subnet.
- The number of unicast addresses detected for each subnet.
- Whether broadcast traffic is detected for each subnet, indicating a local network.
Wait for the analysis to complete, and then check each interface tab to understand whether the interface is monitoring relevant traffic, or needs further fine-tuning.
If the traffic shown on the Deployment page isn't what you expect, you might need to fine tune your deployment by changing the sensor's location in the network, or verifying that your monitoring interfaces are connected correctly. If you make any changes and want to analyze the traffic again to see if it's improved, select Analyze again to see the updated monitoring state.
Fine tune your subnet list
After having analyzed the traffic your sensor is monitoring and fine tuning the deployment, you may need to further fine tune your subnet list. Use this procedure to ensure that your subnets are configured correctly.
While your OT sensor automatically learns your network subnets during the initial deployment, we recommend analyzing the detected traffic and updating them as needed to optimize your map views and device inventory.
Also use this procedure to also define subnet settings, determining how devices are displayed in the sensor's device map and the Azure device inventory.
- In the device map, IT devices are automatically aggregated by subnet, where you can expand and collapse each subnet view to drill down as needed.
- In the Azure device inventory, once the subnets have been configured, use the Network location (Public preview) filter to view local or routed devices as defined in your subnets list. All of the devices associated with the listed subnets are displayed as local, while devices associated with detected subnets not included in the list will be displayed as routed.
While the OT network sensor automatically learns the subnets in your network, we recommend confirming the learned settings and updating them as needed to optimize your map views and device inventory. Any subnets not listed as subnets are treated as external networks.
Tip
When you're ready to start managing your OT sensor settings at scale, define subnets from the Azure portal. Once you apply settings from the Azure portal, settings on the sensor console are read-only. For more information, see Configure OT sensor settings from the Azure portal (Public preview).
To fine-tune your detected subnets:
Sign into your OT sensor as an Admin user and select System settings > Basic > Subnets. For example:
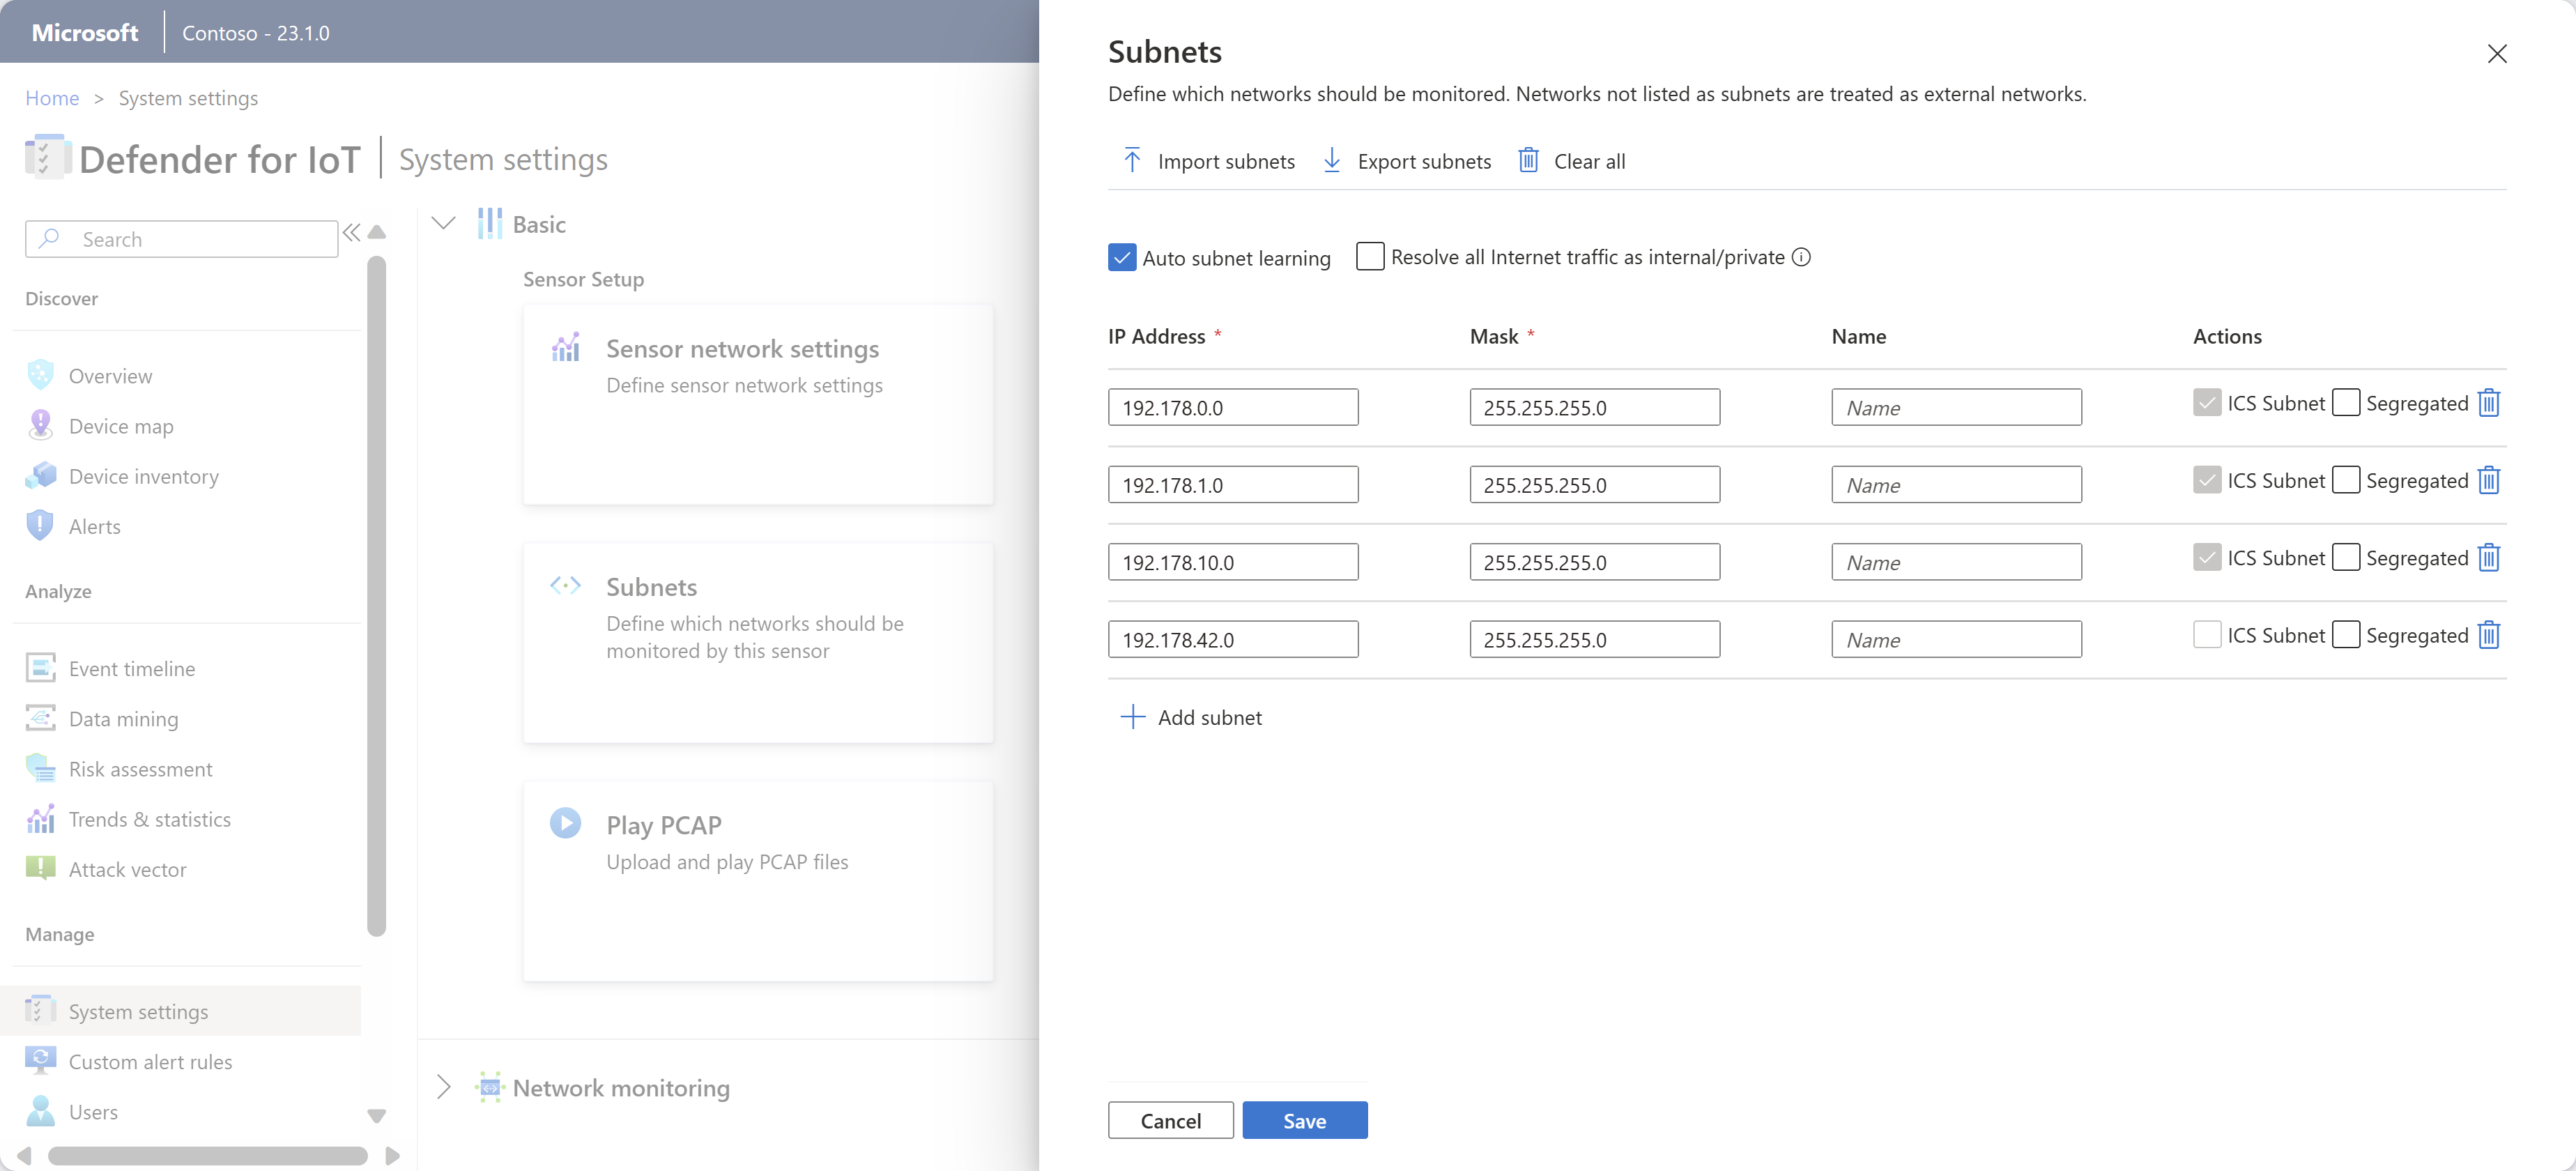
Update the subnets listed using any of the following options:
Name Description Import subnets Import a .CSV file of subnet definitions. The subnet information is updated with the information that you imported. If you import an empty field, you lose the data in that field. Export subnets Export the currently listed subnets to a .CSV file. Clear all Clear all currently defined subnets. Auto subnet learning Selected by default. Clear this option to prevent the sensor from detecting your subnets automatically. Resolve all Internet traffic as internal/private Select to consider all public IP addresses as private, local addresses. If selected, public IP addresses are treated as local addresses, and alerts aren't sent about unauthorized internet activity.
This option reduces notifications and alerts received about external addresses.IP address Define the subnet's IP address. Mask Define the subnet's IP mask. Name We recommend that you enter a meaningful name that specifies the subnet's network role. Subnet names can have up to 60 characters. Segregated Select to show this subnet separately when displaying the device map according to Purdue level. Remove subnet Select to remove any subnets that aren't related to your IoT/OT network scope. In the subnet grid, subnets marked as ICS subnet are recognized as OT networks. This option is read-only in this grid, but you can manually define a subnet as ICS if there's an OT subnet not being recognized correctly.
When you're done, select Save to save your updates.
Tip
Once the Auto subnet learning setting is disabled and the subnet list has been edited to include only the locally monitored subnets that are in your IoT/OT scope, you can filter the Azure device inventory by Network location to view only the devices defined as local. For more information, see View the device inventory.
Manually define a subnet as ICS
If you have an OT subnet that isn't being marked automatically as an ICS subnet by the sensor, edit the device type for any of the devices in the relevant subnet to an ICS or IoT device type. The subnet will then be automatically marked by the sensor as an ICS subnet.
Note
To manually change the subnet to be marked as ICS, change the device type in the device inventory in the OT sensor. In the Azure portal, subnets in the subnet list are marked as ICS by default in the sensor settings.
To change the device type to manually update the subnet:
Sign in to your OT sensor console and go to Device inventory.
In the device inventory grid, select a device from the relevant subnet, and then select Edit in the toolbar at the top of the page.
In the Type field, select a device type from the dropdown list that is listed under ICS or IoT.
The subnet will now be marked as an ICS subnet in the sensor.
For more information, see Edit device details.
Customize port and VLAN names
Use the following procedures to enrich the device data shown in Defender for IoT by customizing port and VLAN names on your OT network sensors.
For example, you might want to assign a name to a nonreserved port that shows unusually high activity in order to call it out, or to assign a name to a VLAN number in order to identify it quicker.
Note
For cloud-connected sensors, you may eventually start configuring OT sensor settings from the Azure portal. Once you start configuring settings from the Azure portal, the VLANs and Port naming panes on the OT sensors are read-only. For more information, see Configure OT sensor settings from the Azure portal.
Customize names of detected ports
Defender for IoT automatically assigns names to most universally reserved ports, such as DHCP or HTTP. However, you might want to customize the name of a specific port to highlight it, such as when you're watching a port with unusually high detected activity.
Port names are shown in Defender for IoT when viewing device groups from the OT sensor's device map, or when you create OT sensor reports that include port information.
To customize a port name:
Sign into your OT sensor as an Admin user.
Select System settings and then, under Network monitoring, select Port Naming.
In the Port naming pane that appears, enter the port number you want to name, the port's protocol, and a meaningful name. Supported protocol values include: TCP, UDP, and BOTH.
Select + Add port to customize another port, and Save when you're done.
Customize a VLAN name
VLANs are either discovered automatically by the OT network sensor or added manually. Automatically discovered VLANs can't be edited or deleted, but manually added VLANs require a unique name. If a VLAN isn't explicitly named, the VLAN's number is shown instead.
VLAN's support is based on 802.1q (up to VLAN ID 4094).
Note
VLAN names aren't synchronized between the OT network sensor and the on-premises management console. If you want to view customized VLAN names on the on-premises management console, define the VLAN names there as well.
To configure VLAN names on an OT network sensor:
Sign in to your OT sensor as an Admin user.
Select System Settings and then, under Network monitoring, select VLAN Naming.
In the VLAN naming pane that appears, enter a VLAN ID and unique VLAN name. VLAN names can contain up to 50 ASCII characters.
Select + Add VLAN to customize another VLAN, and Save when you're done.
For Cisco switches: Add the
monitor session 1 destination interface XX/XX encapsulation dot1qcommand to the SPAN port configuration, where XX/XX is the name and number of the port.
Define DNS servers
Enhance device data enrichment by configuring multiple DNS servers to carryout reverse lookups and resolve host names or FQDNs associated with the IP addresses detected in network subnets. For example, if a sensor discovers an IP address, it might query multiple DNS servers to resolve the host name. You need the DNS server address, server port and the subnet addresses.
To define the DNS server lookup:
On your OT sensor console, select System settings > Network monitoring and under Active Discovery, select Reverse DNS Lookup.
Use the Schedule Reverse Lookup options to define your scan as in fixed intervals, per hour, or at a specific time.
If you select By specific times, use a 24-hour clock, such as 14:30 for 2:30 PM. Select the + button on the side to add additional, specific times that you want the lookup to run.
Select Add DNS Server, and then populate your fields as needed to define the following fields:
- DNS server address, which is the DNS server IP address
- DNS server port
- Number of labels, which is the number of domain labels you want to display. To get this value, resolve the network IP address to device FQDNs. You can enter up to 30 characters in this field.
- Subnets, which is the subnets that you want the DNS server to query
Toggle on the Enabled option at the top to start the reverse lookup query as scheduled, and then select Save to finish the configuration.
For more information, see Configure reverse DNS lookup.
Test the DNS configuration
Use a test device to verify that the reverse DNS lookup settings you'd defined work as expected.
On your sensor console, select System settings > Network monitoring and under Active Discovery, select Reverse DNS Lookup.
Make sure that the Enabled toggle is selected.
Select Test.
In the DNS reverse lookup test for server dialog, enter an address in the Lookup Address and then select Test.
Configure DHCP address ranges
Your OT network might consist of both static and dynamic IP addresses.
- Static addresses are typically found on OT networks through historians, controllers, and network infrastructure devices such as switches and routers.
- Dynamic IP allocation is typically implemented on guest networks with laptops, PCs, smartphones, and other portable equipment, using Wi-Fi or LAN physical connections in different locations.
If you're working with dynamic networks, you need to handle IP addresses changes as they occur, by defining DHCP address ranges on each OT network sensor. When an IP address is defined as a DHCP address, Defender for IoT identifies any activity happening on the same device, regardless of IP address changes.
To define DHCP address ranges:
Sign into your OT sensor and select System settings > Network monitoring > DHCP Ranges.
Do one of the following:
- To add a single range, select + Add range and enter the IP address range and an optional name for your range.
- To add multiple ranges, create a .CSV file with columns for the From, To, and Name data for each of your ranges. Select Import to import the file to your OT sensor. Range values imported from a .CSV file overwrite any range data currently configured for your sensor.
- To export currently configured ranges to a .CSV file, select Export.
- To clear all currently configured ranges, select Clear all.
Range names can have up to 256 characters.
Select Save to save your changes.
Configure traffic filters (advanced)
To reduce alert fatigue and focus your network monitoring on high priority traffic, you may decide to filter the traffic that streams into Defender for IoT at the source. Capture filters are configured via the OT sensor CLI, and allow you to block high-bandwidth traffic at the hardware layer, optimizing both appliance performance and resource usage.
For more information, see: