Note
Access to this page requires authorization. You can try signing in or changing directories.
Access to this page requires authorization. You can try changing directories.
Important
- The Performance widget is designed exclusively for website analysis and isn't applicable for mobile application performance monitoring.
- Clarity transitioned from FID to INP in January 2025.
Overview
Clarity's Performance widget is a fundamental feature designed for website owners to monitor and enhance the site's user experience. This widget is aligned with the industry standards for core web vitals, offering insights into critical metrics that affect loading performance, interactivity, and visual stability.

Core web vitals
Core Web Vitals are key metrics crucial for superior user experience on your website that includes:
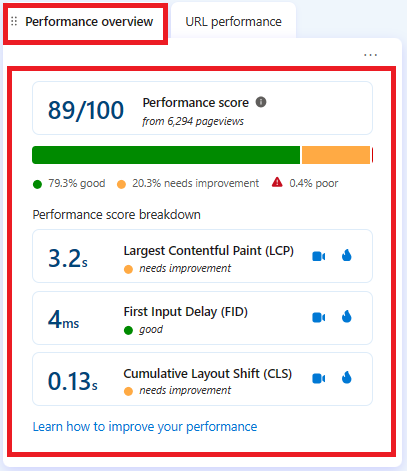
Largest Contentful Paint (LCP): LCP metric measures the loading performance of the primary content of a page. An ideal LCP occurs within 2.5 seconds of the initiation of page loading.
Interaction to Next Point (INP): INP measures the duration from the initial user interaction with your site to the point at which the browser can respond. The target for INP is 200 milliseconds or less.
Cumulative Layout Shift (CLS): CLS assesses the stability of your page layout. CLS with 0.1 seconds or less is considered good.
Understanding the performance widget
Note
LCP, INP, and CLS displayed here are the 75th percentile. Selecting heatmaps or recordings icon filters the result with the numbers that are larger than the ones on the widget.
The performance widget contains two tabs:
Performance Overview: This tab instantly provides comprehensive scores for your website. It also includes the performance score breakdown with an option to view related recordings and heatmaps.
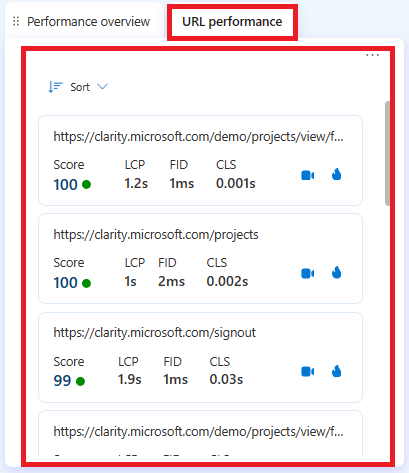
URL Performance: Explore every page for in-depth insights and trend analysis. The URLs can be sorted based on Score, LCP, INP, and CLS. Watch the related recordings and heatmaps to analyze further.
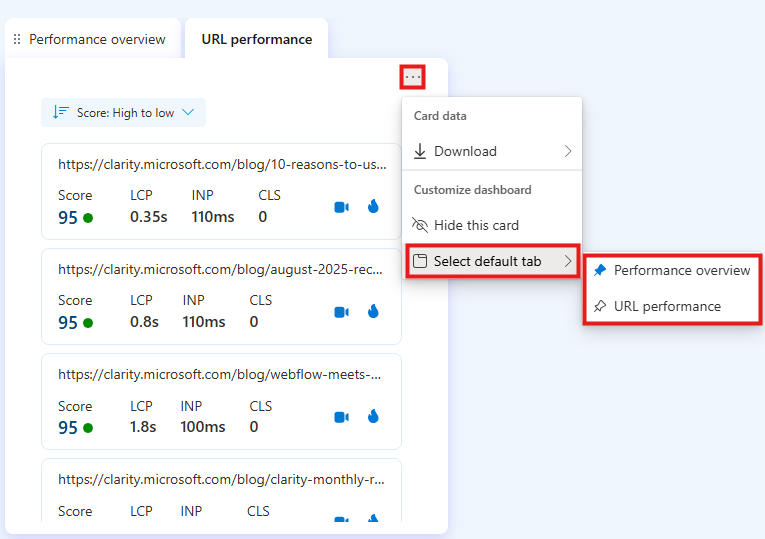
By default, performance overview tab is pinned. You can change the default tab as follows:
Go to Card data -> Customize dashboard -> Select default tab. Choose performance overview or url performance.
Identifying causes and solutions
LCP
Causes: Large images, slow server responses, or render-blocking JavaScript and CSS.
Solutions: Server upgrades, image optimization, and minimizing or deferring JavaScript and CSS.
INP
Causes: Often caused by heavy JavaScript execution and large rendering updates.
Solutions: Reducing, deferring, or asynchronously loading JavaScript, and employing web workers. Optimize rendering work. Break up long tasks.
CLS
Causes: Dynamic content loading, unassigned image dimensions, and ad or embed shifts.
Solutions: Specifying image and video dimensions, static space allocation for ads and embeds.
How to use the widget data?
LCP: Watch user session recordings on pages with the highest LCP to observe user responses to slow loading times. Assess whether users choose to wait or exit the page. Implement optimizations such as image compression or code reduction based on your insights.
INP: Watch recordings to observe user interactions with elements on pages with low INP scores (For example: INP
<=200 ms indicates that there's a need for improvement. For more information, see Filters). Look for signs of frustrations or instances repeated clicks. Use heatmaps to identify areas with high user activity and potential bottlenecks. Optimize JavaScript execution and streamline interactive elements.CLS: Identify problematic pages and review recordings to observe instances where users experience unexpected layout shifts. Analyze heatmaps for affected areas, especially where users clicked or attempted to interact. Stabilize layout elements and validate changes through the widget. Confirm users experience improvements in new recordings and heatmaps.
FAQ
For more answers, refer to Insights FAQ.