Filters overview
Clarity offers a wide range of powerful filters to help you sort and customize Recordings, Heatmaps, and Dashboard. By choosing the right filter for your needs, you can find interesting patterns in your data and make better-informed decisions.
Use filters to drill deep into user behavior at page or a session-level. For example, you can use page filters to focus on data related only to a specific page on your site. You can also use session filters to understand how diverse types of users interact with your site.
Tip
Save your favorite filter combinations as a segment so you can easily find them later.
Where do I find the filters?
With any of your projects open, you can find the filters from Dashboard, Recordings, or Heatmaps pages.
On the Dashboard, select Filters to show the filters.

On Session Recordings, select Filters to show the filters.

On Heatmaps, select Filters to show the filters.

Note
Filters set in one of these three areas usually remain in effect when you switch your view from one to another. For example, you can set a browser filter in Heatmaps and use it again on your Dashboard or Recordings. The exception is when a filter is applied only for one specific area (e.g., session filters).
Filter groups
There are 30+ filters available, so Clarity organized them into groups based on relevant categories.
Navigate through the filters by using the left bar. You can choose from the following groups on the navigation bar:
Go to a filter group by selecting it from the navigation bar, or scroll down the page until you see it.
Filtering by User info
The User info filter group helps you to screen results by information about your visitors:
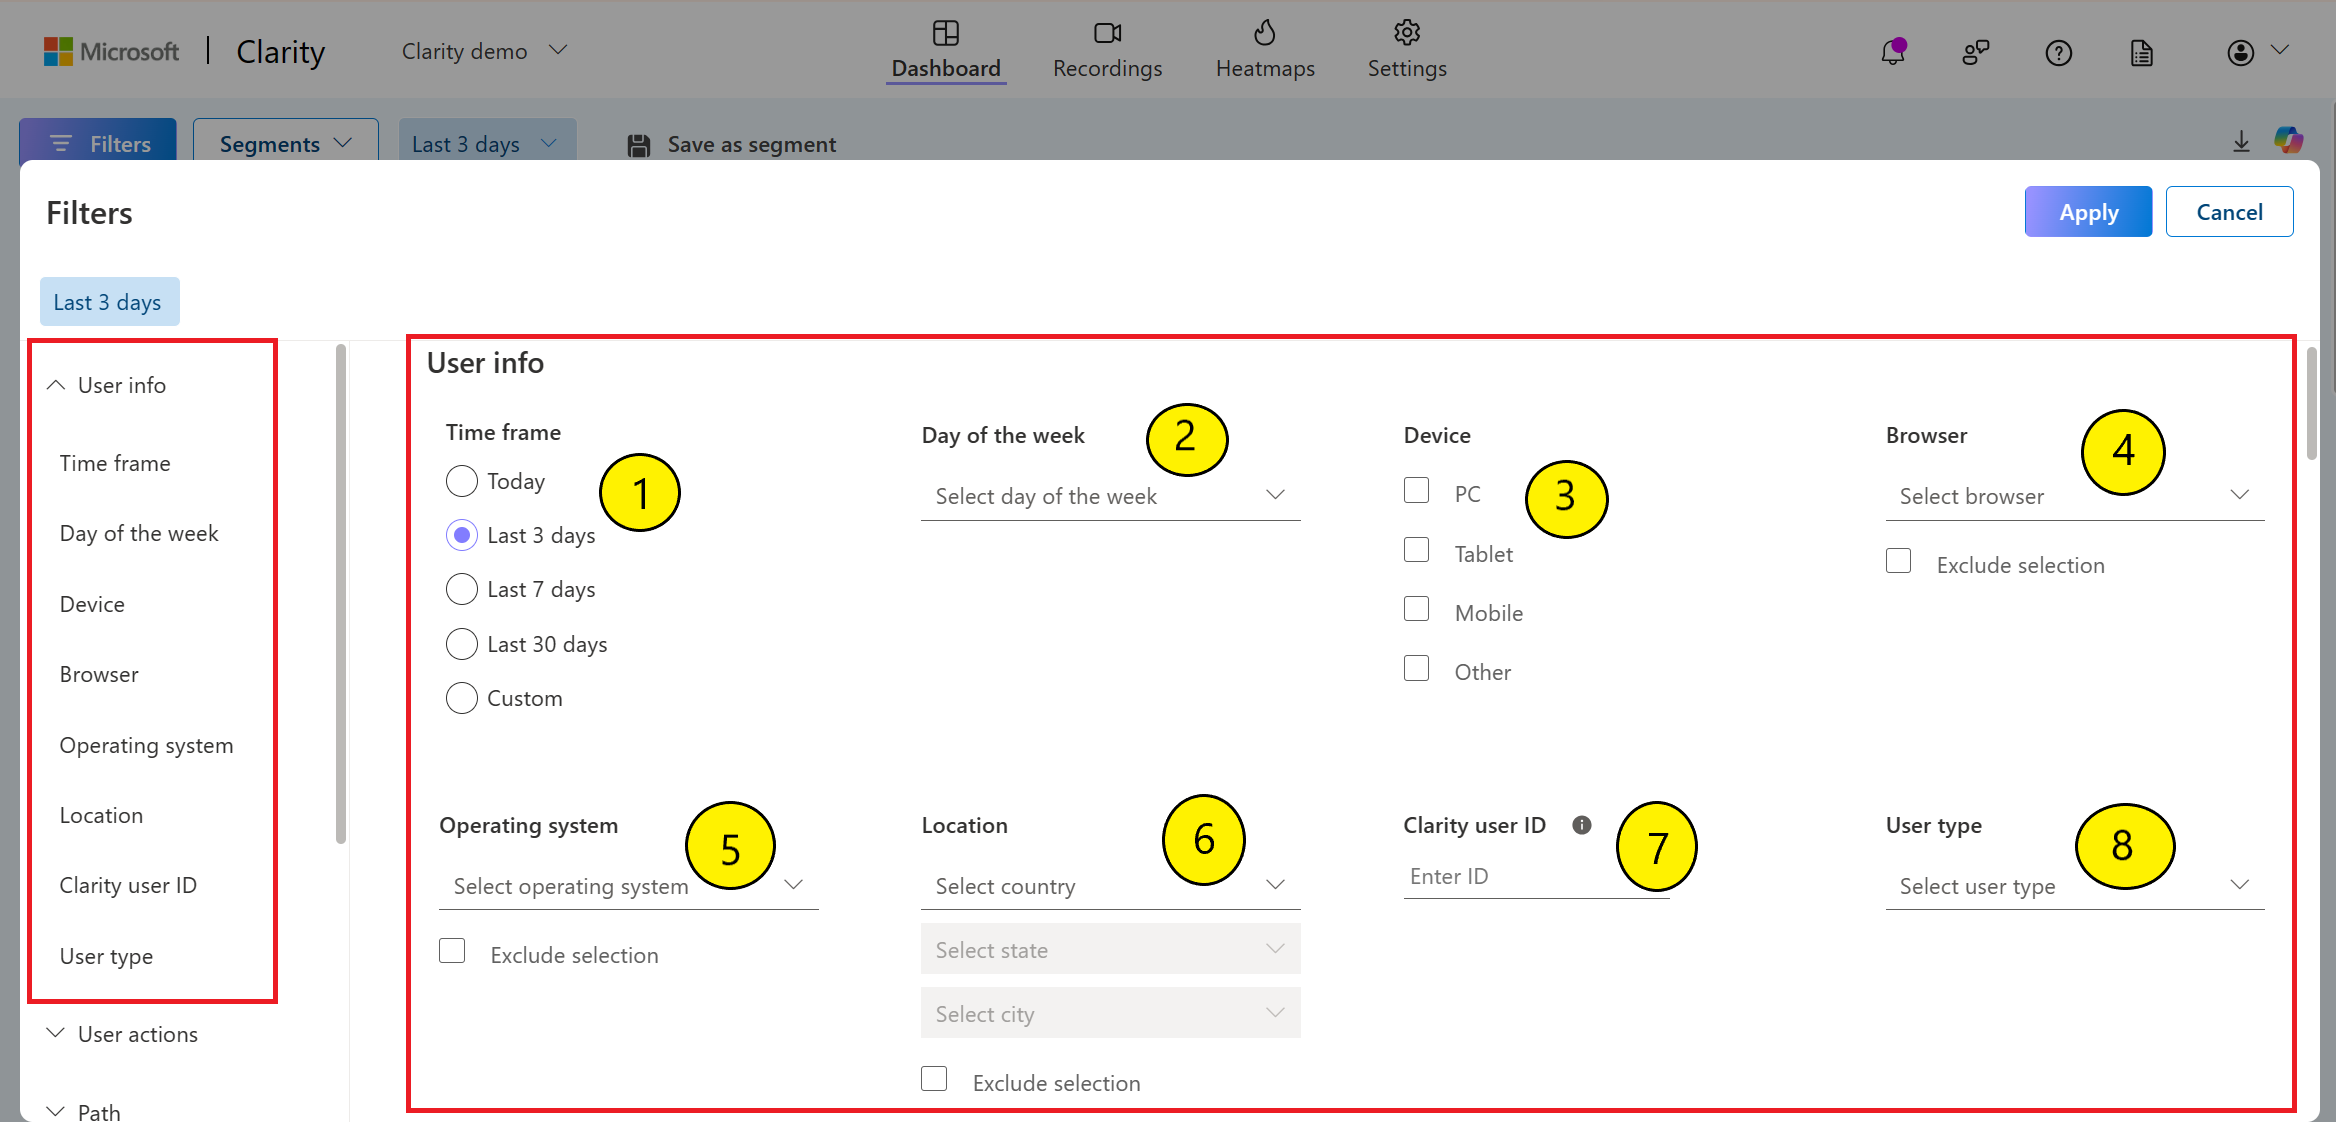
Time frame: Select a date range for your results. You can choose options between today and the last 30 days or enter a custom range. For a custom time frame, you can customize both the date and time.
Day of the week: Select a day or days of the week from the drop-down.
Device: Select one or more devices from the list of PC, Tablet, Mobile, and Other.
Browser: Select one or more browsers from a list that include Chrome, Microsoft Edge, and Safari. You can exclude this filter by selecting Exclude selection checkbox.
Operating system: Select one or more OS from a list, including Windows and macOS. You can exclude this filter by selecting Exclude selection checkbox.
Location: Select one or more countries/regions from the list. As you select a Country/Region, choose a State and City from the drop-down. You can exclude this filter by selecting Exclude selection checkbox.
Clarity user ID: Enter a specific Clarity user ID (text type) to include only results from that Clarity user. You can get the user ID from the Session details view. You can also view visitor profiles of the specific clarity user. Learn more about Visitor profile
Example: You can use the Browser filter to compare user data related to visitors on Chrome and Microsoft Edge. Apply the filter with Chrome selected first, inspect your results, and then run another query with Microsoft Edge.
User type: Select Sessions with new users or Sessions with returning users from the dropdown.
Filtering by User actions
The User actions filter group allows you to screen results by user activity on your website:
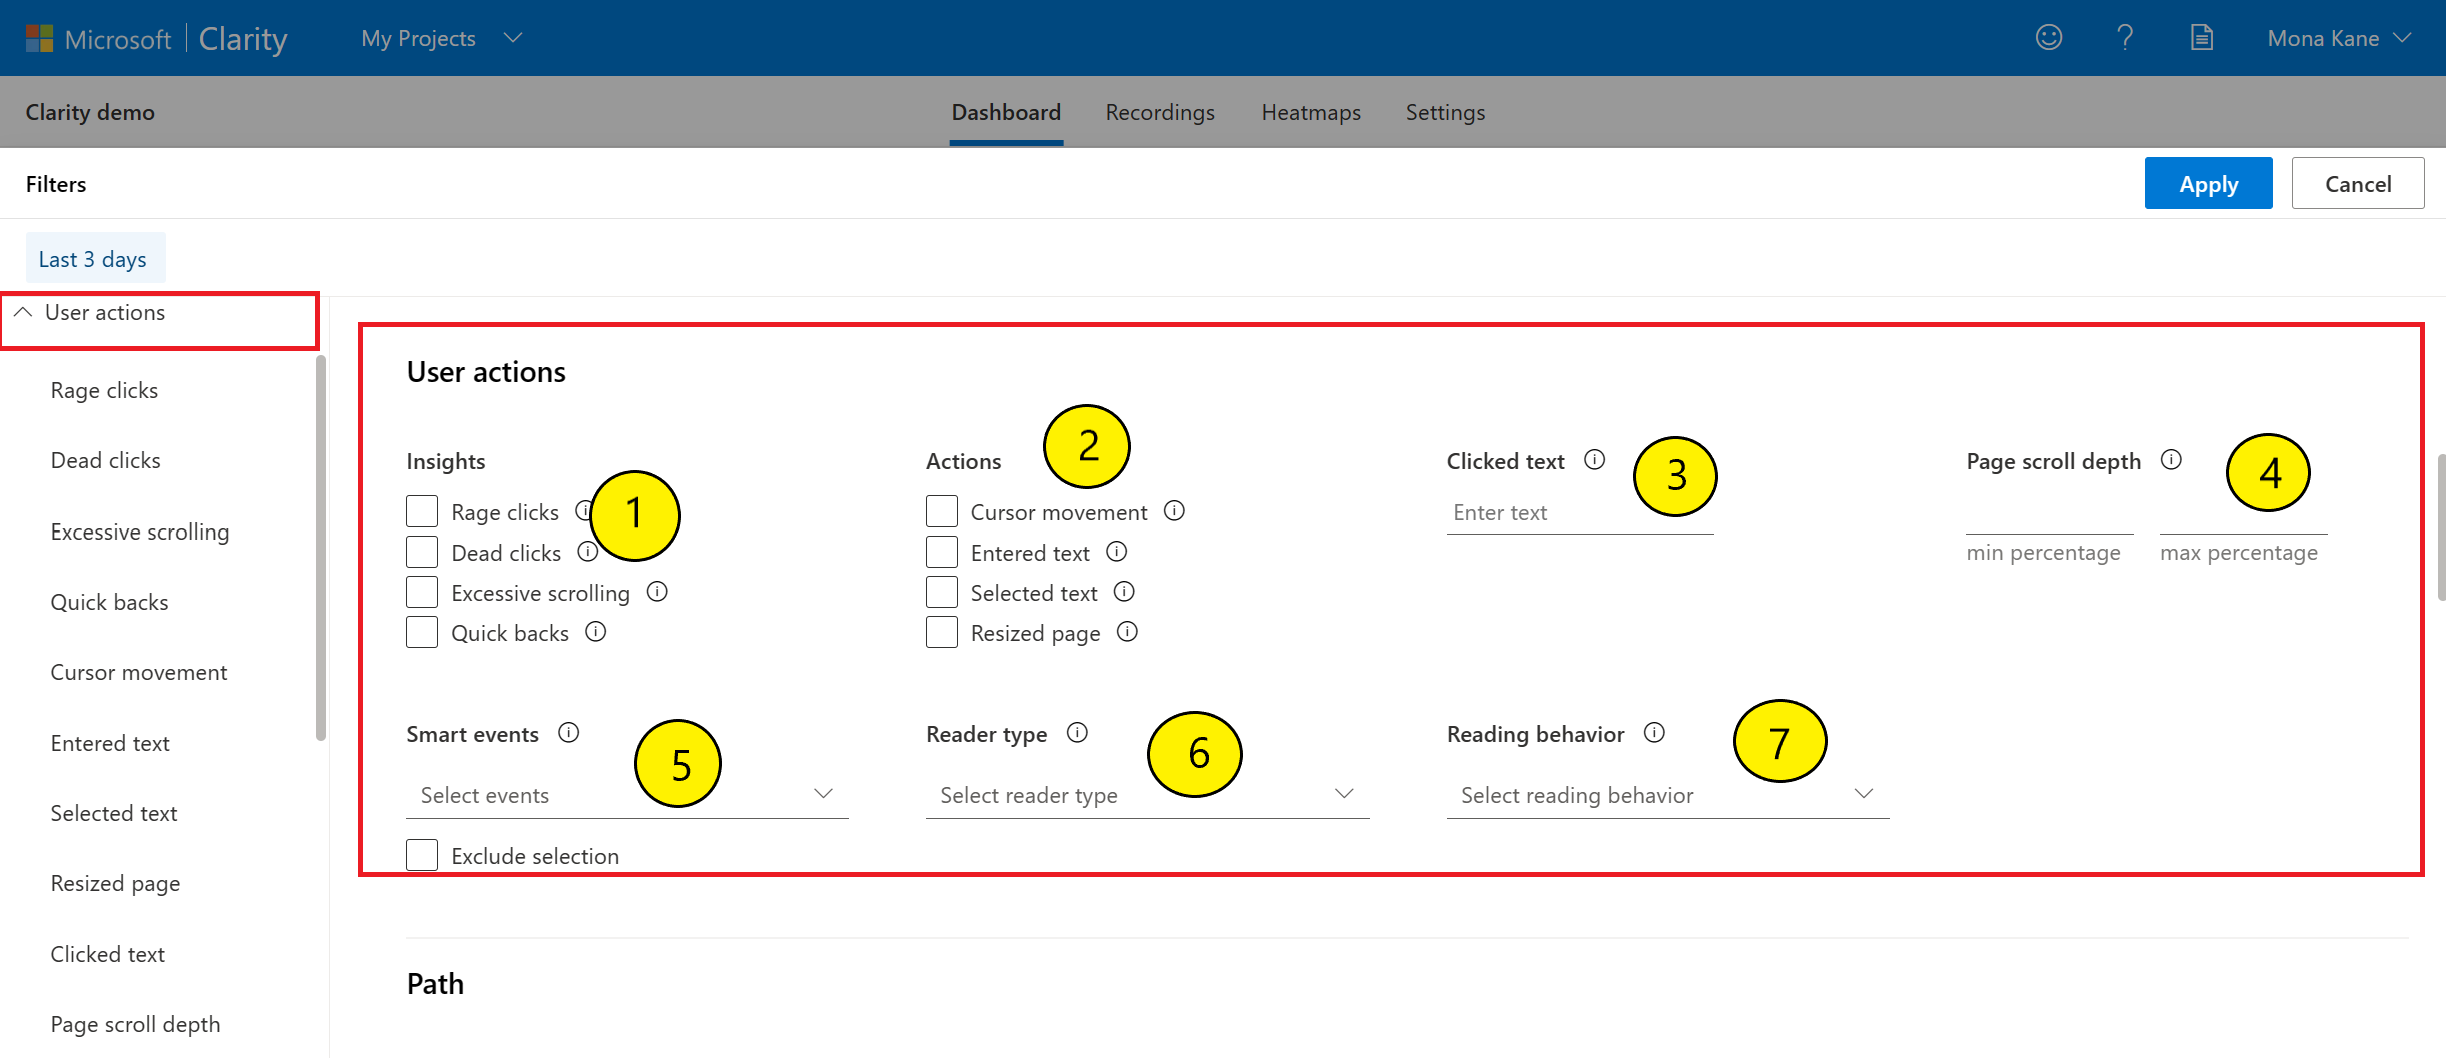
Insights filter group helps you to screen results by insights generated from Clarity Insights:
Rage clicks: Select data where a user repeatedly clicked in a clustered area within a brief period. This filter helps identify frustration points in your design.
Dead clicks: Select data where a user clicked somewhere, but there was no response. This filter helps find UX bugs.
Excessive scrolling: Select data when a user scrolled through site content at a higher rate than expected for standard content consumption. This filter helps identify users who are lost on your page.
Quick backs: Select data where a user went to a new page then quickly returned to the previous one. This filter helps you find confusing navigation or content.
Actions filter based on user interaction with your page or app.
Cursor movement: Select data where a user moved their mouse. For mobile devices and tablets, this metric captures user swipes on the screen. This filter helps you identify when a user is active on your page, without any clicks on it.
Entered text: Select data where a user-typed content or pasted text in a text box, input box, or form element.
Selected text: Select data where a user-selected text on the page. This data helps you in identifying the content the user is reading or copying.
Resized page: Select data where a user changes the size of their browser window or switches between landscape/portrait on a mobile phone.
Clicked 'Jump to recipe': Available only for food blogs, select data when a user clicked 'Jump to recipe' button on a page.
Visited recipe page: Available only for food blogs, select data to display when a visitor views a recipe page during a session.
Intentions: Select data that categorizes quality of sessions based on the user interactions. Learn more about User intent metrics.
Clicked text: Select data where a user clicked on a specific element with this text in it.
Page scroll depth: Select data where a user scrolled an exact depth down a page. Enter the depth scrolled in a percentage.
Example: Set Page scroll depth less than your site's average fold to better understand users who left the page without getting to the average fold. You can also add more filters or check out individual session recordings. You can find your site's average fold by using Clarity's scroll maps.
Smart events: Select data that capture key user actions. Clarity automatically defines smart events, and you can customize them or define new events. Learn more about Smart events.
Funnels: Select data that capture ordered group of user actions. You can customize or define funnels. Learn more about Funnels.
Reader type: Available only for content blogs, select data that categorizes sessions based on the number of articles viewed. The types are:
- One and done: Select data where users viewed only one article.
- Casual: Select data where users viewed 2 to 3 articles.
- Serious: Select data where users viewed four or more articles.
Reading behavior: Available only for content blogs, select data that categorizes pageviews based on how users read the article.
- Engaged: Select data where users finished reading the article.
- Abandoned at headline: Select data where the user only read the article headline.
Viewed recipe card: Available only for food blogs, select data to display when a visitor sees the recipe card.
Filtering by Path
The Path filter group helps you to screen results by user interaction with specific URLs on your site:
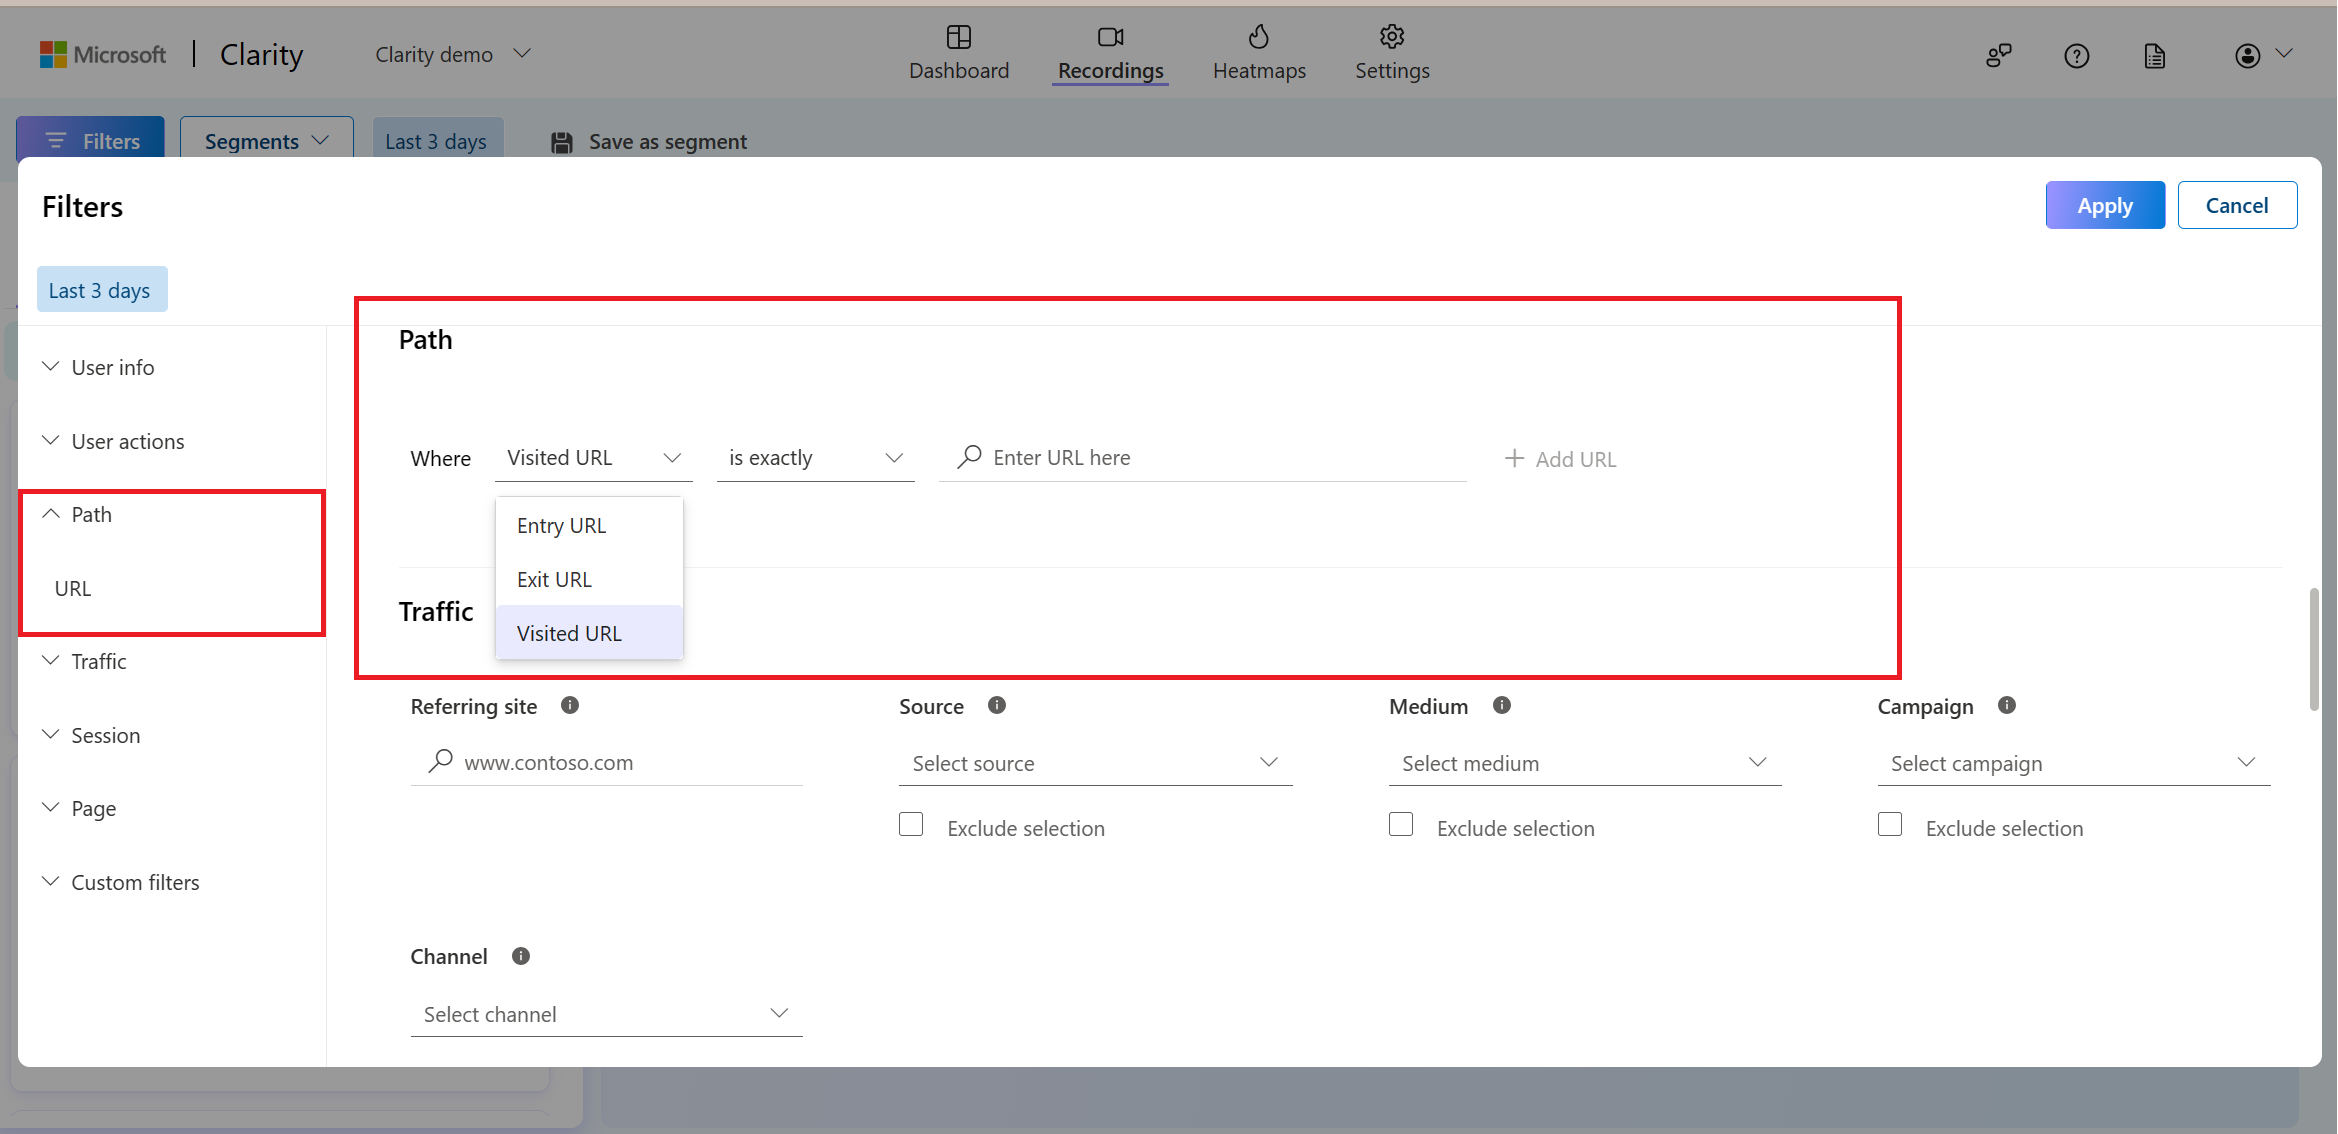
Entry URL: Select data where a user entered the site on a specific page. This filter helps you to watch and analyze user behavior on particular pages.
Exit URL: Select data where a user left the site on a specific page. This filter helps you to evaluate why users left a particular page.
Visited URL: Select data that includes a specific page. This filter helps you analyze how users navigate away from a particular page during a more extensive journey on your website.
Learn more about the supported operators.
Note
Clarity supports RegEx in path filters. You can select specific groups of pages using regular expressions.
Filtering by Traffic
The Traffic filter group helps you to screen results by criteria related to your site's traffic flow:
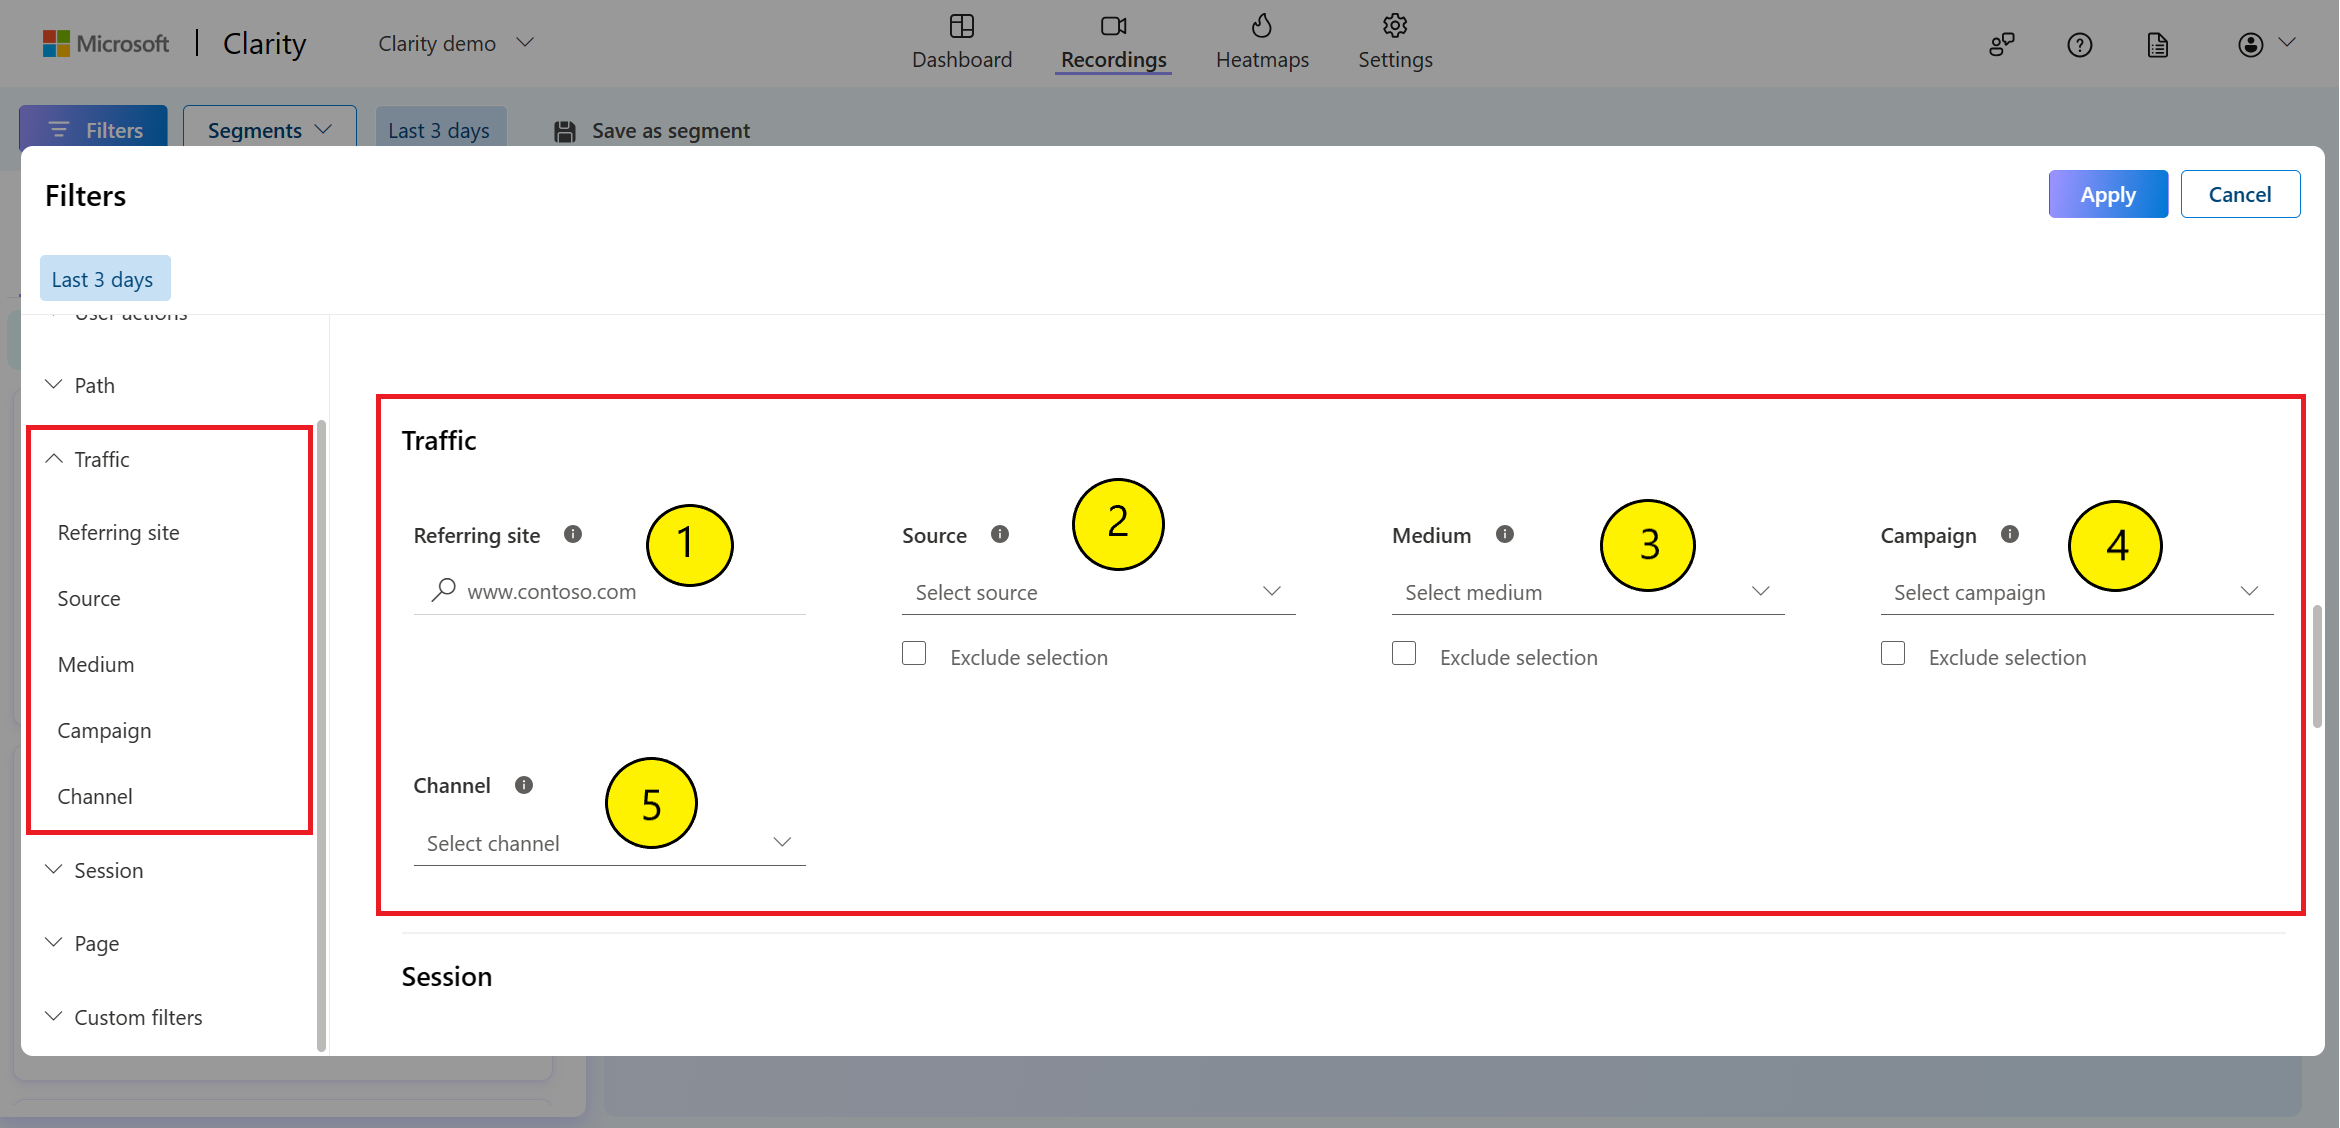
Referring site: Select data where the URL of a specified page matches the one the user visited before your site, if available to Clarity. The referring site isn't available in cases where no data is passed in the HTTP headers.
Source: Select data from a specific "utm_source," which is the domain name of the link that sent a visitor to your site. You can exclude this filter by selecting Exclude selection checkbox.
Medium: Select data from a specific "utm_medium," which is the advertising or marketing medium for your traffic source. You can exclude this filter by selecting Exclude selection checkbox.
Campaign: Select data from a specific campaign if you used a UTM code to track your online marketing campaign. You can exclude this filter by selecting Exclude selection checkbox.
Channel: Select data that groups the traffic either "utm_source" or "utm_medium." Available channels are Organic Search, Direct, Social, Referral, and Other. This filter allows you to check the performance of your traffic channels.
Filtering by Performance
The Performance filter group helps you to screen results related to critical metrics that affect loading performance, interactivity, and visual stability. Learn more about Performance metrics.
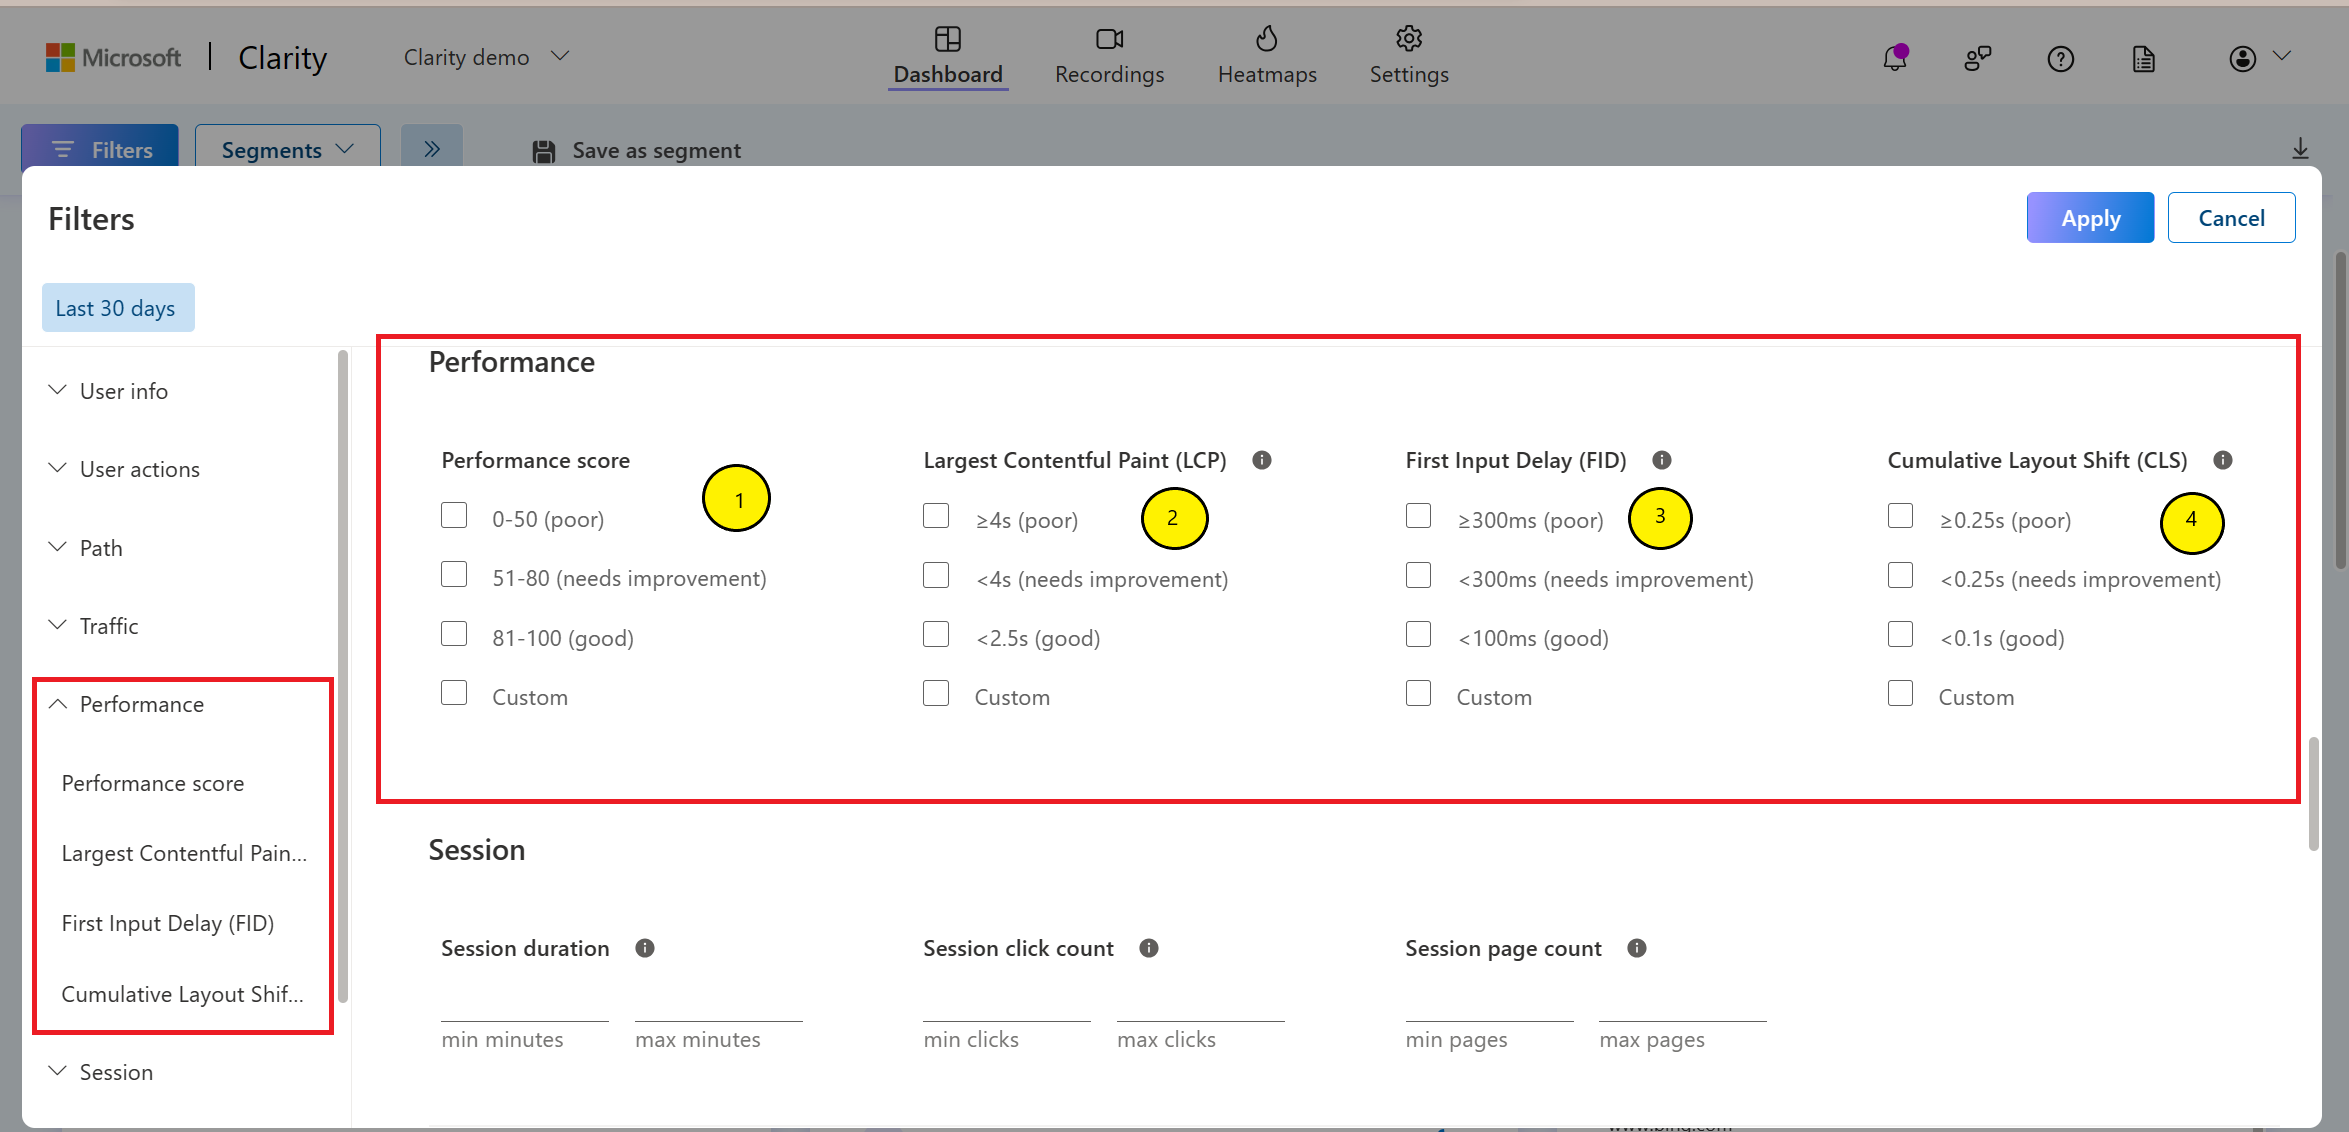
Performance score:
- A score between (0-50) indicate poor performance.
- A score between (51-80) indicate a need for improvement.
- A score between (81-100) indicate a good performance.
Largest Contentful Paint (LCP): Select data where the loading performance of the primary content of a page is measured.
- An ideal LCP occurs within 2.5 seconds of the initiation of page loading.
- LCP less than 4 seconds indicate a need for improvement.
- Poor LCP occurs beyond 4 seconds.
First Input Delay (FID): Select data to measure the duration from the initial user interaction with your site to the point at which the browser can respond.
- The target for FID is 100 milliseconds or less.
- FID within 300 milliseconds indicates a need for improvement.
- Poor FID occurs beyond 300 milliseconds.
Cumulative Layout Shift (CLS): Select data to assess the stability of your page layout.
- CLS with 0.1 seconds or less is considered good.
- CLS within 0.25 seconds indicates a need for improvement.
- Poor CLS occurs beyond 0.25 seconds.
Filtering by Product
The Product filter group helps you to screen results by criteria related to your e-commerce site. Learn more about E-commerce Insights.
Note
- Filters 1-6 are available for site instrumenting with Product JSON-LD.
- Filter 7 is available for Clarity projects of Shopify sites.
- Filter 8 is available for only Shopify plus sites.
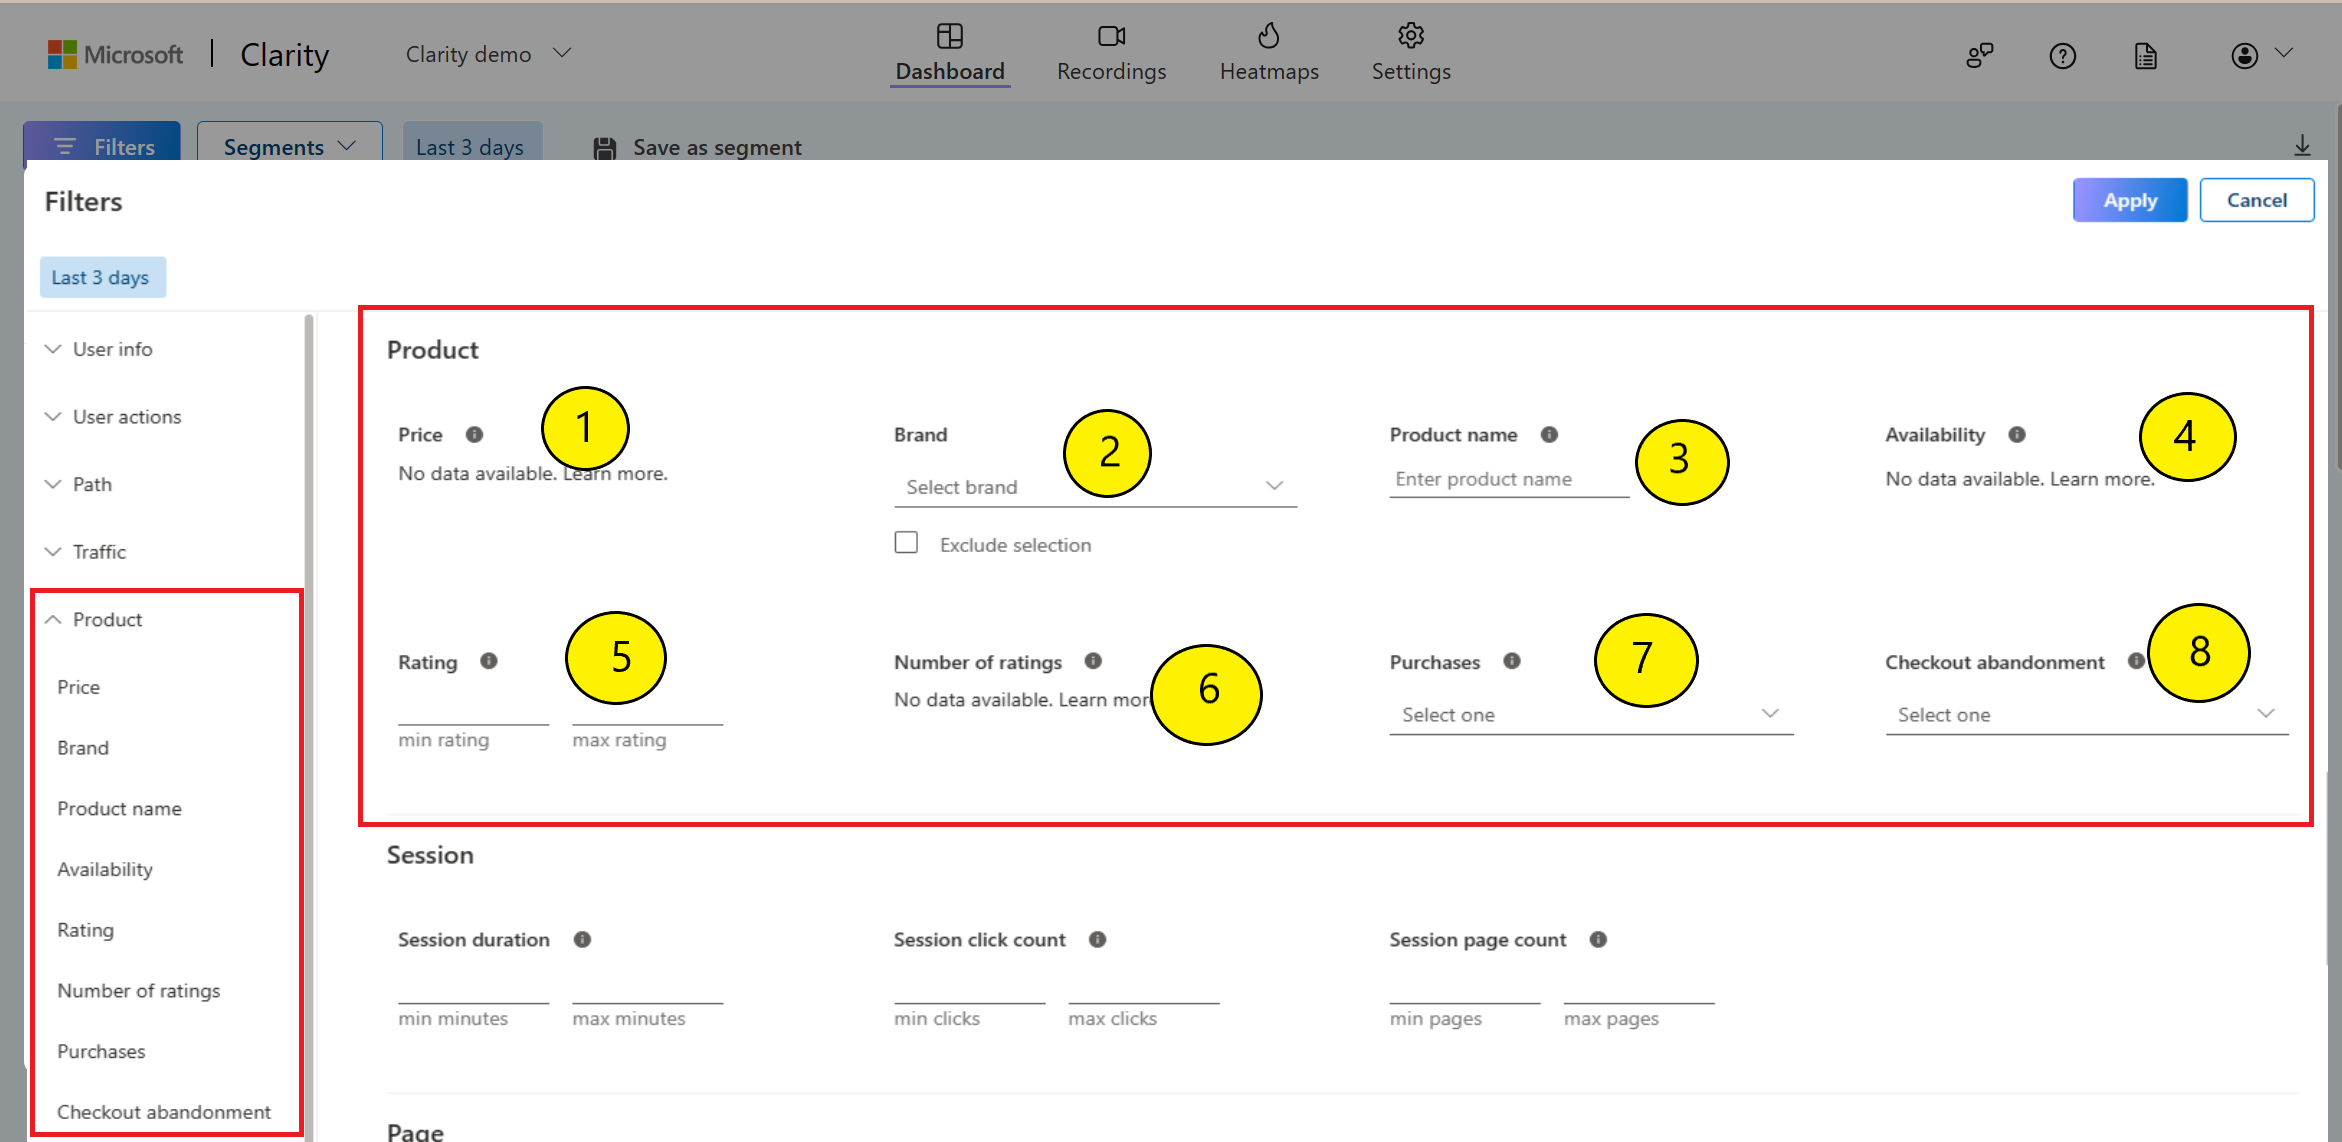
Price: Select data for the price value of the product viewed based on the currency used on your site. Choose to view data based on the minimum and maximum values you input.
Brand: Select data that includes the product brand. This filter helps you to view more from the specific brand. You can exclude this filter by selecting Exclude selection checkbox.
Product name: Select data based on a product name.
Availability: Select data that includes whether a viewed product was in stock or not. The dropdown list includes In stock, None, Out of stock.
Rating: Select data with average user rating. Enter the star min and max rating from 1 to 5.
Number of ratings: Select data with the total number of users rated. Enter a numeric input in min and max count.
Purchases: Select the sessions where site visitors did or didn't purchase a product. Choose to view sessions based on "Yes" or "No."
Checkout abandonment: Select the sessions where the user abandoned the checkout process at a specific step. Choose to view sessions based on the step in the checkout process that was abandoned. See Checkout abandonment for step information.
Filtering by Session
The Session filter group helps you to screen results by criteria you choose:
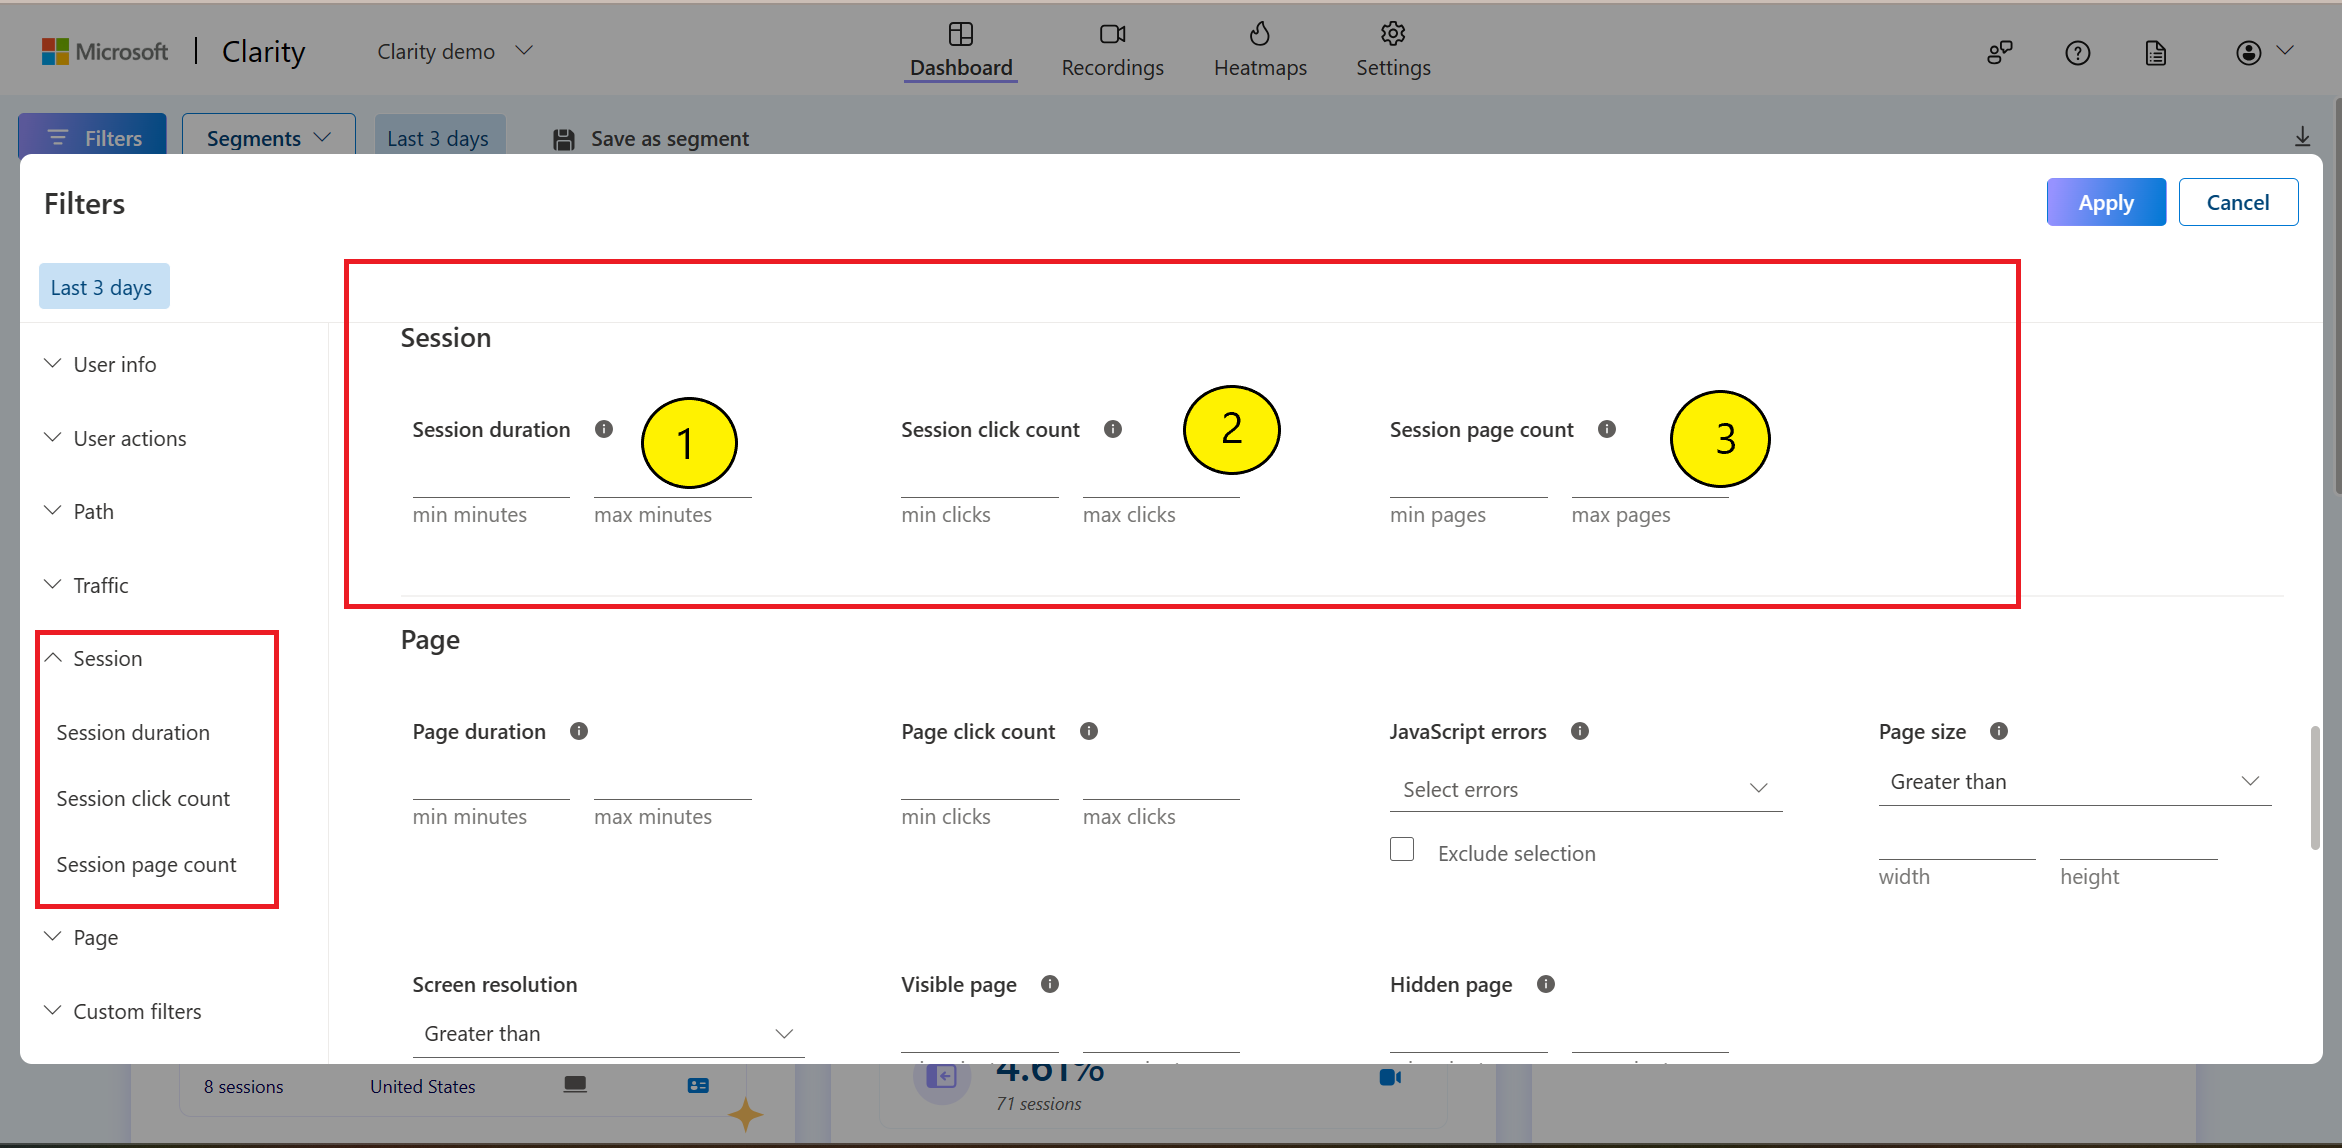
Session duration: Select the duration of user sessions in minutes. For "one minute 30 seconds," enter "1.5". Choose to view sessions based on the minimum and maximum values you input.
Session click count: Select the sessions where users clicked a specific number of times. Choose to view sessions based on the minimum and maximum values you input.
Session page count: Select the sessions where users visited a specific number of pages. Choose to view sessions based on the minimum and maximum values you input.
Example: Find out why users didn't interact with your site using Session click count. Enter few clicks to see user sessions with lower interactivity. And for a balancing perspective, enter a higher number of clicks to view sessions with many interactions. Dig into the details to better understand what makes your site engaging and what doesn't.
Filtering by Page
The Page filters group helps you to screen results by criteria related to the pages viewed:
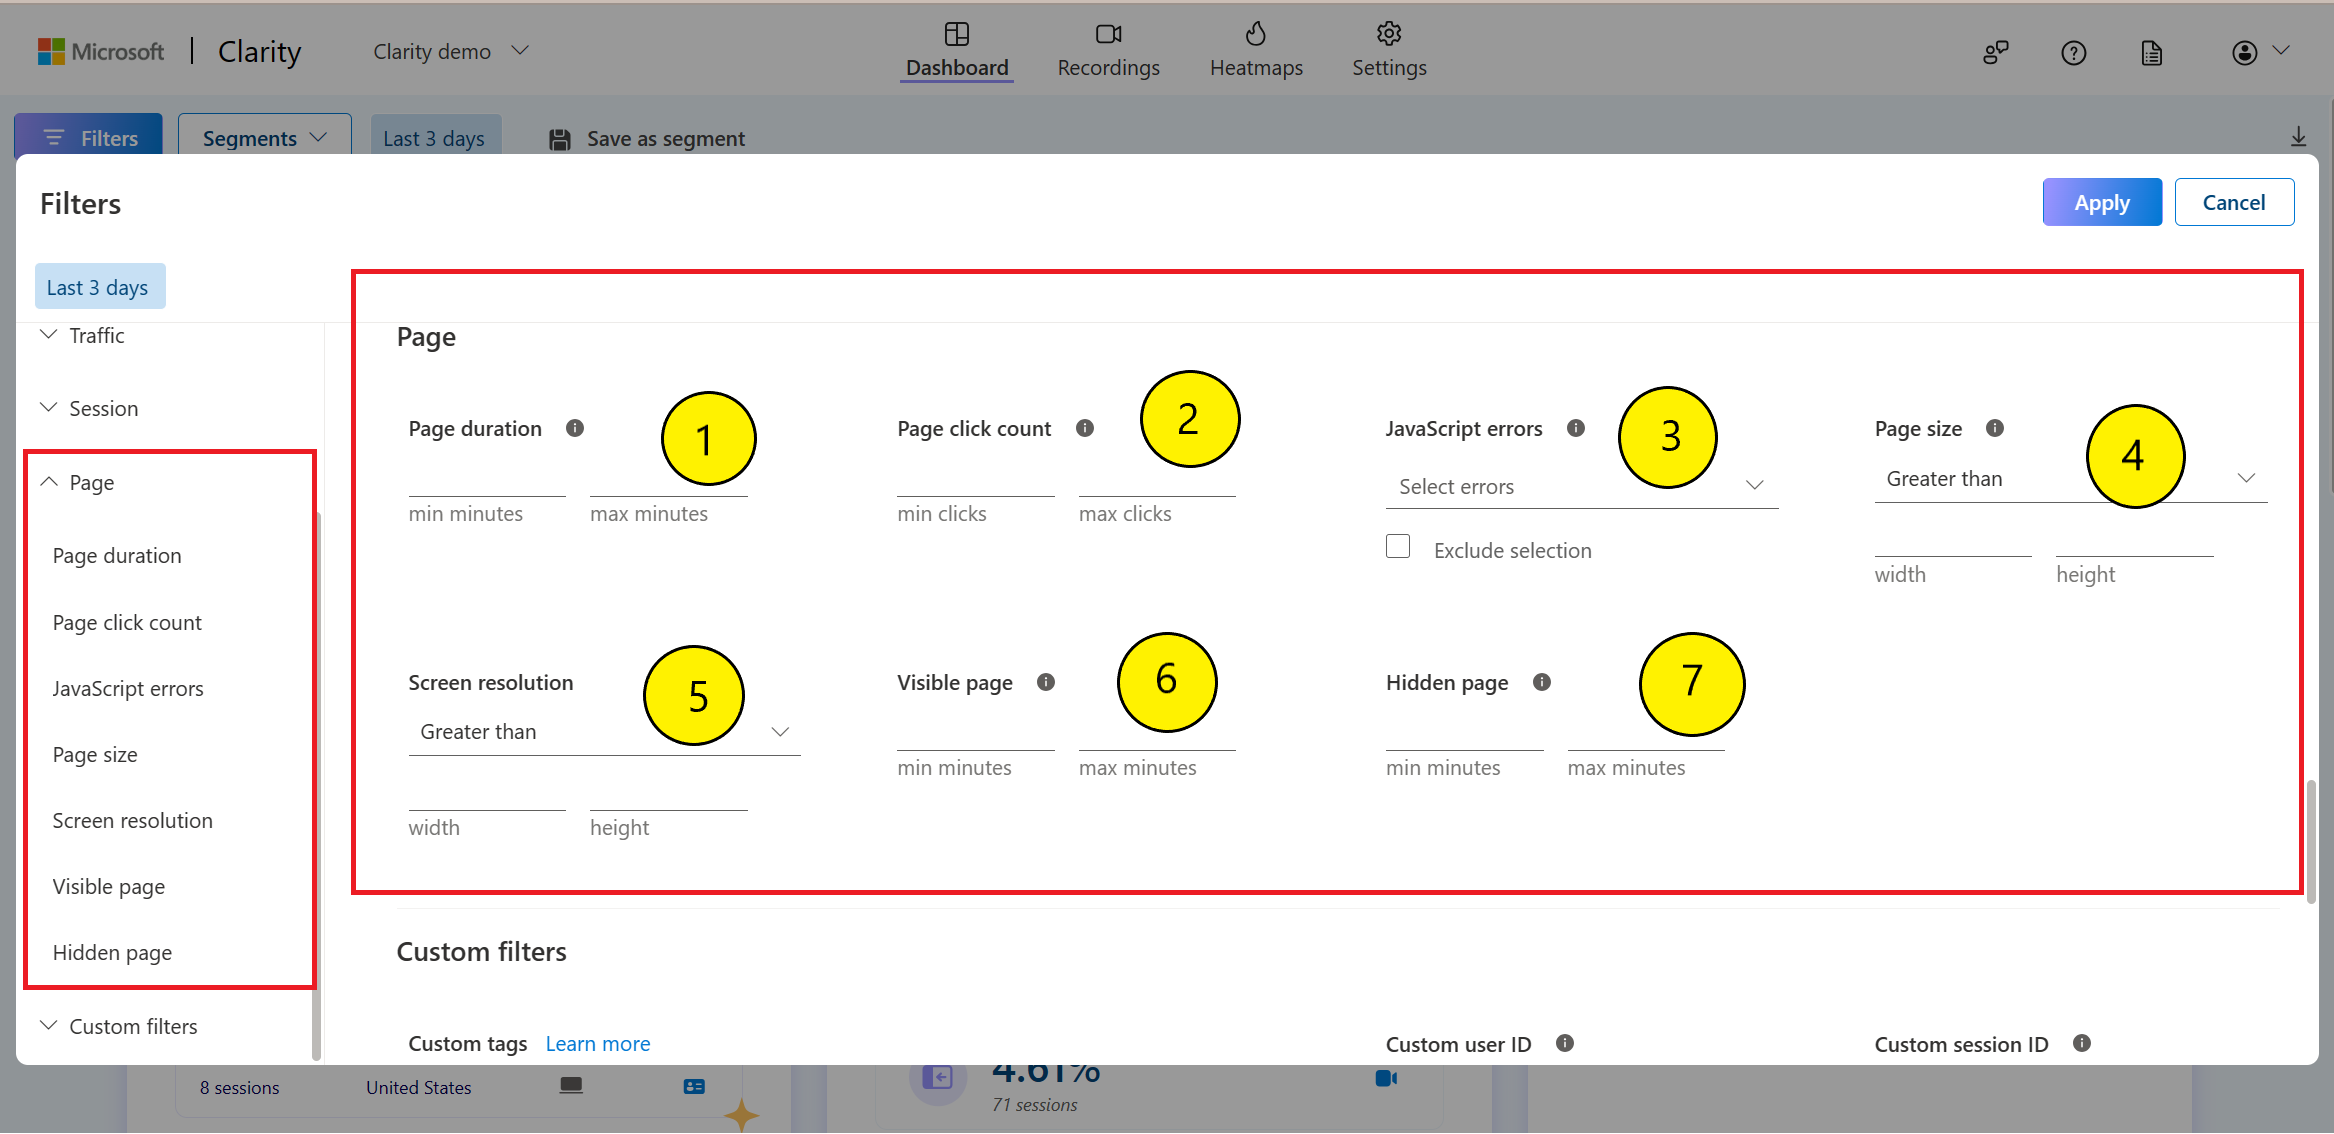
Page duration: Select the amount of time the user spent on a page. Enter the duration in minutes. For "one minute 30 seconds," enter "1.5". Choose to view sessions based on the minimum and maximum values you input.
Page click count: Select the number of clicks on a page. Enter the number of clicks per page. Choose to view sessions based on the minimum and maximum values you input.
JavaScript errors: Select data where a JavaScript error is detected while executing JavaScript on the browser. View multiple errors on a page using logical OR or logical AND functions. The top 500 JavaScript errors are shown in the drop-down. You can exclude this filter by selecting Exclude selection checkbox.
- Click error: Select data where a JavaScript error is detected after a user click. You can view multiple errors on a page using logical OR or logical AND functions. You can find Click errors drop-down below the JavaScript errors.
Page size: Input the width and height of your page in pixels. Choose to view data greater than, less than, or equal to the selected page size.
Screen resolution: Select the screen resolution of the page in pixels. Choose to view data greater than, less than, or equal to the selected screen resolution.
Visible page: Select the amount of time that the page was visible to a user. Choose to view sessions based on the minimum and maximum values you input.
Hidden page: Select the amount of time the page was open but hidden, such as set behind another tab. Choose to view sessions based on the minimum and maximum values you input.
Example: You might want to investigate if you're implementing responsive web design well. Are visitors more likely to come across problems when they visit your site with small screen widths? Do they interact more when looking at your screen with large displays? To learn more, you can filter data by page size or screen resolution.
Filtering with Custom filters
Clarity's custom tags are customizable filters that allow you to analyze recordings and heat maps in different directions. Learn more about:
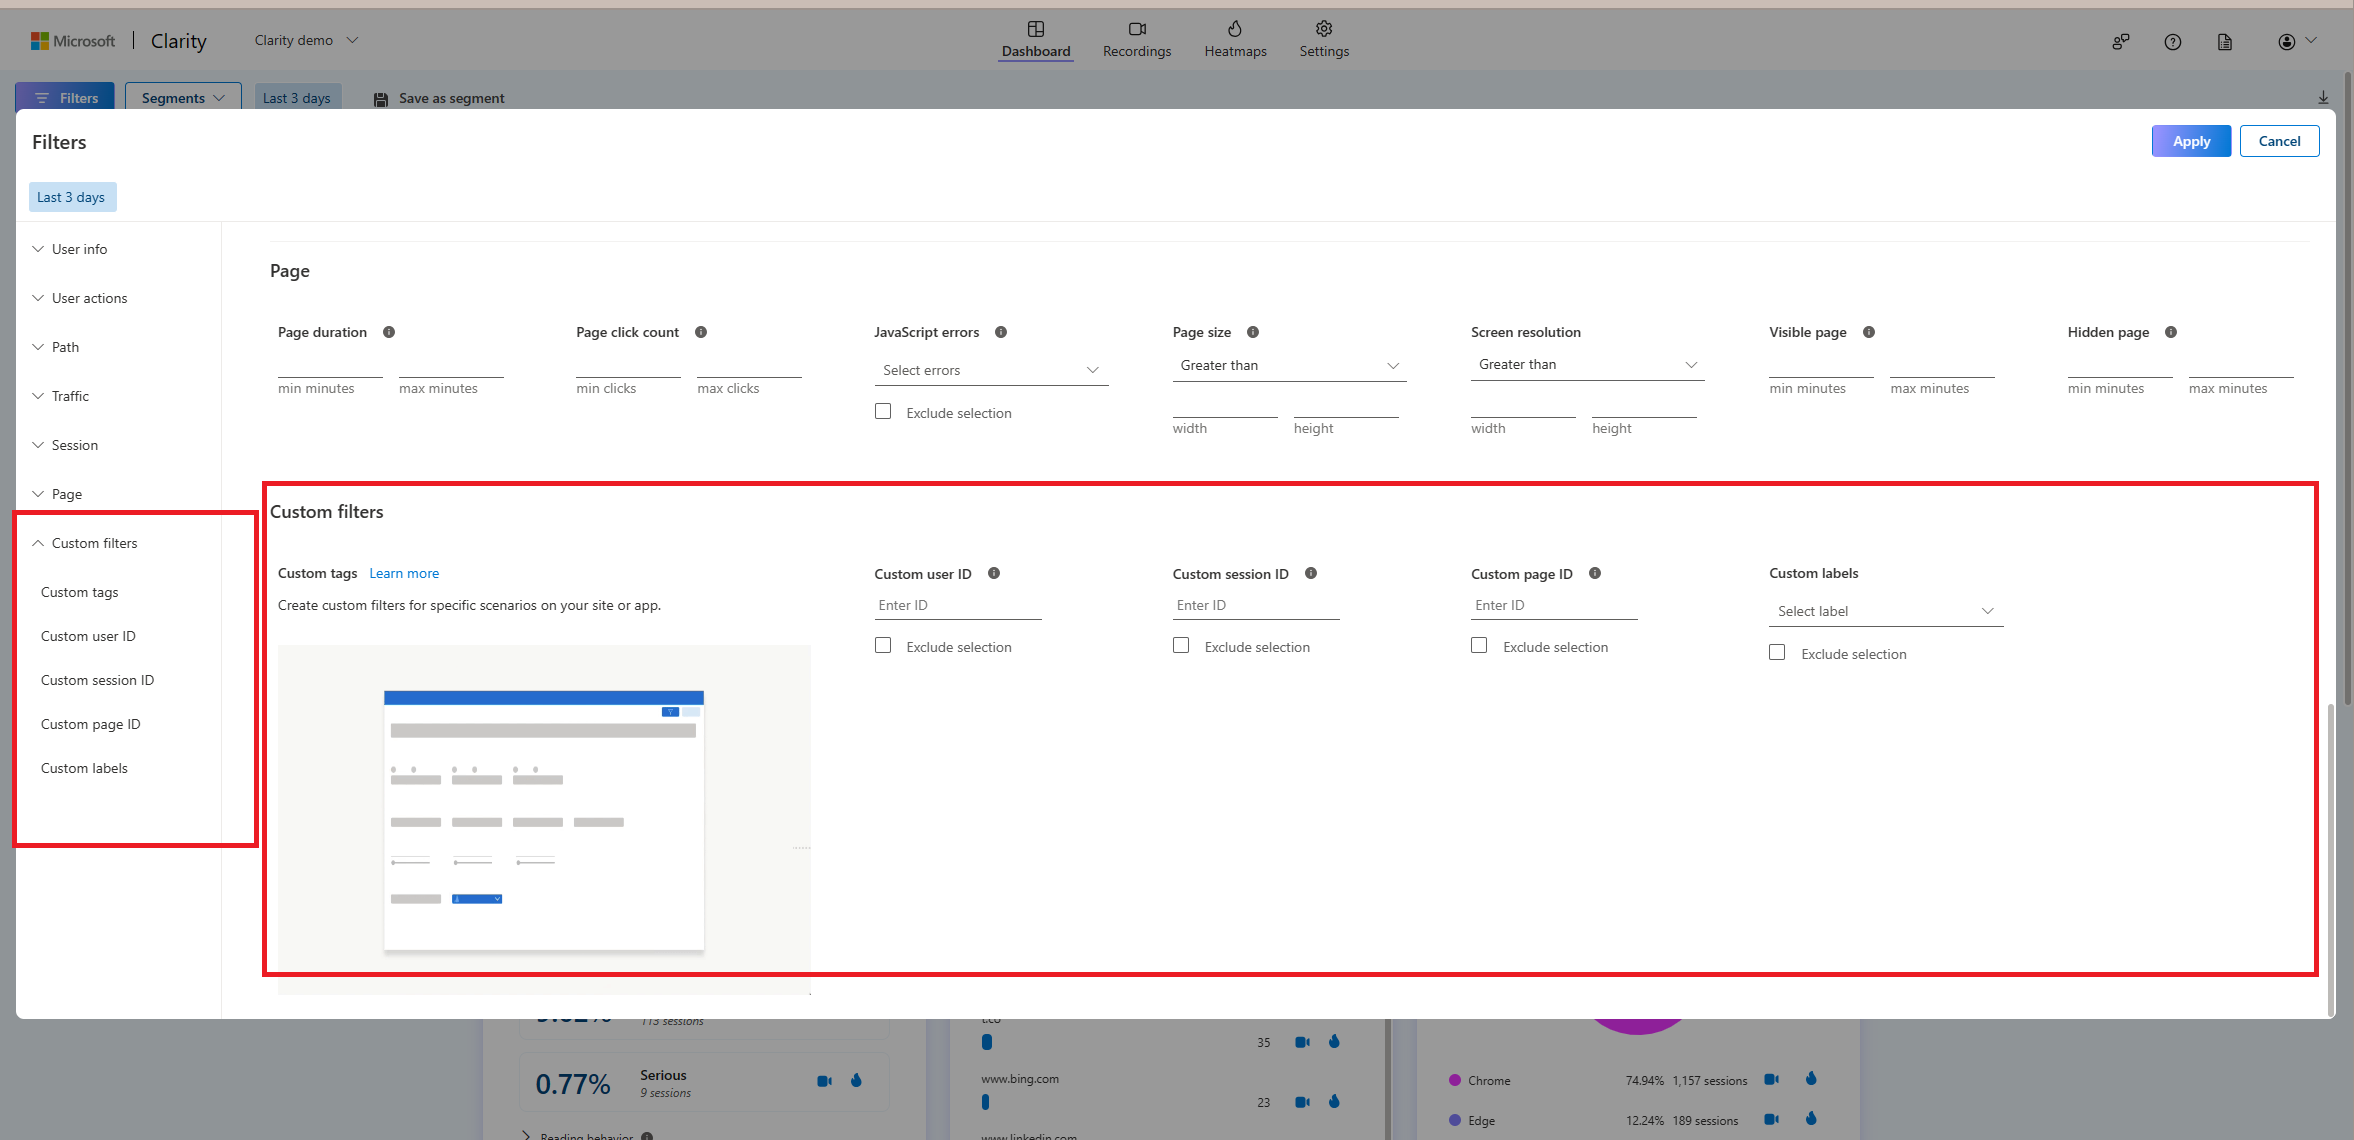
Custom IDs
Custom IDs allow you to filter using user ID, session ID, and page ID. These properties are set similar to custom tags. The custom identifiers are set up using Clarity client API.
The following are the IDs that you can custom set:
- Custom user ID: The website owner creates and retrieves the text type custom user ID using Clarity API custom identifiers. You can exclude this filter by selecting Exclude selection checkbox.
- Custom session ID: The website owner creates and retrieves the text type custom user ID using Clarity API custom identifiers. You can exclude this filter by selecting Exclude selection checkbox.
- Custom page ID: The website owner creates and retrieves the text type custom user ID using Clarity API custom identifiers. You can exclude this filter by selecting Exclude selection checkbox.
Badge labels
| Image | Description |
|---|---|
|
|

|
|
|
|
FAQ
For more answers, refer to Filters FAQ.