Note
Access to this page requires authorization. You can try signing in or changing directories.
Access to this page requires authorization. You can try changing directories.
Note
To start using Clarity for your project, you must finish the Setup process.
What is a Heatmap?
A Heatmap or Heat map is a visualization tool that makes it easy to analyze aggregated information about how users interact with the website.
Clarity tracks all visitor clicks and scrolls on mobile, desktop, and tablet and automatically generates a heat map. This data helps you identify the most engaged areas and figure out gaps.
There's no creation delay. Heat maps return within a matter of seconds. Clarity supports Click maps, Scroll maps, Area maps, Conversion maps, and Attention maps.
Note
There's no minimum traffic limitation to generate a heat map.
Heat maps can be generated for a single page or group of pages.
Why use Clarity heatmaps?
Heatmaps help you look at user behavior across sessions so you can easily identify what works and what doesn't on your page, such as:
- Find out if you have the right hierarchy of elements on your page by looking at scroll maps.
- See if your CTAs are getting any attention by looking at click maps.
- Discover the clicks that generate most revenue by looking at conversion maps.
How do Heatmaps work for my website?
Heat maps are created from the data already collected by Clarity. Clarity aggregates information on clicks/scroll reaches across different page views based on the filters you choose to generate the heatmap.
Heatmaps zero state
Note
You can view zero state Heatmaps only if there's no applied Visited URL filter.
After onboarding, navigate to Heatmaps to view a list of popular pages. Adjust your Filters and Segments to view according to your preferences. The pages are sorted based on the highest number of sessions, with their page titles, URLs, and visit counts displayed.
A page title is the text shown on a browser tab and in search results, offering a brief description of a webpage's content. To improve SEO, ensure page titles are clear, relevant, and aligned with the URL. If a page lacks a title, adding one can enhance search visibility and user experience. The & more label signifies that multiple page titles are linked to a single URL.

You can also enter a URL and or part of URL to start viewing the Heatmaps. Learn more on how to achieve this with path filters and its supporting operators.
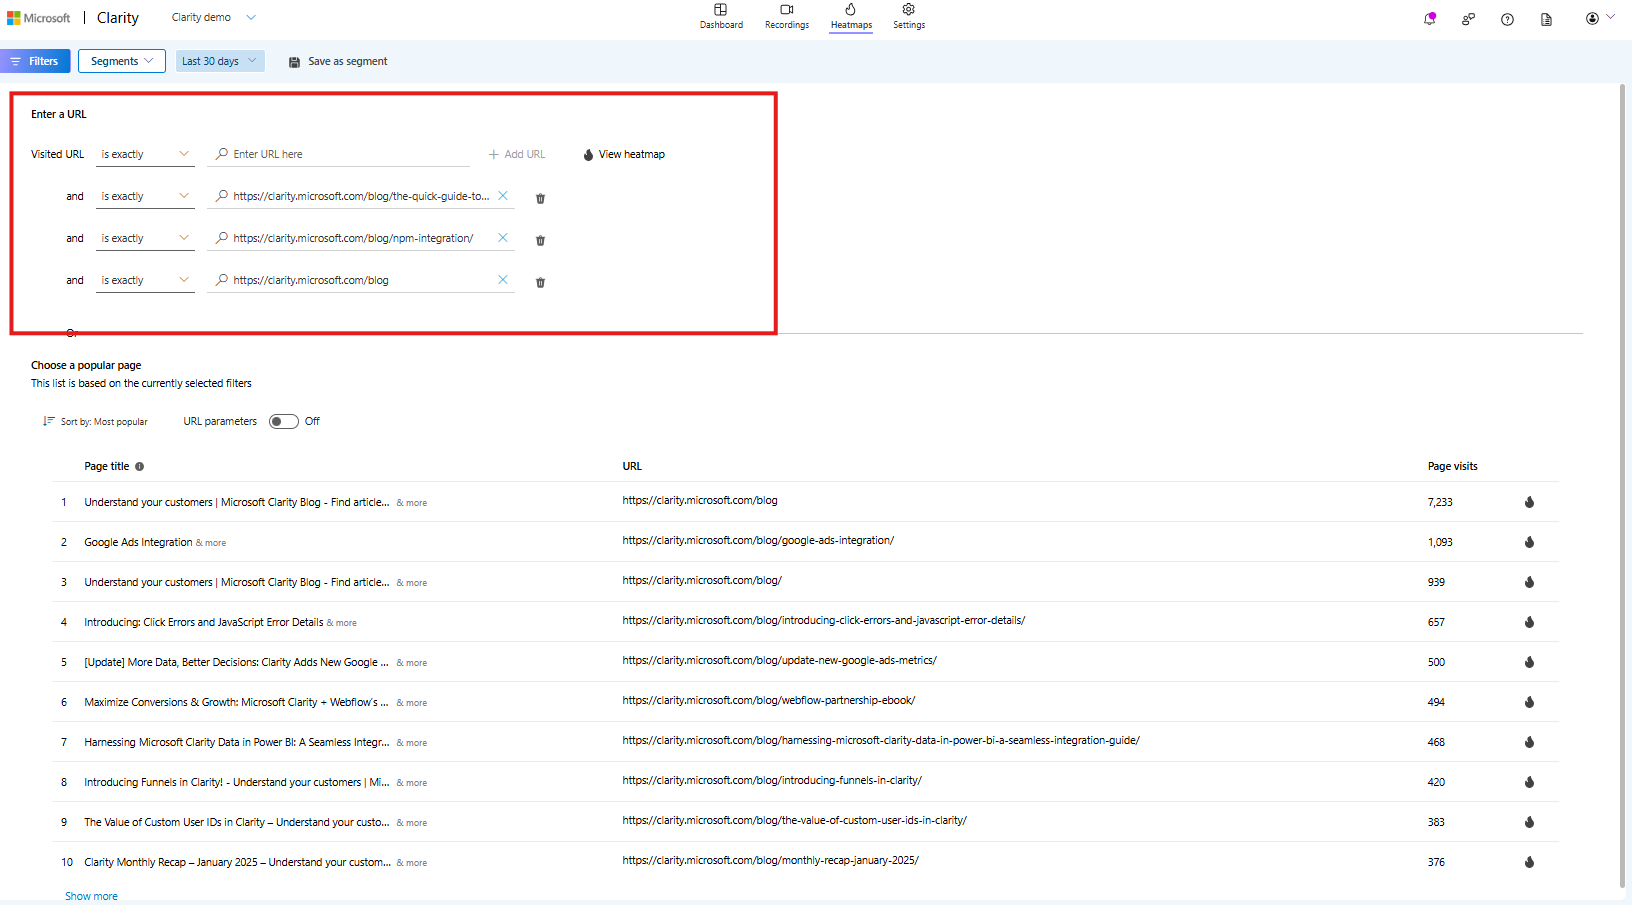
URL parameters
When you toggle the URL parameters and select a URL, you can view the heatmap that matches the URL and parameters exactly. When toggled off, you see a heatmap that start with the specified value, with or without parameters.
If you've already applied a Visited URL filter in the Recordings or Dashboard sections, the heatmap for that URL appears in the Heatmaps section, instead of the zero state.
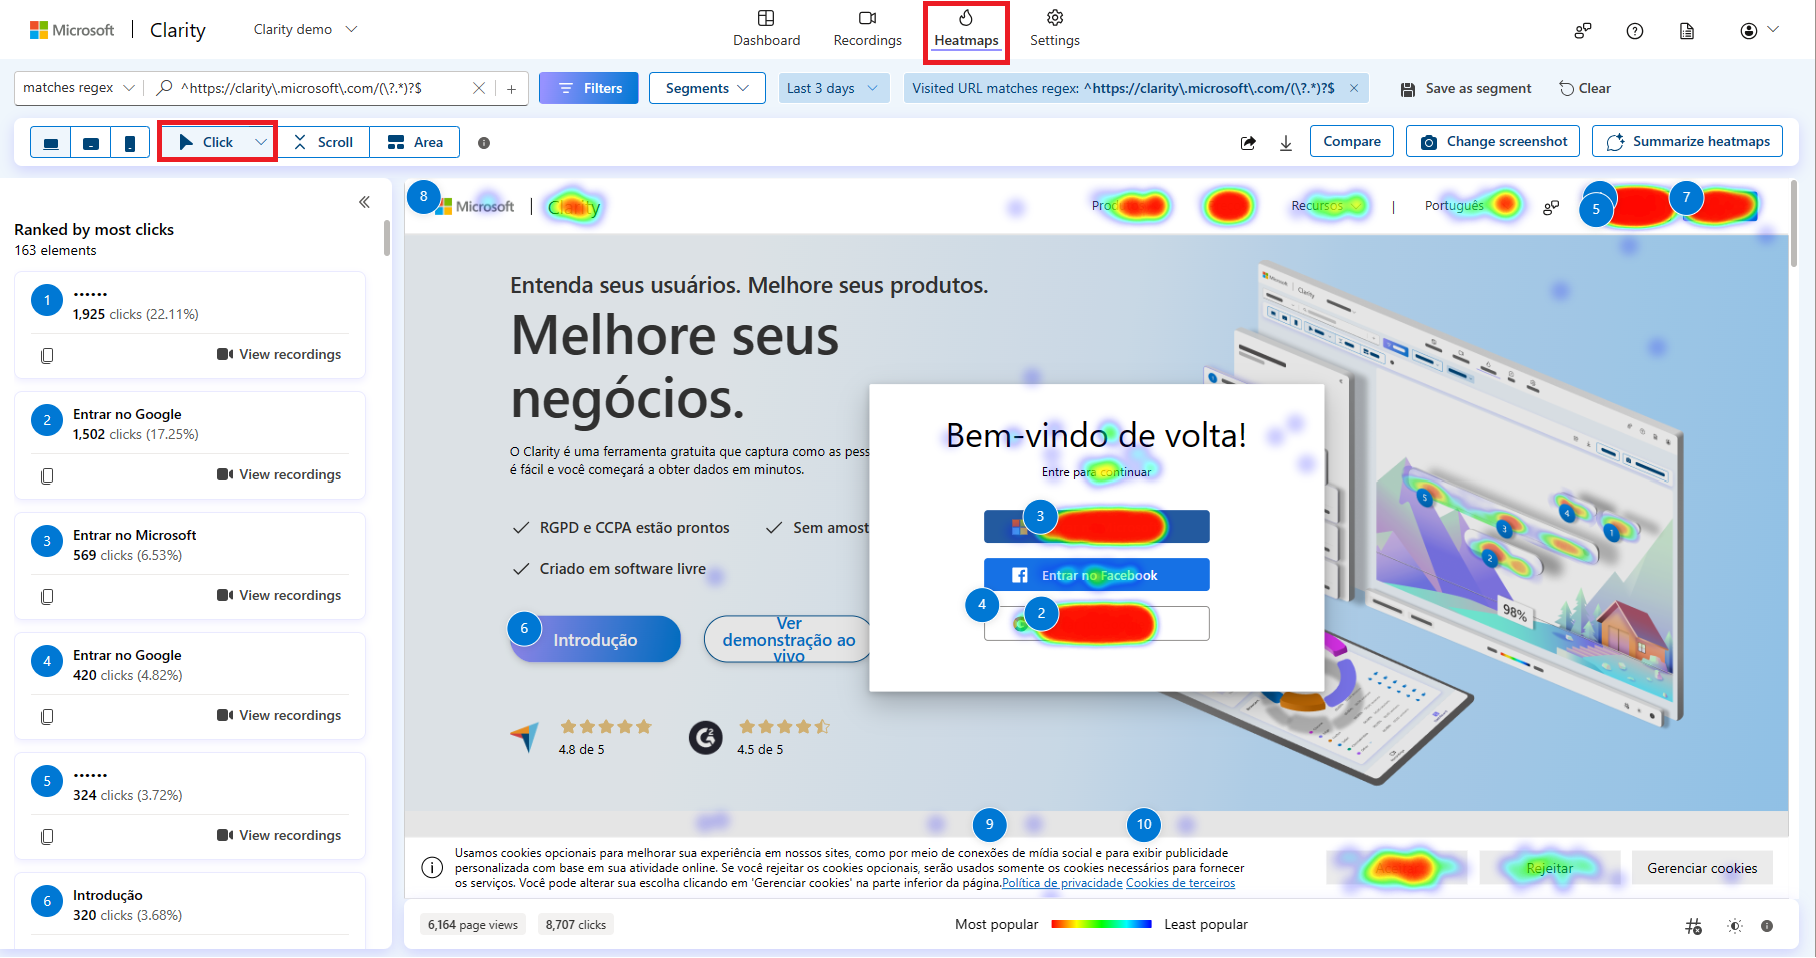
Types of Heatmaps
There are different types of heat maps based on the kind of interaction.
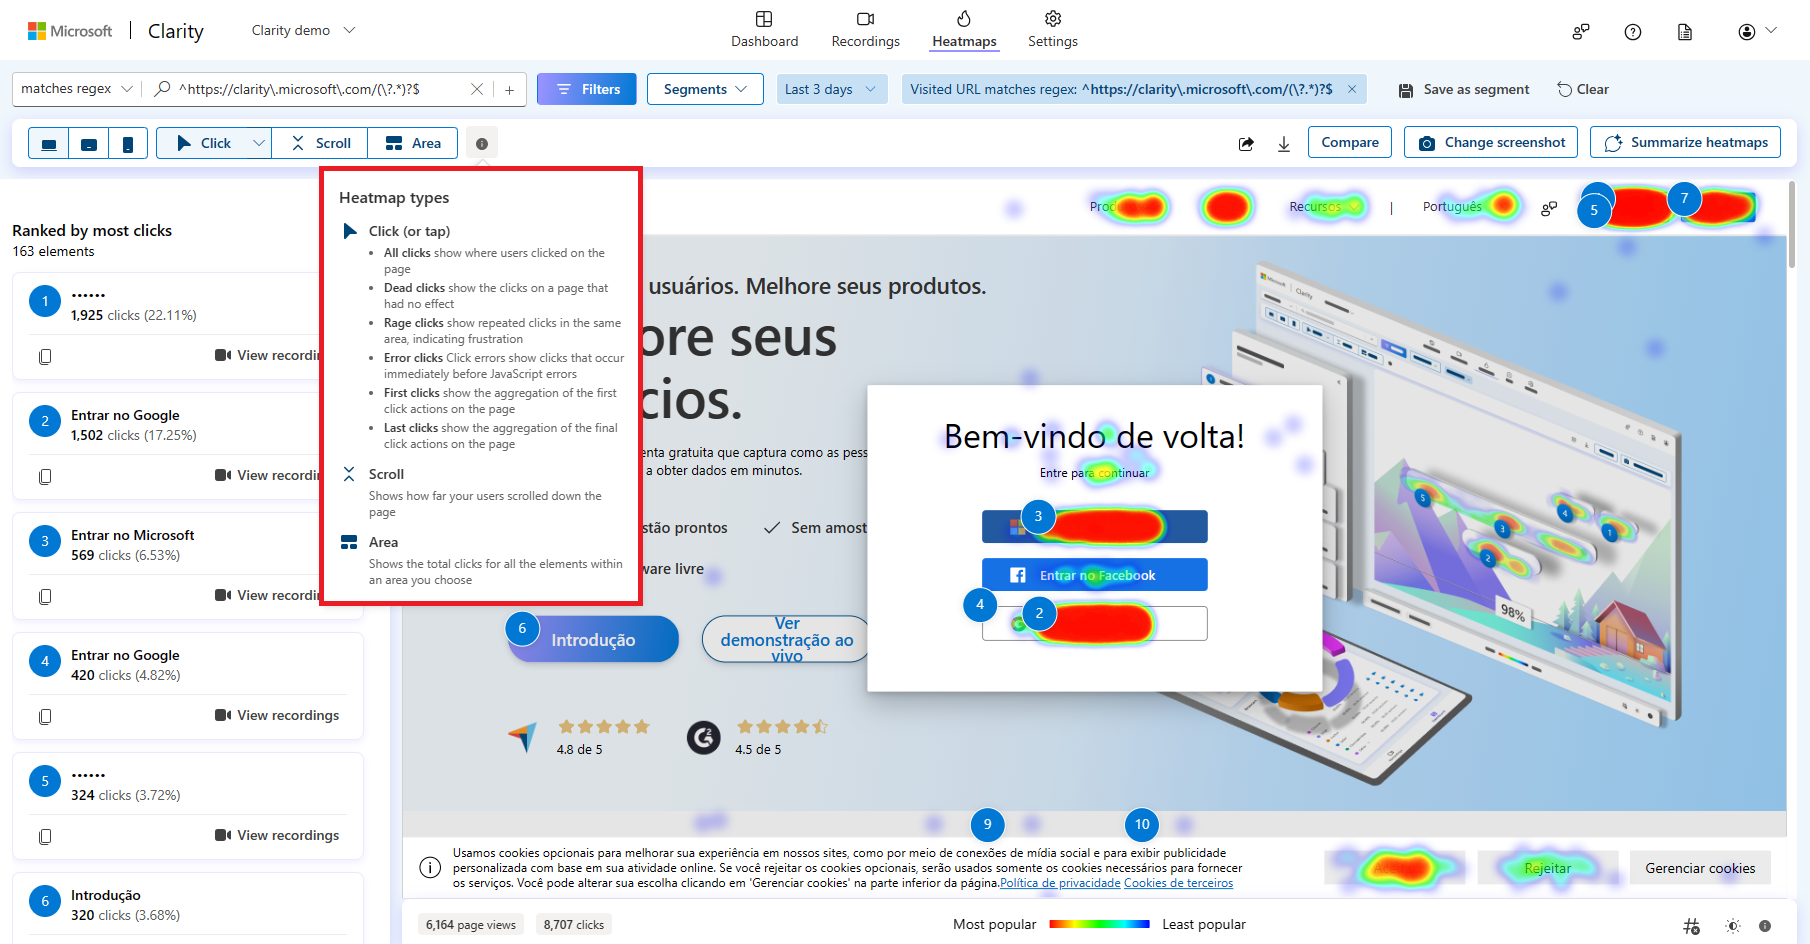
Click maps
Clicking on a heatmap shows where users are clicking on the page. It gives information about the most clicked elements and how many clicks on these elements.
Clarity click maps are built using an advanced methodology of elements-based user clicks instead of the absolute mouse position. Click maps are precise in calculating user heat in scenarios like different viewport sizes, responsive site design, and page states.
There are different types of Click maps:
- All clicks
- Dead clicks
- Rage clicks
- Error clicks
- First clicks
- Last clicks
Tip
Learn more about click maps here.
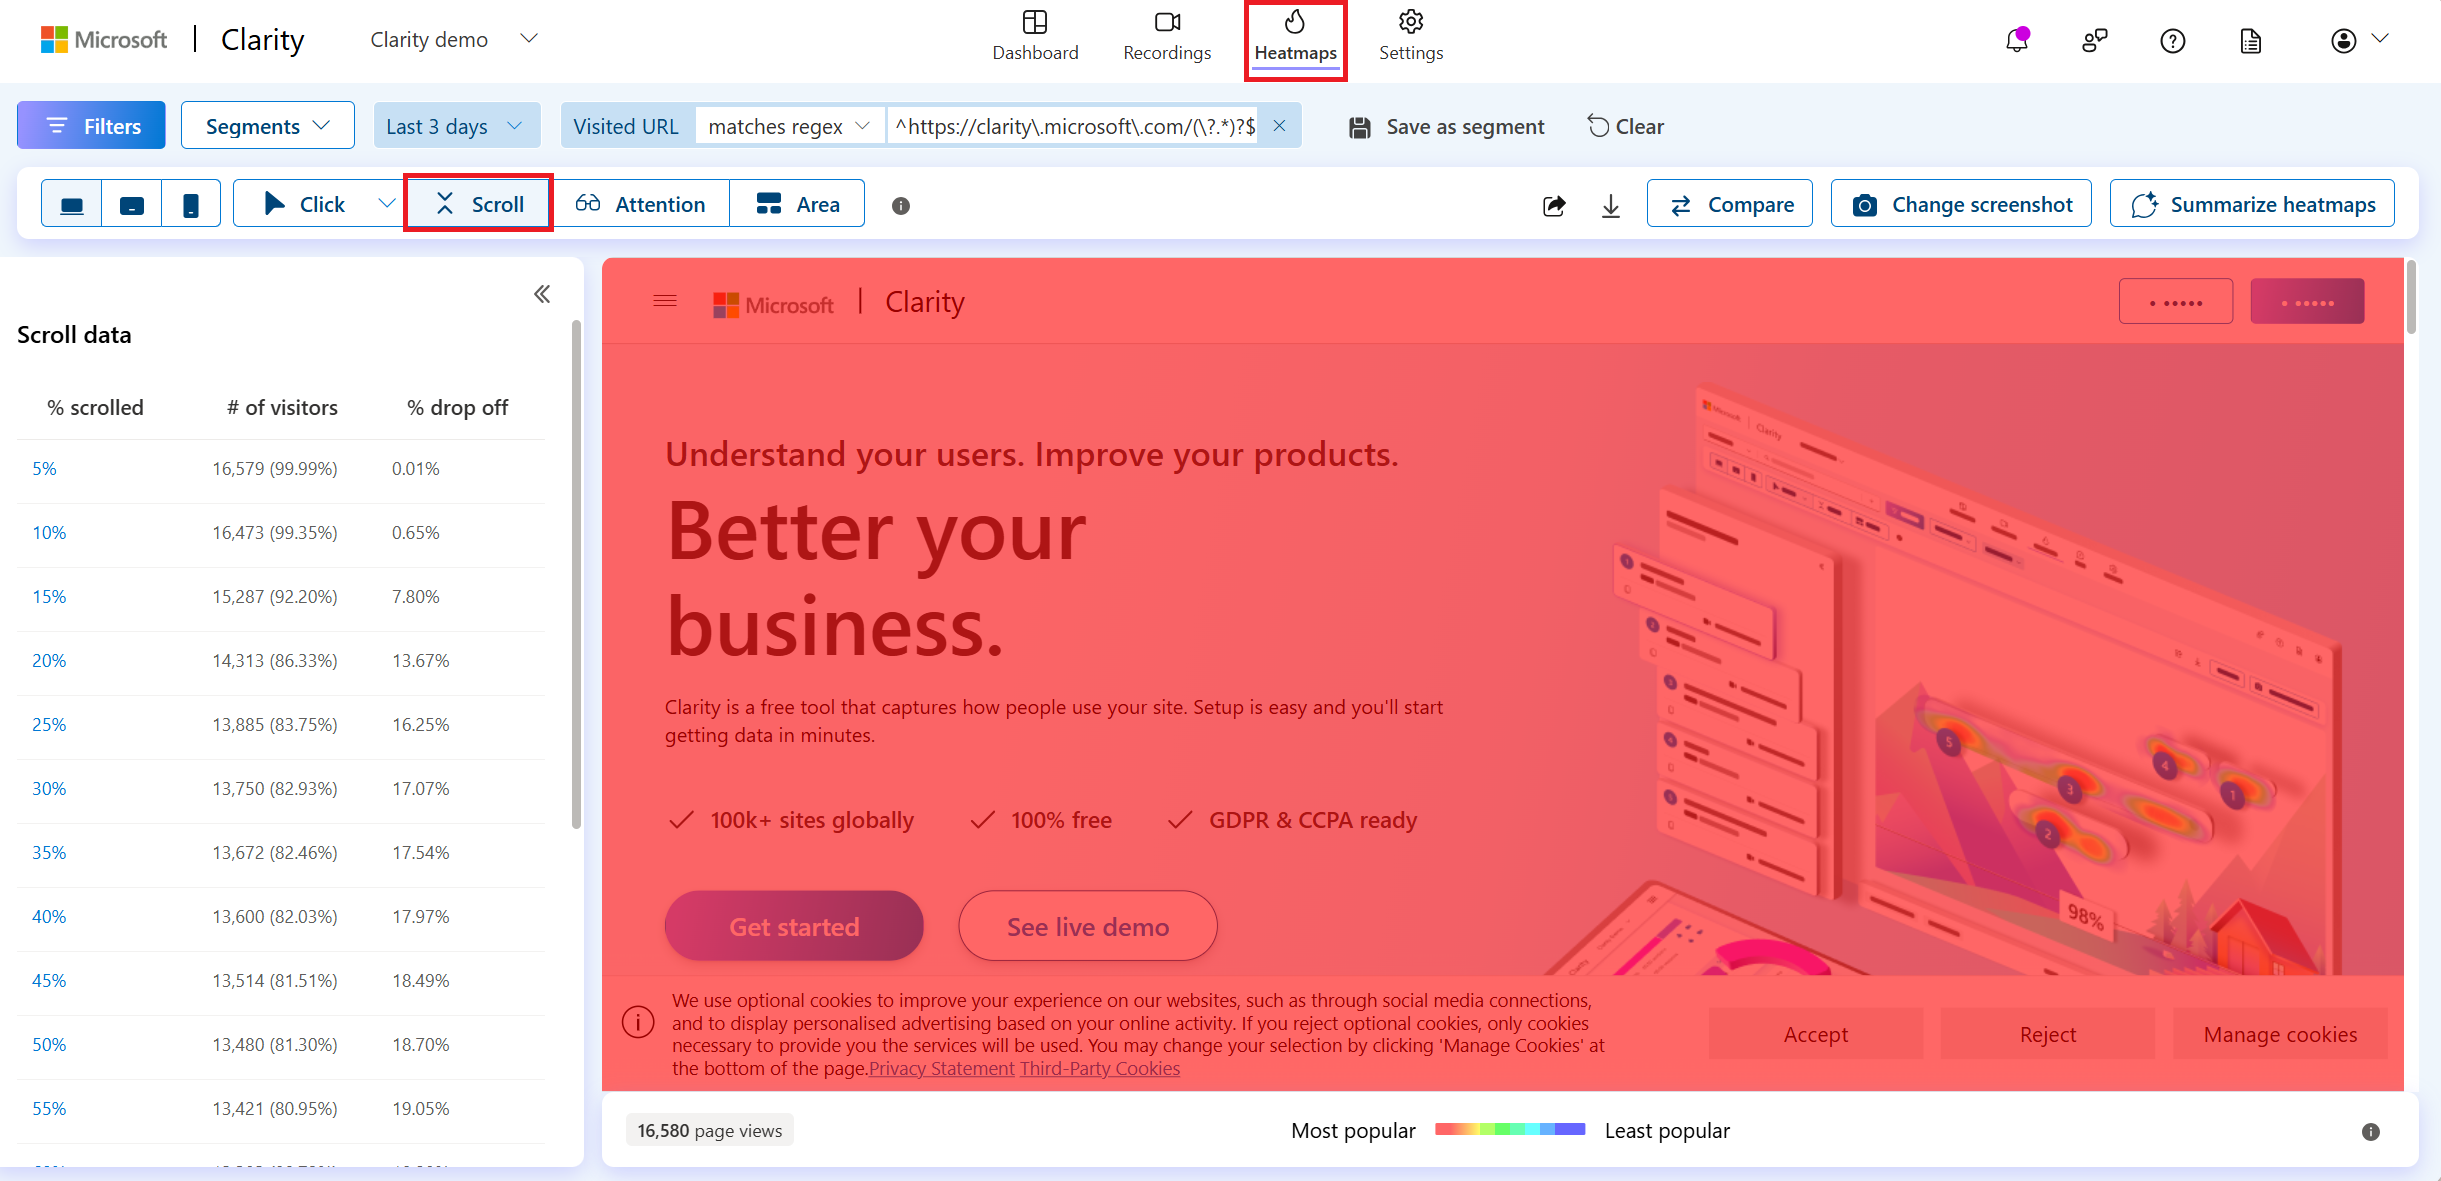
Scroll maps
Clarity Scroll maps track how far users scrolled down a page (hot being popular and cold being unpopular). It gives information about:
Percentages of users who scroll up to a particular section on your webpage.
Average fold: Content seen above the fold is based on the users accessing your site. This fold indicates the average location visible on a webpage before the user starts scrolling.
This type of heat map is most useful when representing the most and least viewed parts of a webpage. An average fold is calculated to visualize how much your users can see on average before they scroll down.
Tip
Learn more about Scroll maps here.
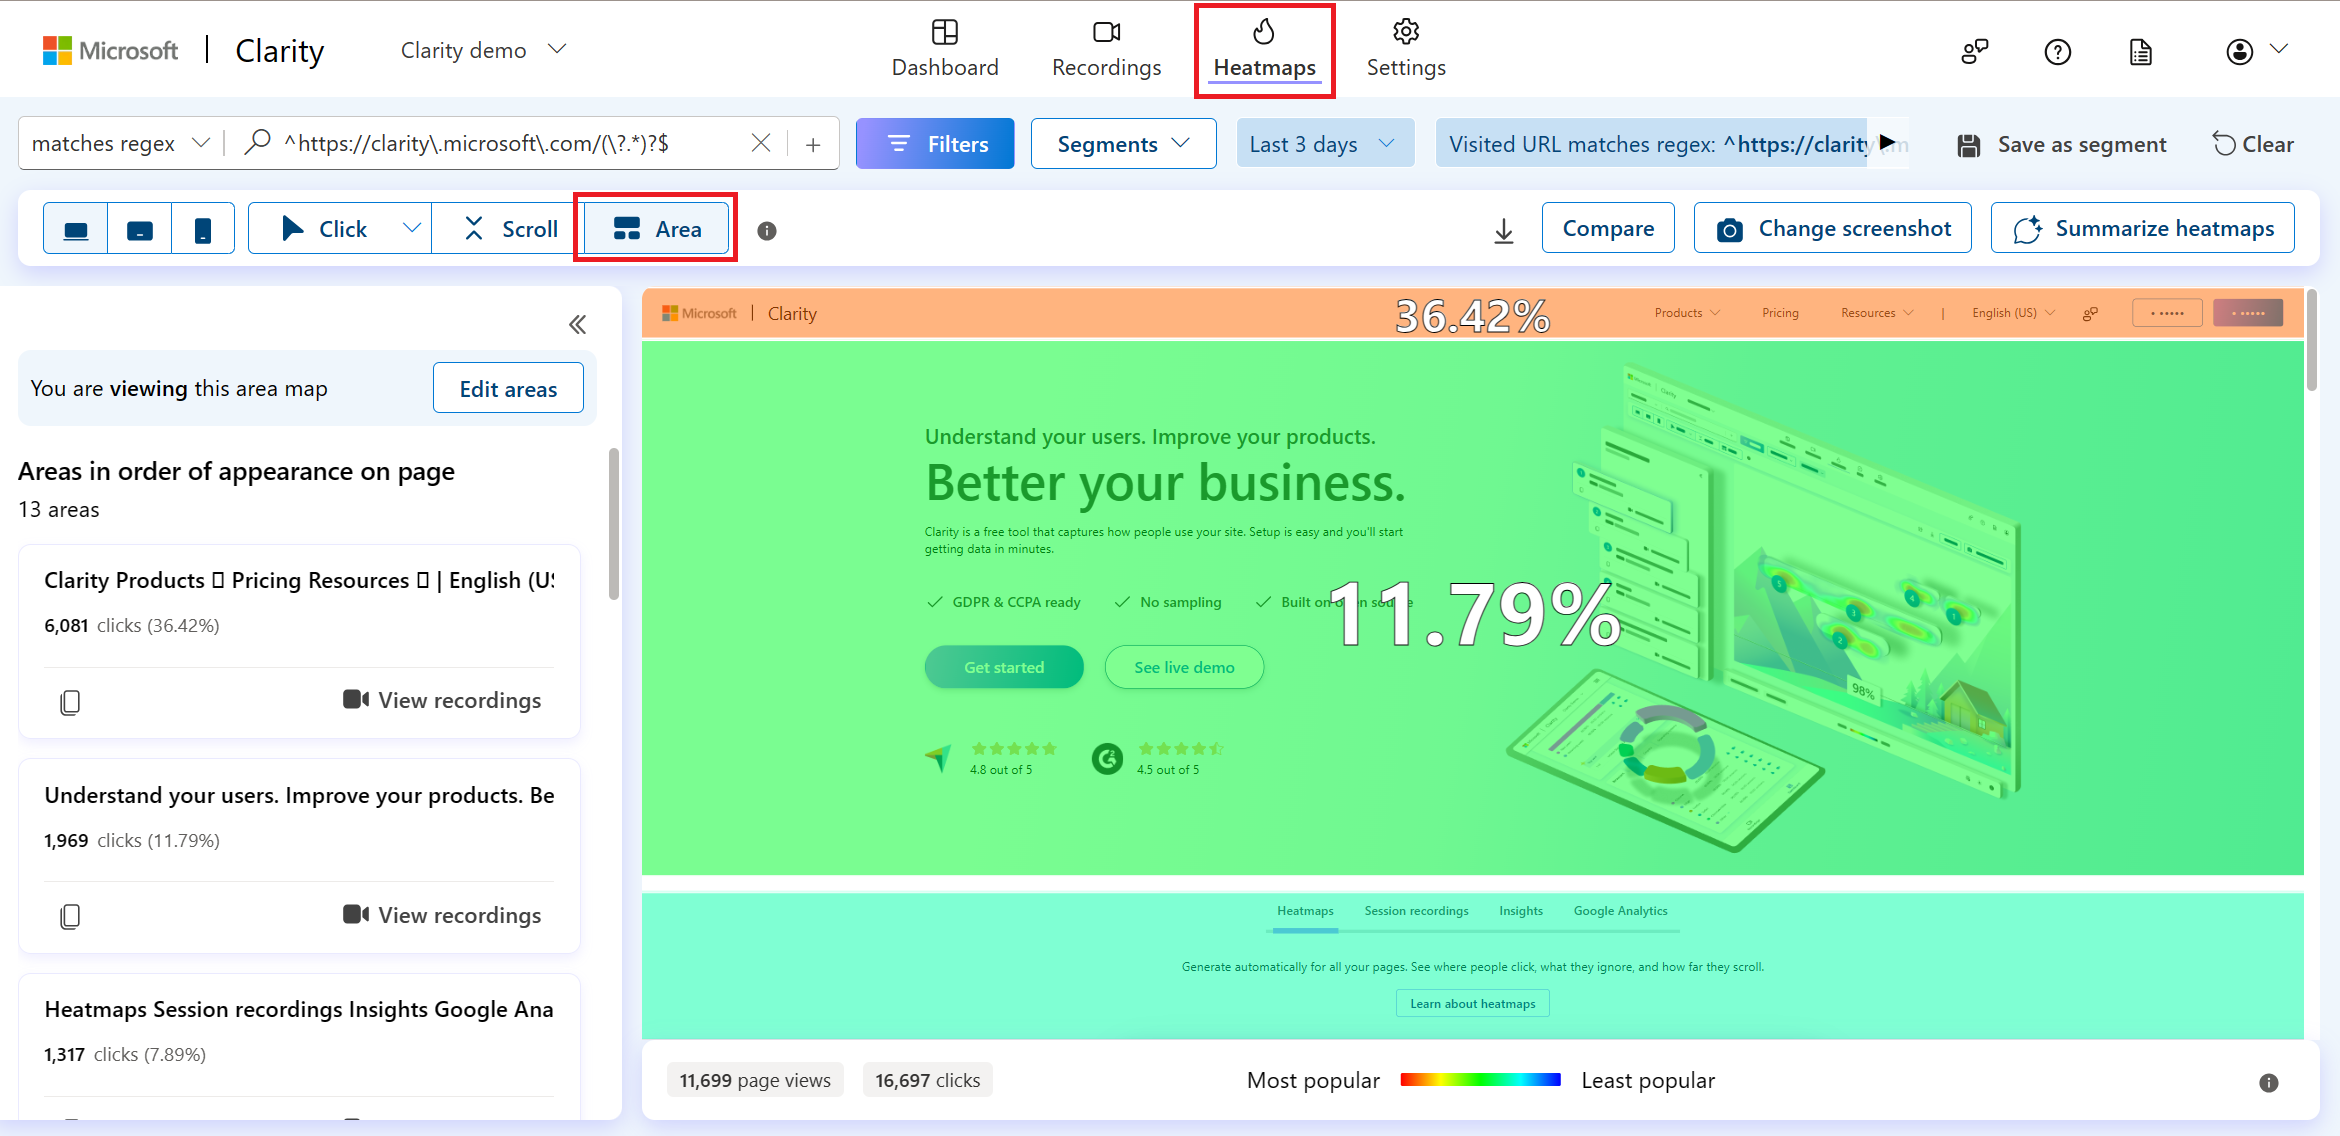
Area maps
Clarity Area maps display the total clicks for all the elements within a selected area.
Unlike a click map, you can choose the area and view the clicks for all the elements within it.
Tip
Learn more about Area maps here.
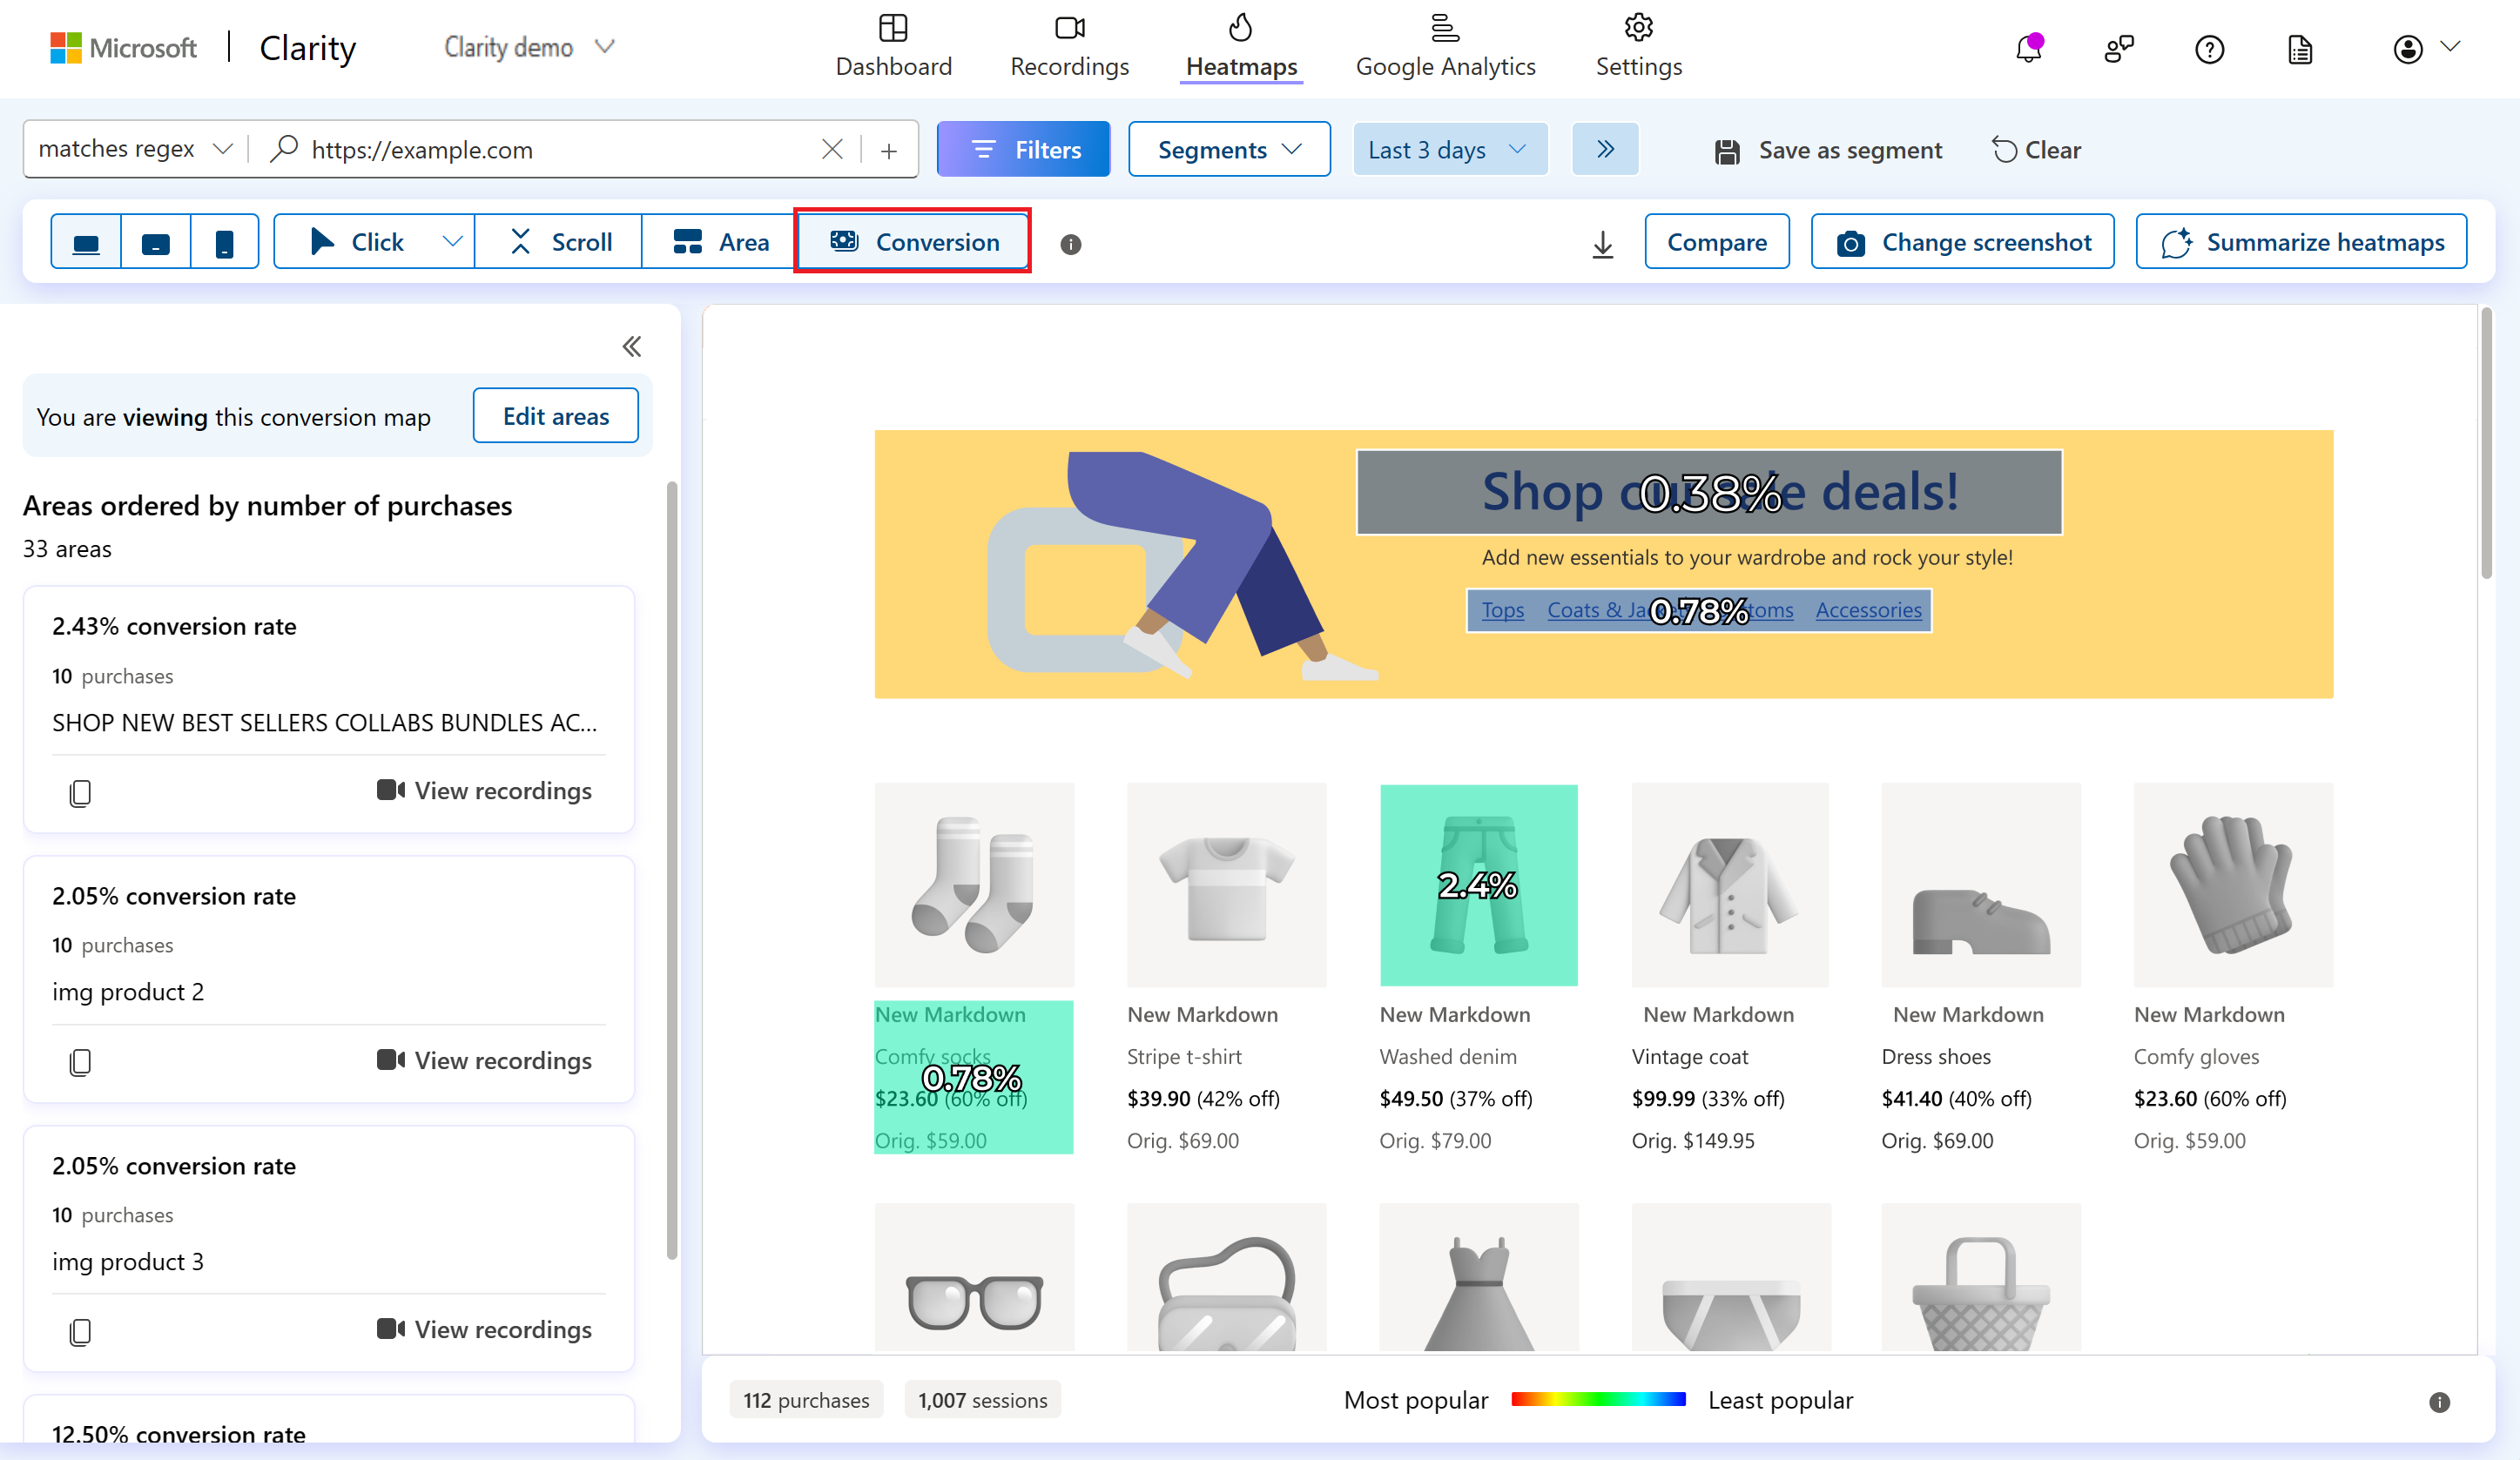
Conversion maps
Conversion maps provide specific data on purchase rate of your E-Commerce sites. Using conversion maps you can see what clicks lead to best conversions, which elements caused highest purchase prices, and what parts of your page are less successful.
Tip
Learn more about Conversion maps here.
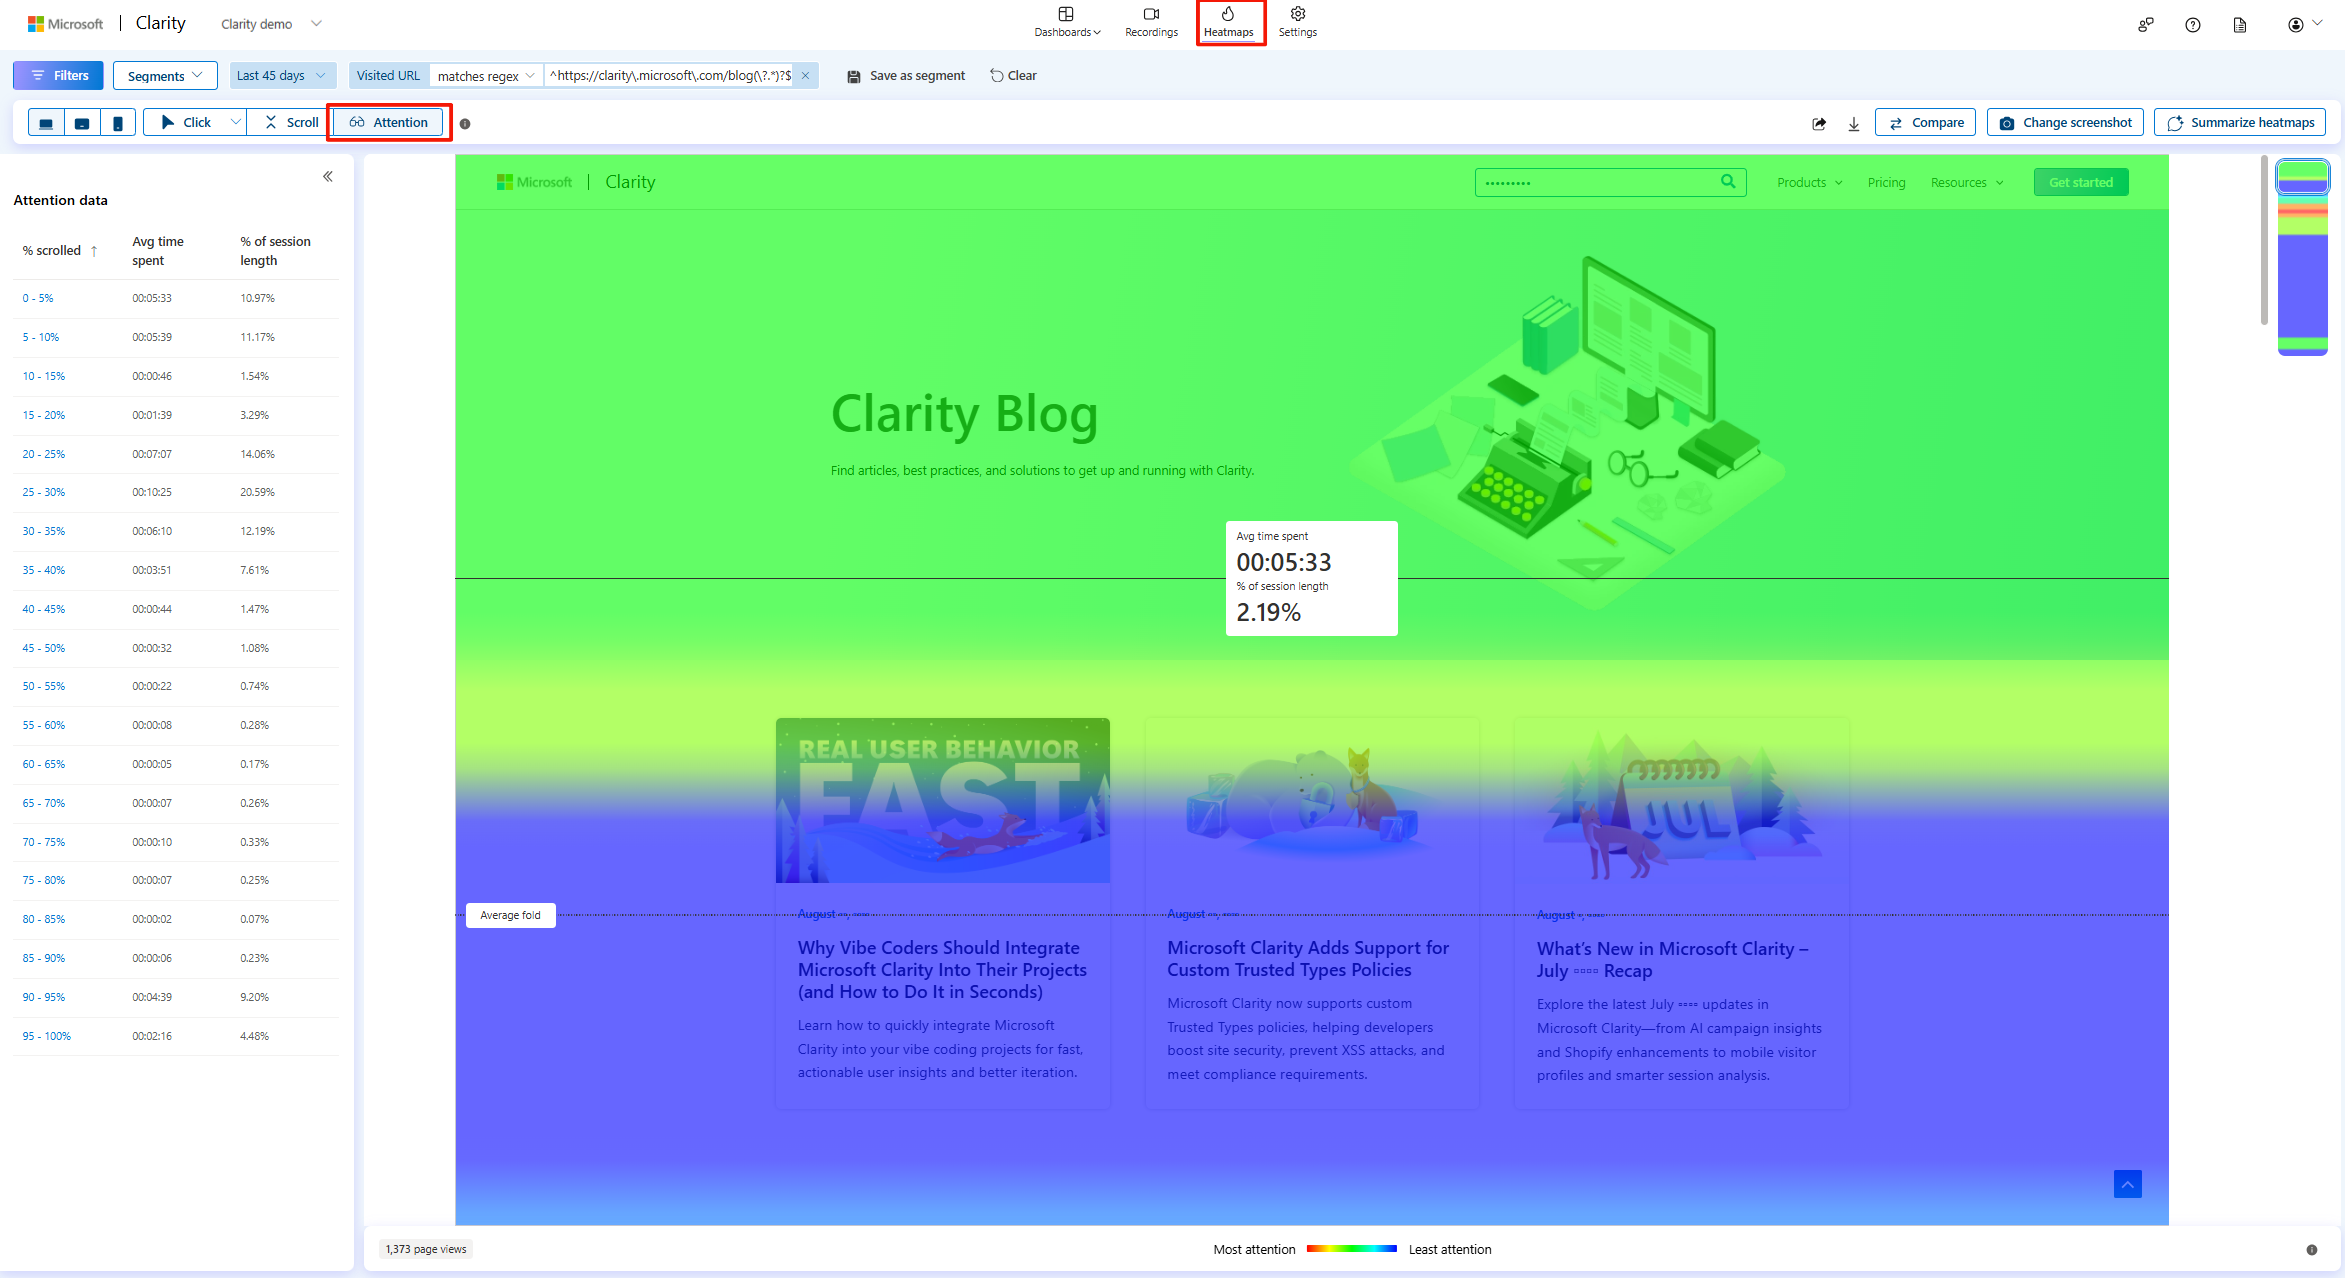
Attention maps
Attention maps display the amount of time users spent on each part of the page.
Tip
Learn more about Attention maps here.
How can I use Heatmaps for higher conversion rates?
- You can use the heatmaps compare feature to observe how site changes impacted your conversions.
- You can identify the most engaging areas of your page, allowing you to focus your efforts more effectively.
- You can use heatmaps to easily determine if your site's hierarchy and order of elements make sense to users.
- You can gain insights from click data to understand which elements resonate with your users, helping you make informed design decisions.
- You can use scroll maps to easily identify what content your users miss on your page, ensuring that important elements are always within reach.
FAQ
For more answers, refer to Heatmap FAQ.