Note
Access to this page requires authorization. You can try signing in or changing directories.
Access to this page requires authorization. You can try changing directories.
These are the latest features in the Stable release of Microsoft Edge DevTools.
Video: Microsoft Edge | What's New in DevTools 101
The Console tool is now available in Visual Studio Code
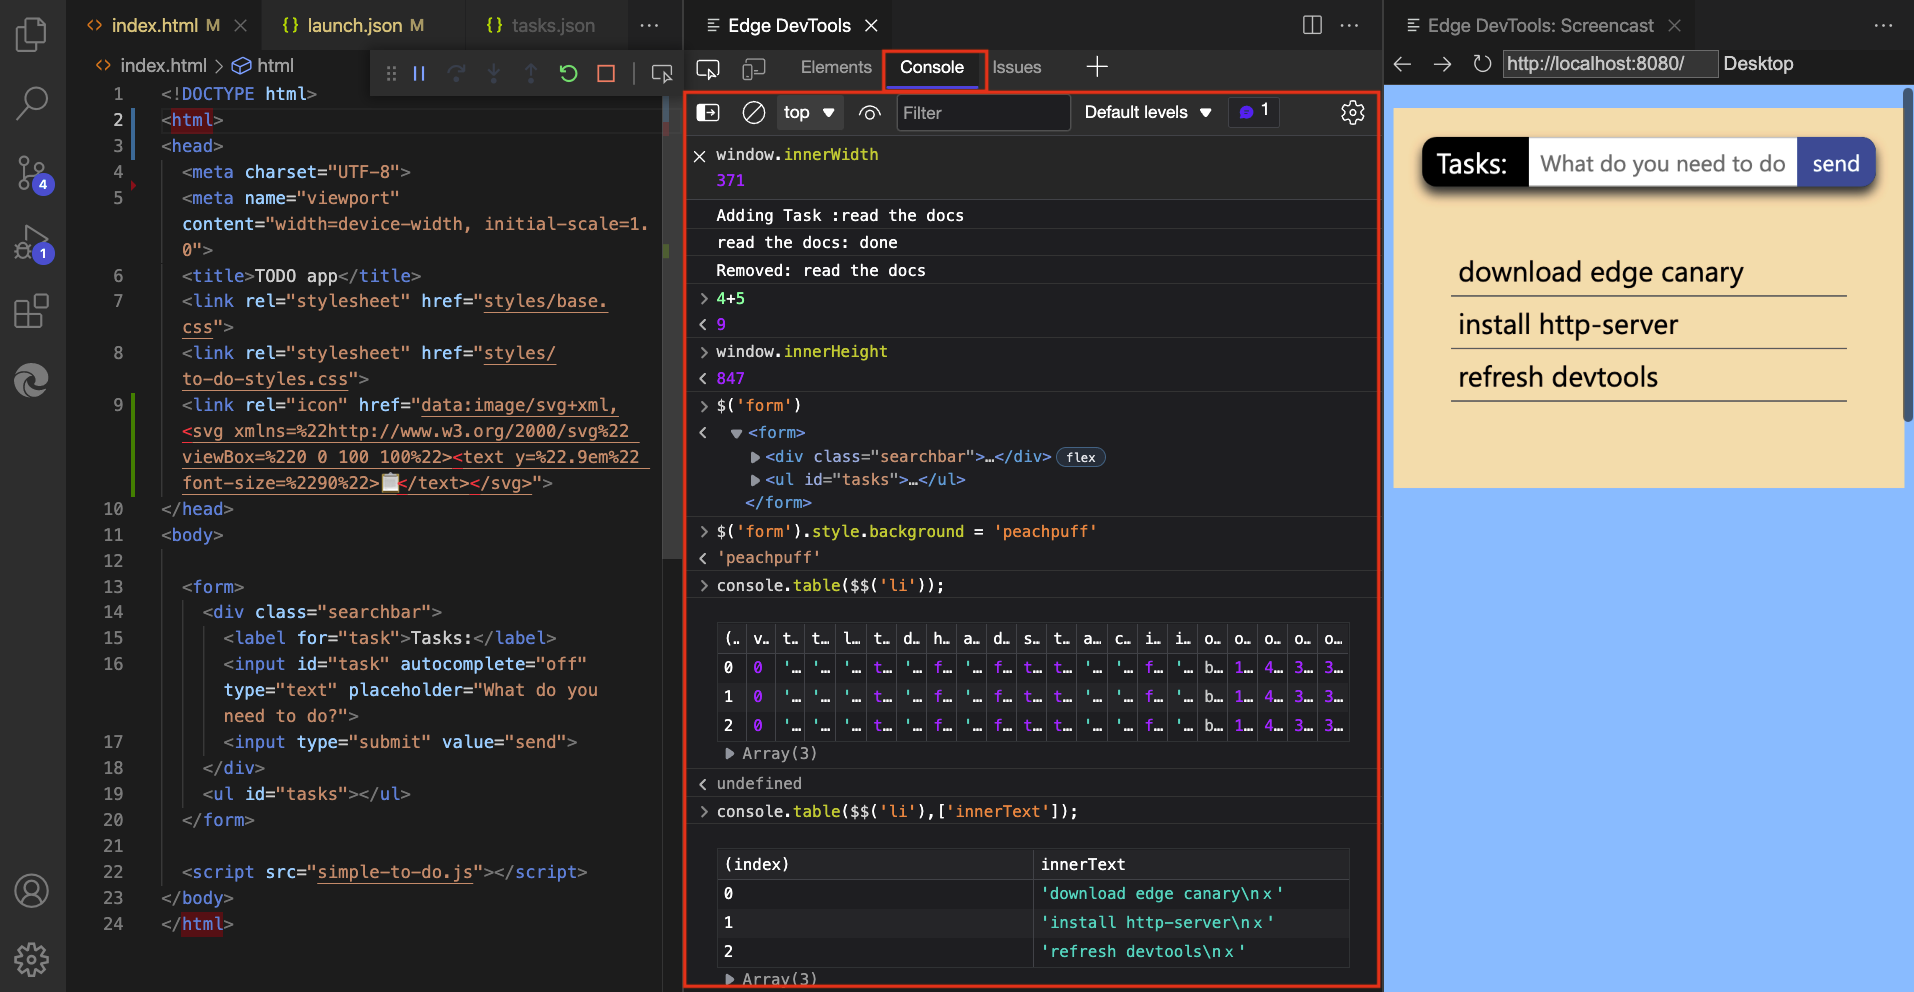
The Console is one of the most popular tools in DevTools. You can now access the Console tool in the Microsoft Edge Developer Tools extension for Visual Studio Code. This integrated DevTools Console allows you to see your log messages right next to your code. Using the Console, you can also:
- Try out some JavaScript statements.
- Access the window object.
- Call the methods of the
Consoleobject, as described in Console object API Reference. - Use the Console utilities to access the DOM, as described in Console tool utility functions and selectors.
You can use the Console as the main tool, or use it together with the Elements and Network tools.
The Console tool open in the main toolbar of the Microsoft Edge DevTools extension for Visual Studio Code:
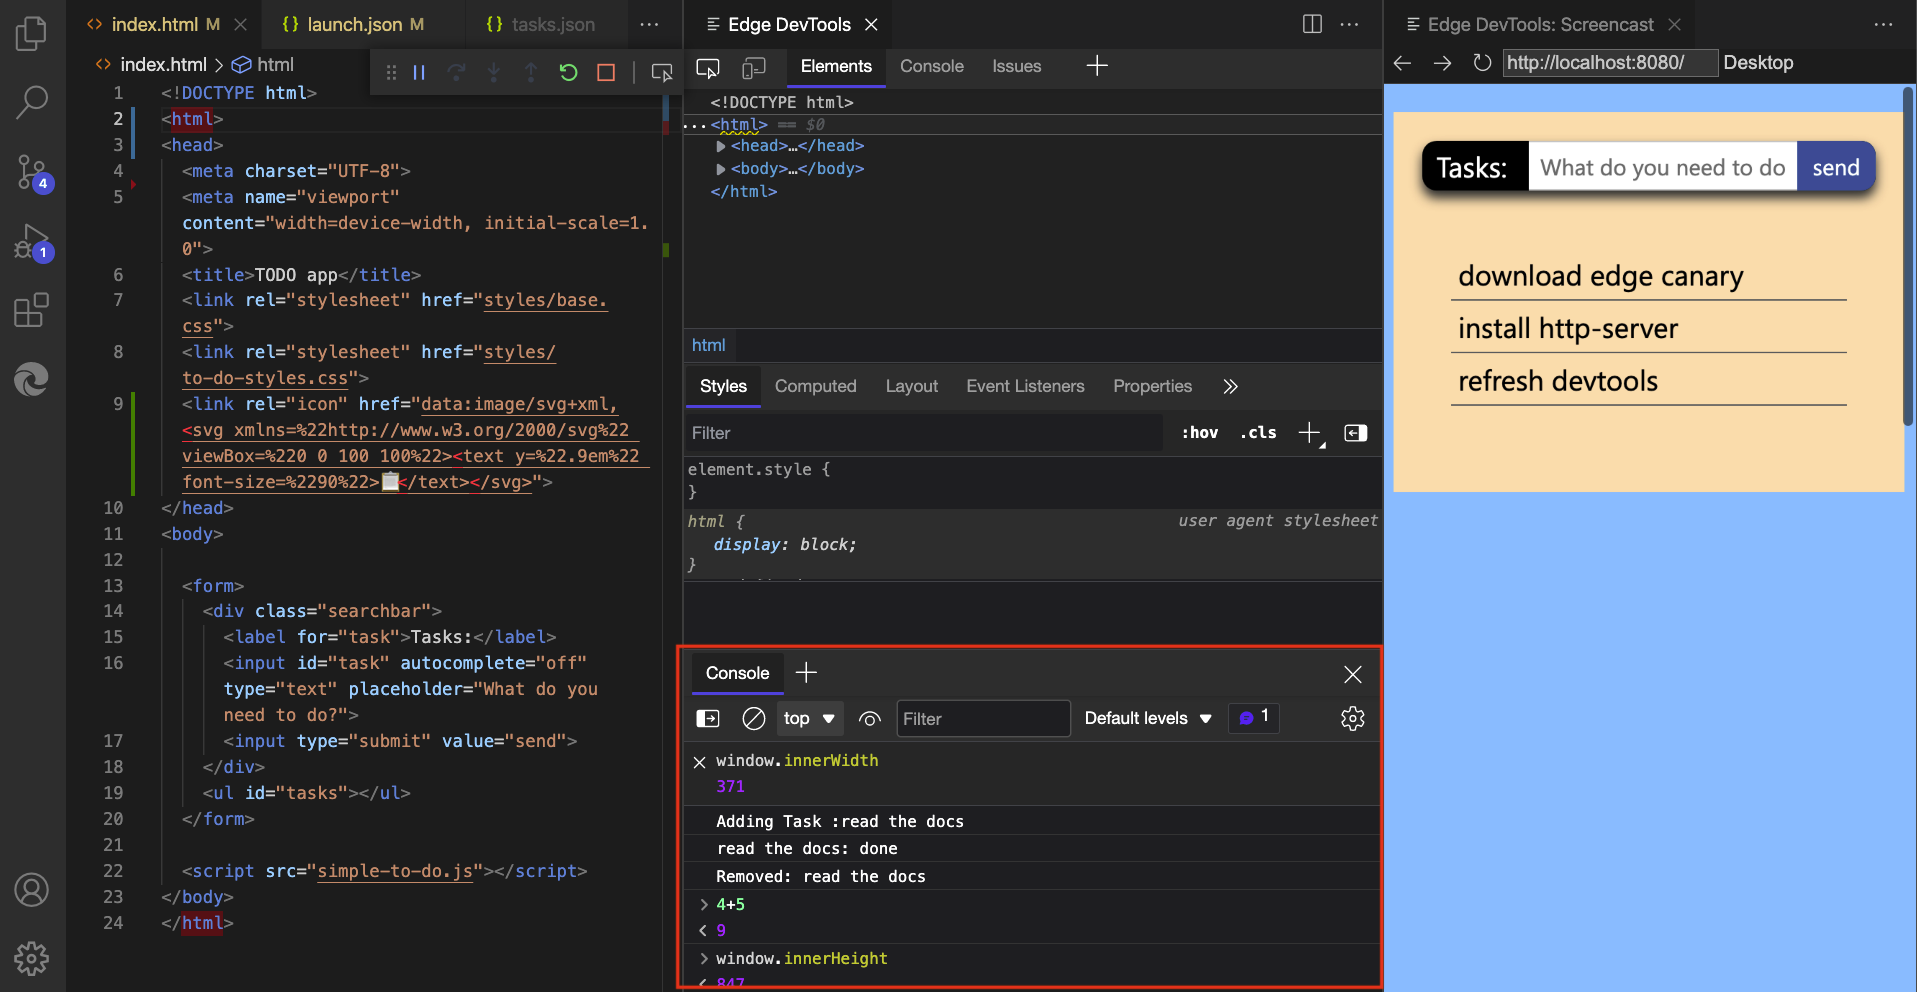
The Console tool open in the Drawer of the Microsoft Edge DevTools extension for Visual Studio Code:
For more information, see Console integration.
Source maps are now cached with IndexedDB
In previous versions of Microsoft Edge, if you were hosting large source map files on your server or in Azure Artifacts symbol server, DevTools would fetch these source maps every time the page refreshed. Fetching these source maps repeatedly created more network requests for DevTools, and slowed down debugging.
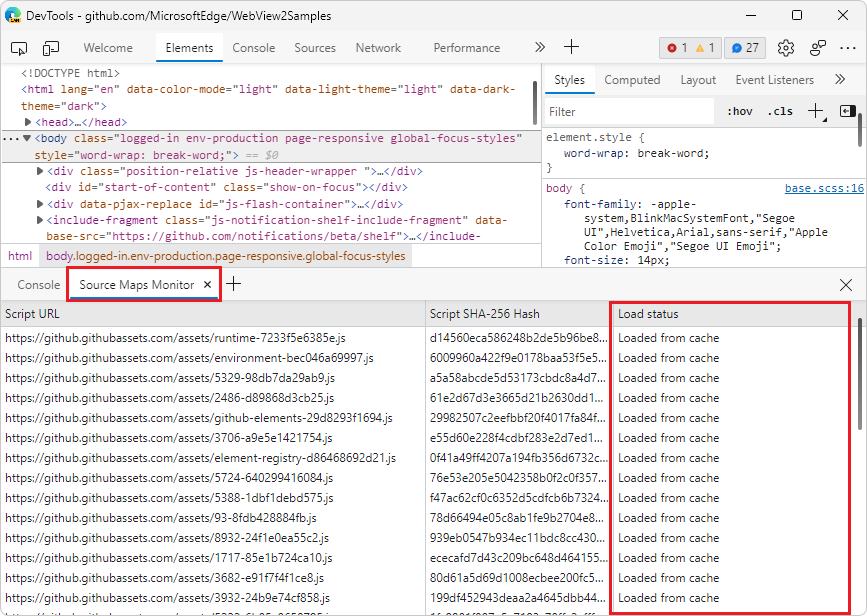
In Microsoft Edge 101, DevTools caches source maps by using IndexedDB. When you refresh the page, source maps are now served from the IndexedDB cache, instead of being requested again from your server or the Azure Artifacts symbol server. Use the Load status column in the Source Maps Monitor tool to verify that source maps are being loaded from the cache. To clear the IndexedDB cache and force DevTools to reload source maps, run the Clear source maps cache command in the Command Menu.
When you first load the webpage, the Source Maps Monitor tool shows that the source maps aren't cached yet:
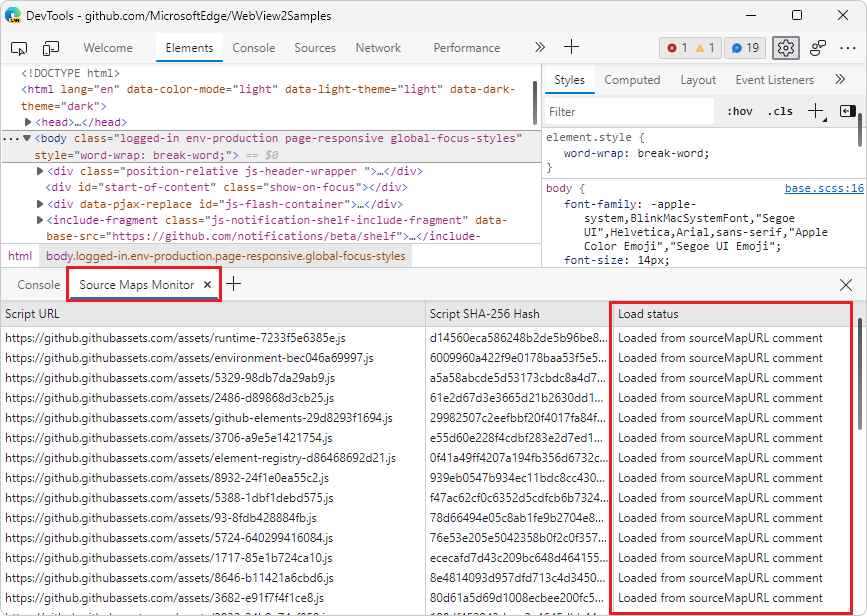
When you reload the webpage, the Source Maps Monitor tool shows that the cached source maps are used:
Tracking pending network requests when exporting HAR files
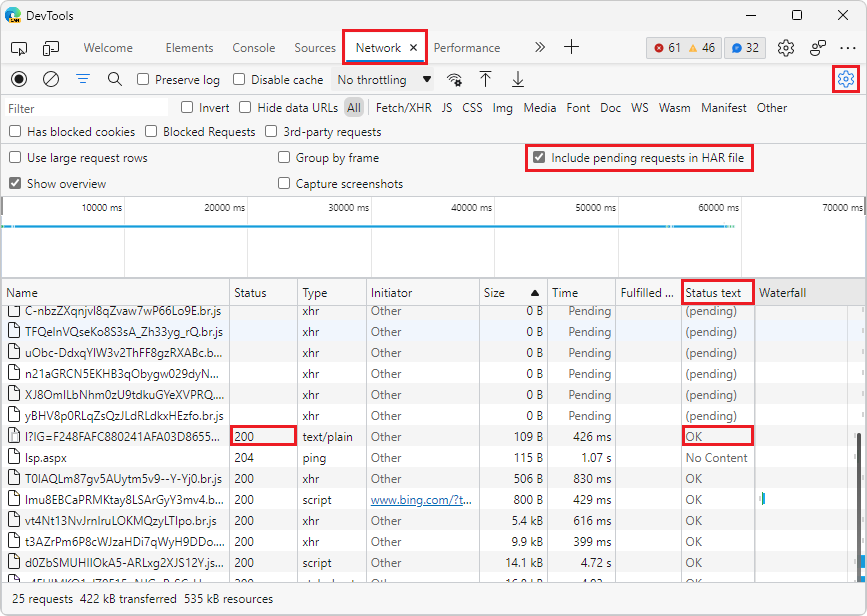
In Microsoft Edge 101, the new Status text column has been added to the Network tool. The Status text column provides human-readable equivalent messages for the HTTP status codes that are reported in the Status column.
In addition, a new setting has been added to the Network tool: Include pending requests in HAR file. If you need to record Pending network requests when exporting a HAR file in the Network tool, turn on the Include pending requests in HAR file setting. The Status text column will now include the (pending) state for any pending network requests.
To learn more about the available columns in the request log, see Network features reference > Add or remove columns.
Updated UI and camera controls in 3D View
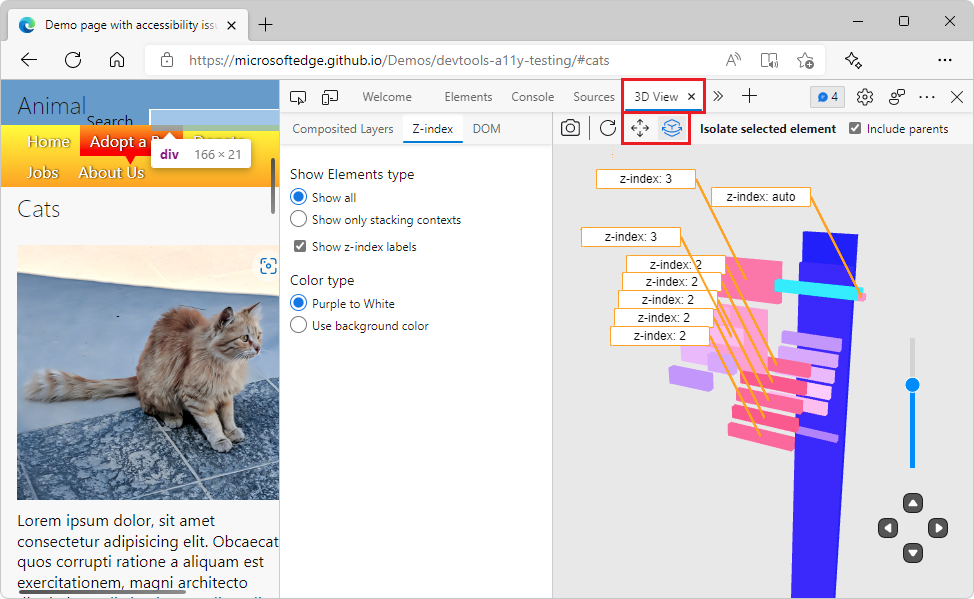
In Microsoft Edge 101, the 3D View tool has two new buttons: Pan view (![]() ) and Rotate view (
) and Rotate view (![]() ). Use these buttons to switch between panning around the canvas or rotating the canvas. Click the Pan view or Rotate view button, and then drag in the desired direction with your mouse, or use the arrow keys.
). Use these buttons to switch between panning around the canvas or rotating the canvas. Click the Pan view or Rotate view button, and then drag in the desired direction with your mouse, or use the arrow keys.
The UI now provides a more uniform and intuitive experience. The panes are organized more clearly, and accessibility issues have been fixed.
See Navigate webpage layers, z-index, and DOM using the 3D View tool.
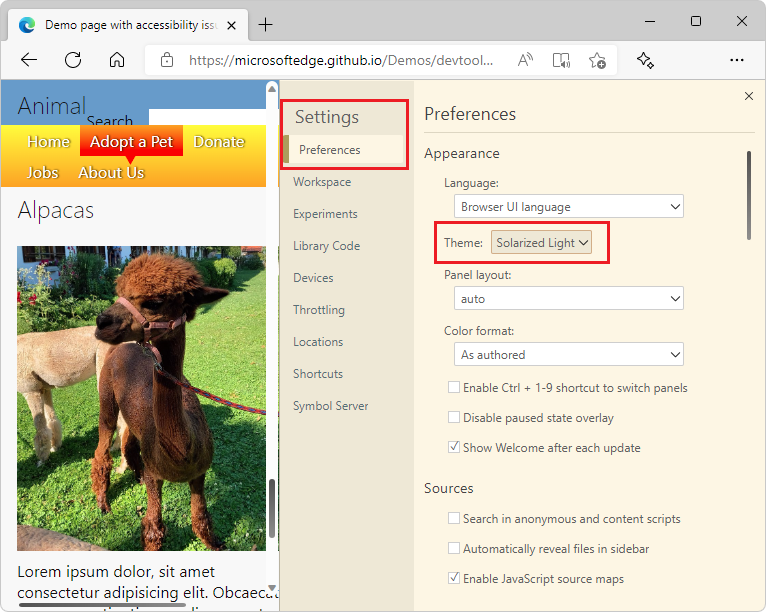
Switching themes no longer requires reloading DevTools
In previous versions of Microsoft Edge, switching themes in DevTools required reloading DevTools to apply the new theme. In Microsoft Edge 101, you can quickly try different themes without having to reload DevTools.
Announcements from the Chromium project
Microsoft Edge 101 also includes the following updates from the Chromium project:
- View cascade layers in the Styles pane
- Support for the hwb() color function
- Improved the display of private properties