Note
Access to this page requires authorization. You can try signing in or changing directories.
Access to this page requires authorization. You can try changing directories.
APPLIES TO: ![]() Power BI service for business users
Power BI service for business users ![]() Power BI service for designers & developers
Power BI service for designers & developers ![]() Power BI Desktop
Power BI Desktop ![]() Requires Pro or Premium license
Requires Pro or Premium license
A Power BI report is one or more pages of organized visuals. All Power BI users can create and edit their own reports. However, opening reports created by others requires a paid license (Power BI Pro or Premium Per User) or special access to a Premium capacity.
This article teaches you how to open reports that are shared with you. The most common scenarios are covered. The first scenario is when a Power BI designer creates a report and shares it directly. The second scenario is when a designer shares a report as part of an app.
For more information about sharing reports, see Licenses and subscriptions for business users.
Open a report that is shared with you
Power BI designers share reports with you by sending an email link or by adding the report to your Power BI content. These reports are located under Shared in the Browse tab.
Open the Power BI service (app.powerbi.com), and sign in if you're prompted.
On the navigation pane, select Browse, and on the Browse page, select Shared.
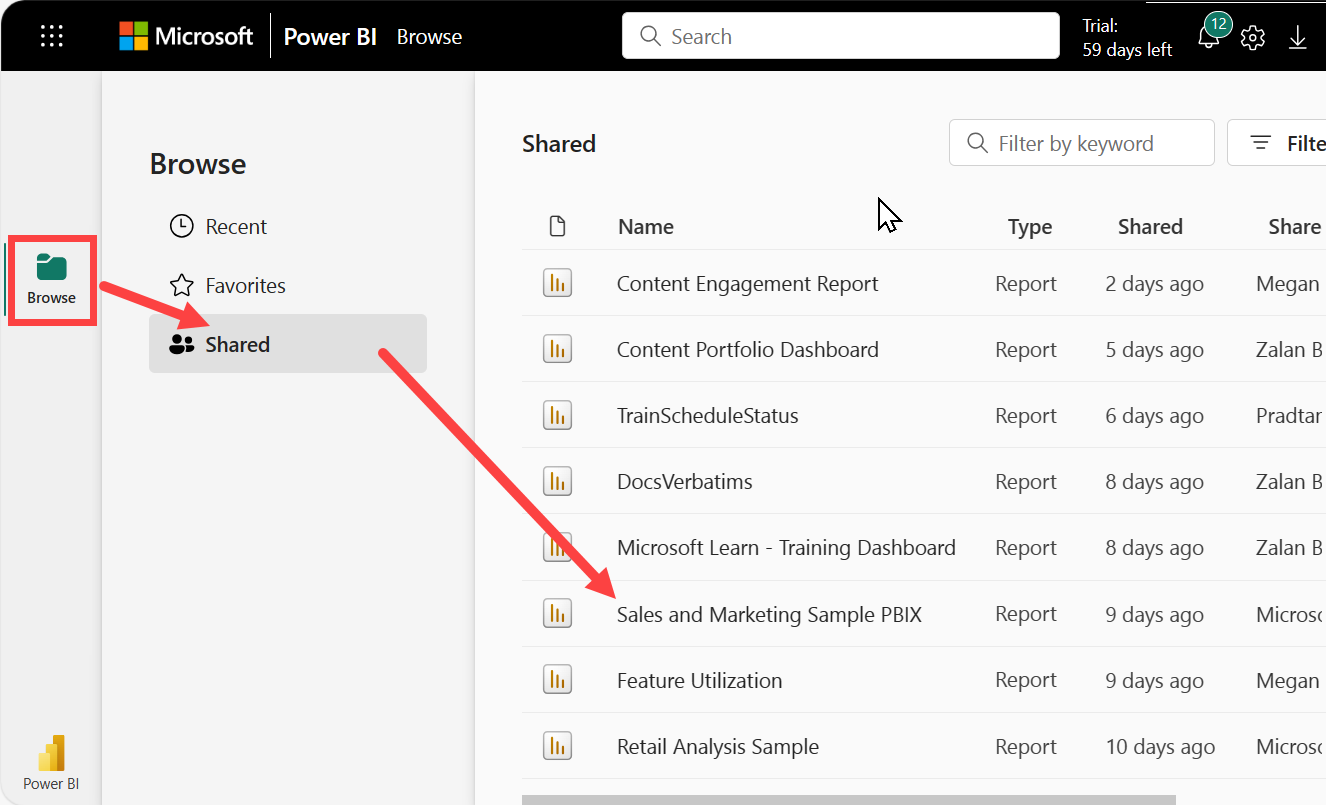
The report icon
 is displayed next to the report name. Select a report to open it.
Explore the report
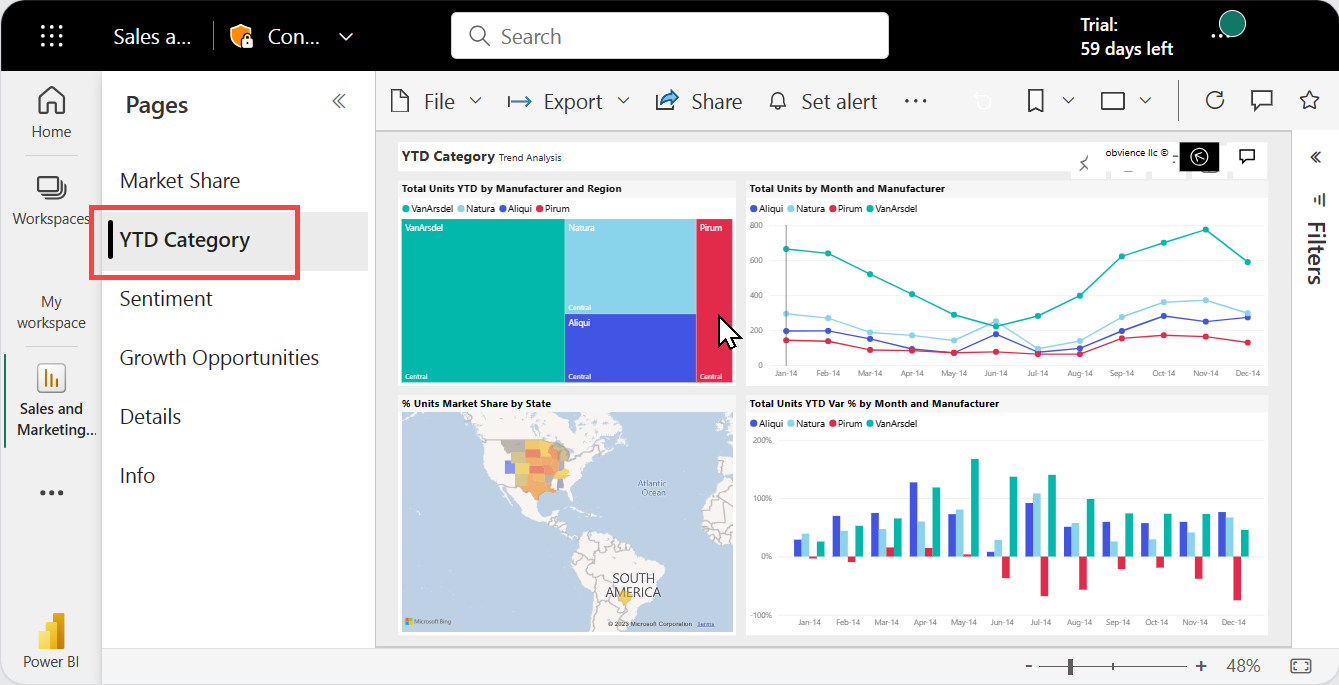
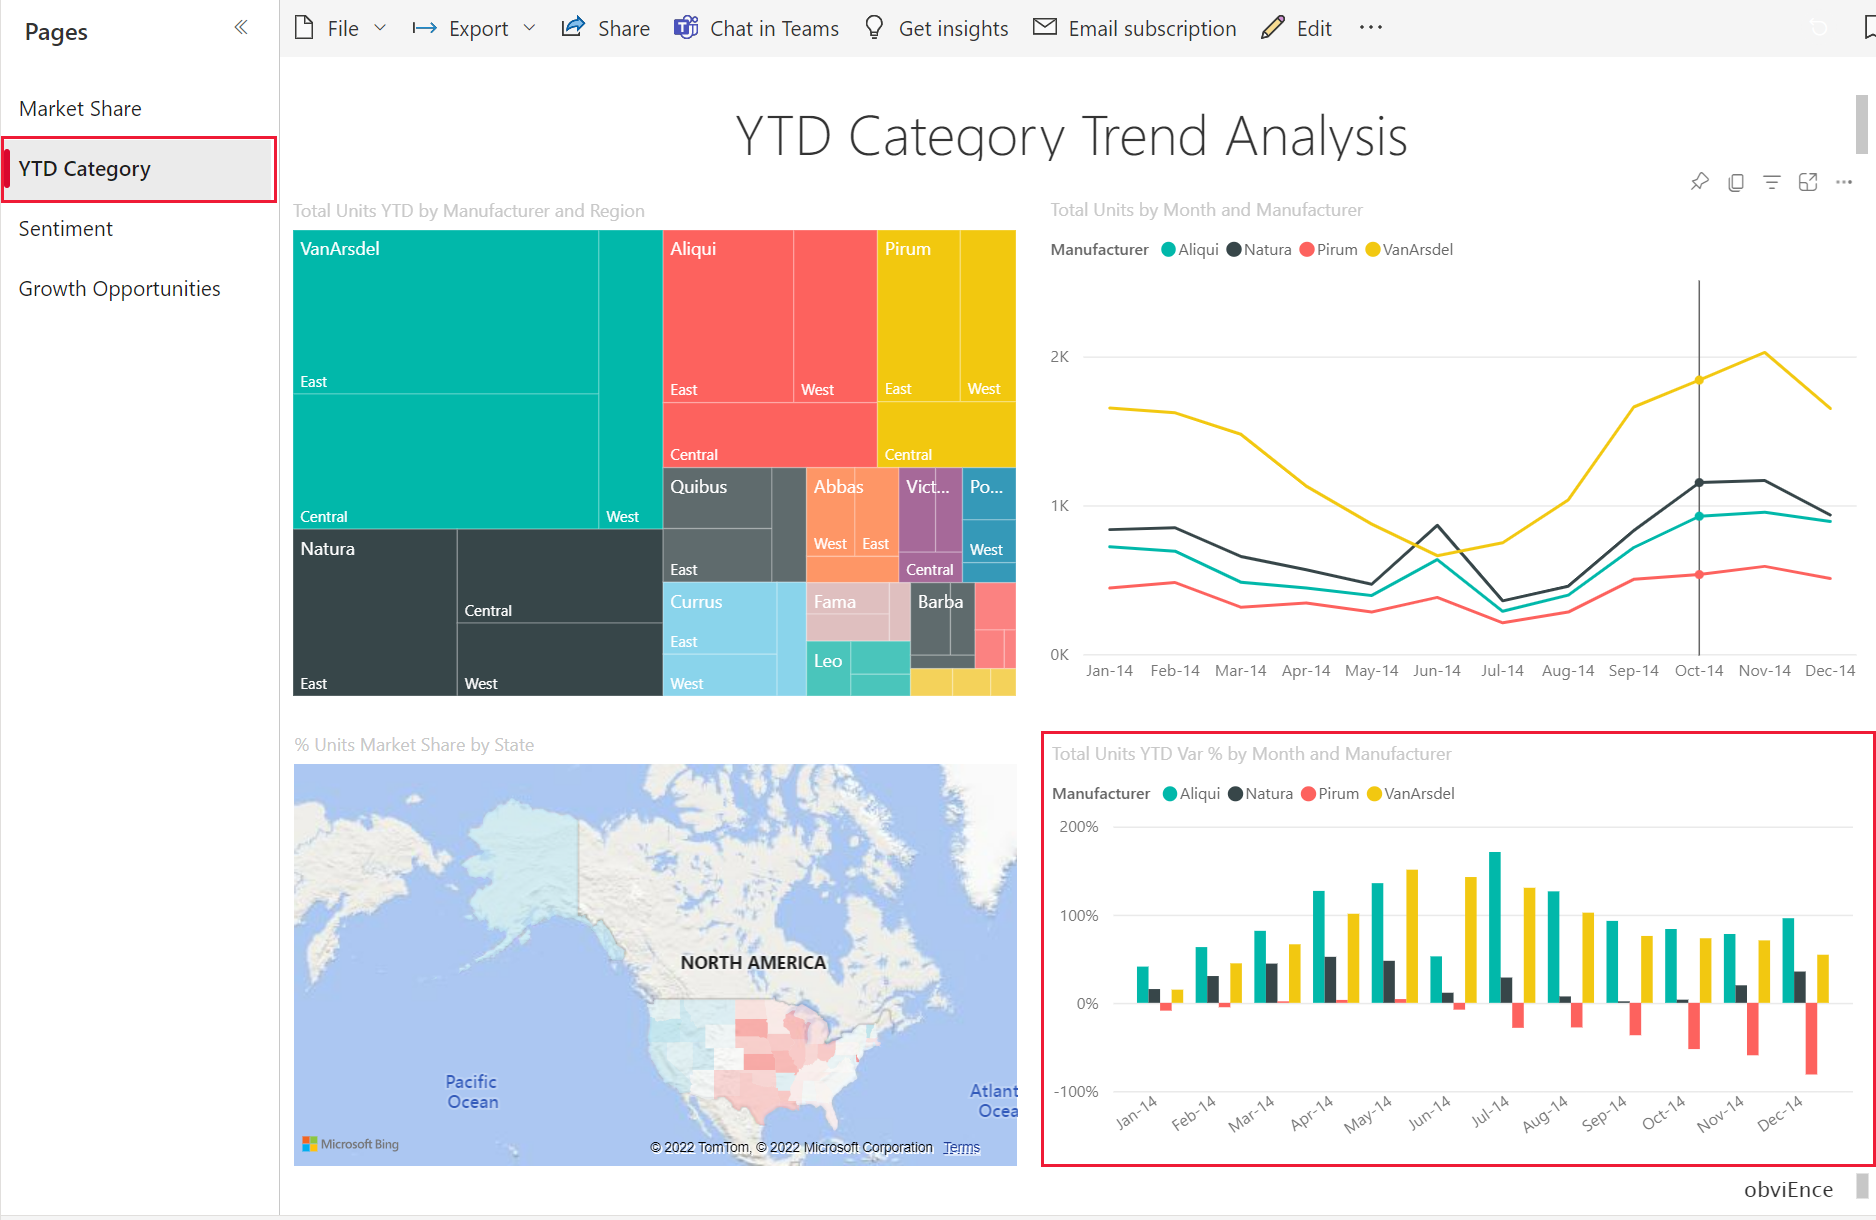
Notice the tabs along the left side. Each tab represents a report page or a dashboard. Selecting the YTD Category tab opens the YTD Category Trend Analysis page.
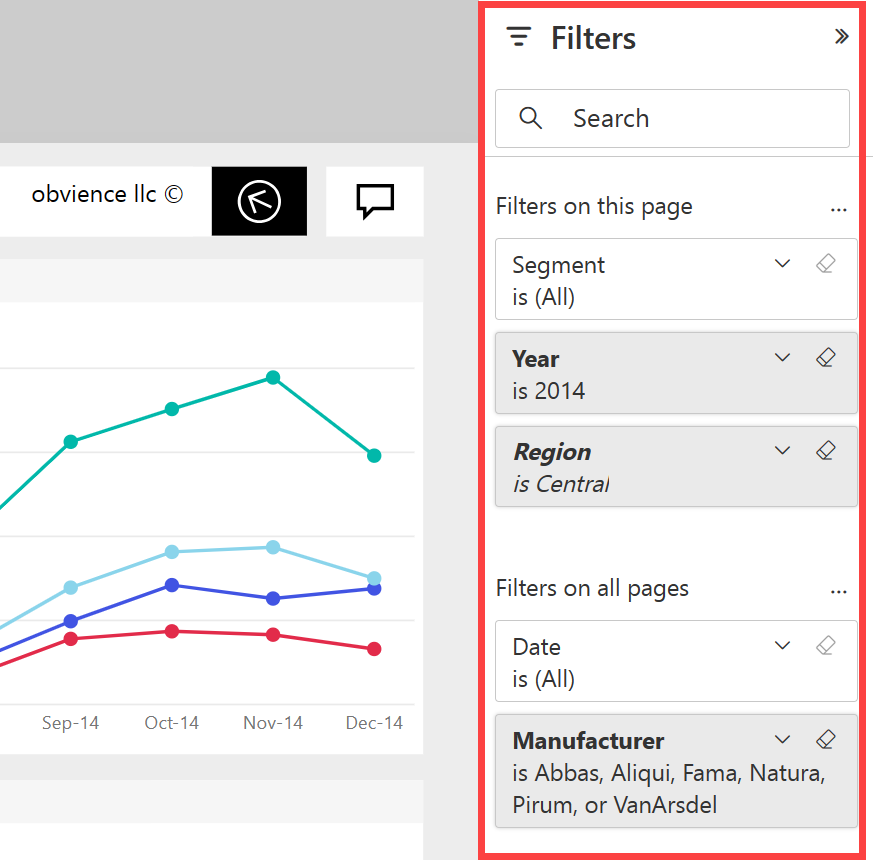
Expand the Filters pane along the right side. Filters that are applied to this report page, or to the entire report, are displayed here. If you have permissions, change these filters to see the impact on your report and visuals.
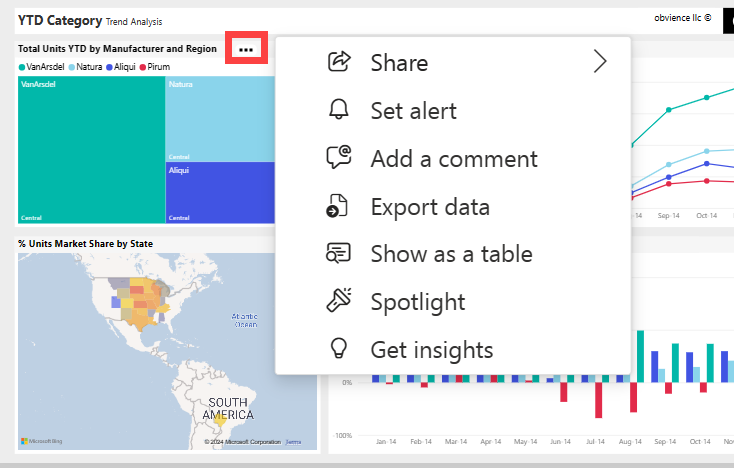
Hover over a visual to show the actions you can perform. For this treemap, we see pin, copy, filter, display the visual at full size, and an ellipsis (...).
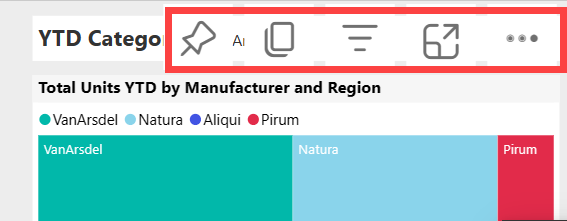
Select the ellipsis (...) to see more options.
Explore the action bar at the top of your report. From the File menu, you can make copies and print. If you have permissions, Export your report to PowerPoint or Share your report with colleagues. Select Get insights and Power BI searches for and displays interesting information from the report data. All of the features available from the action bar are explained in separate Power BI articles.
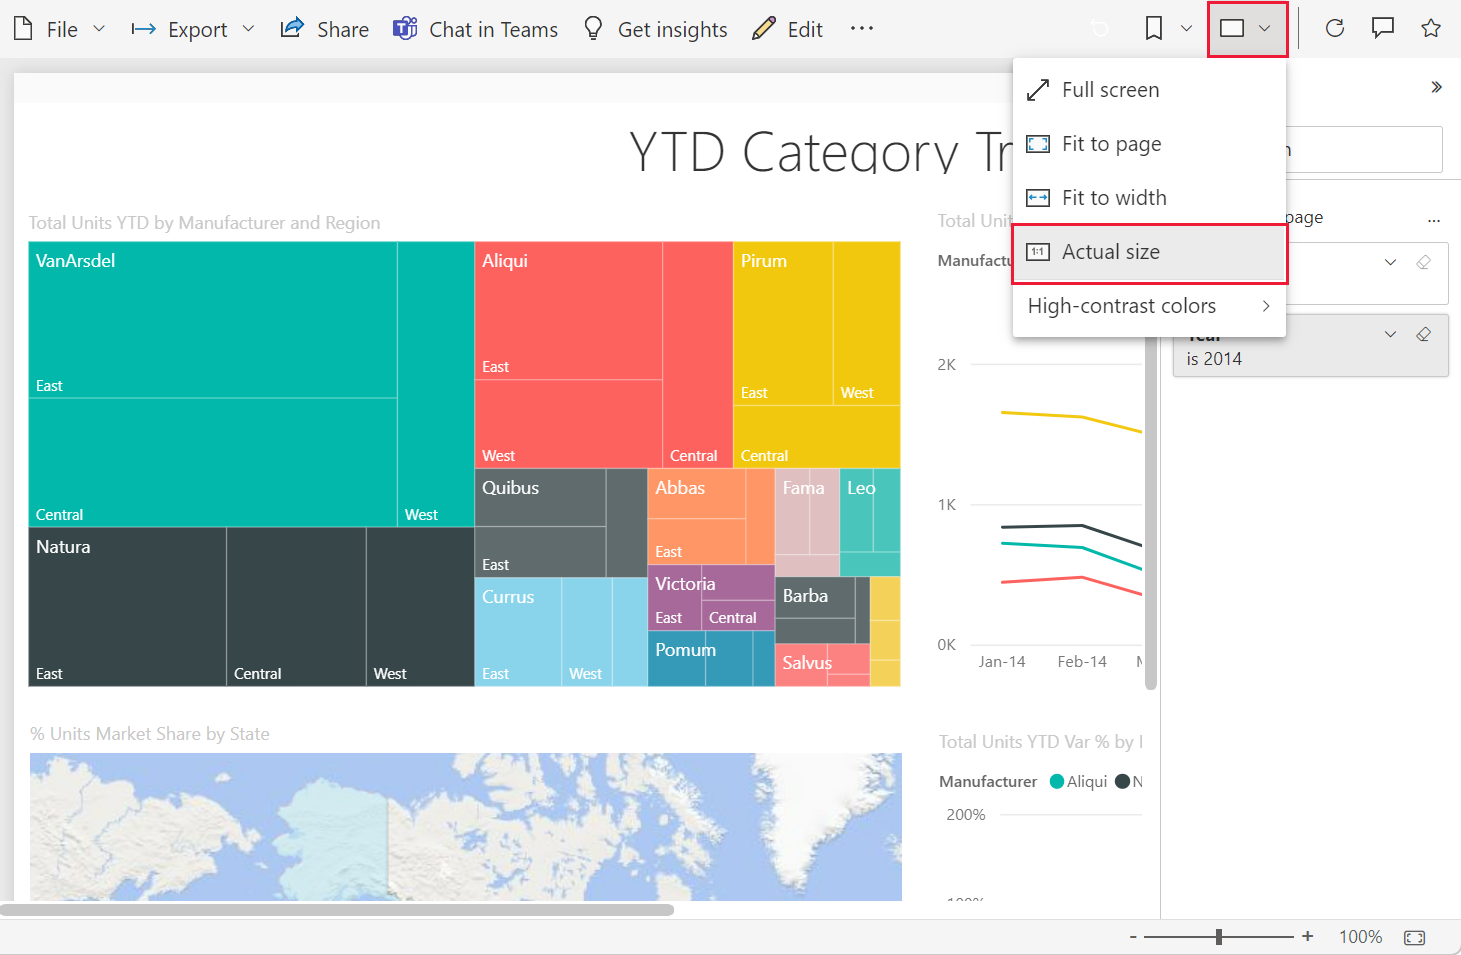
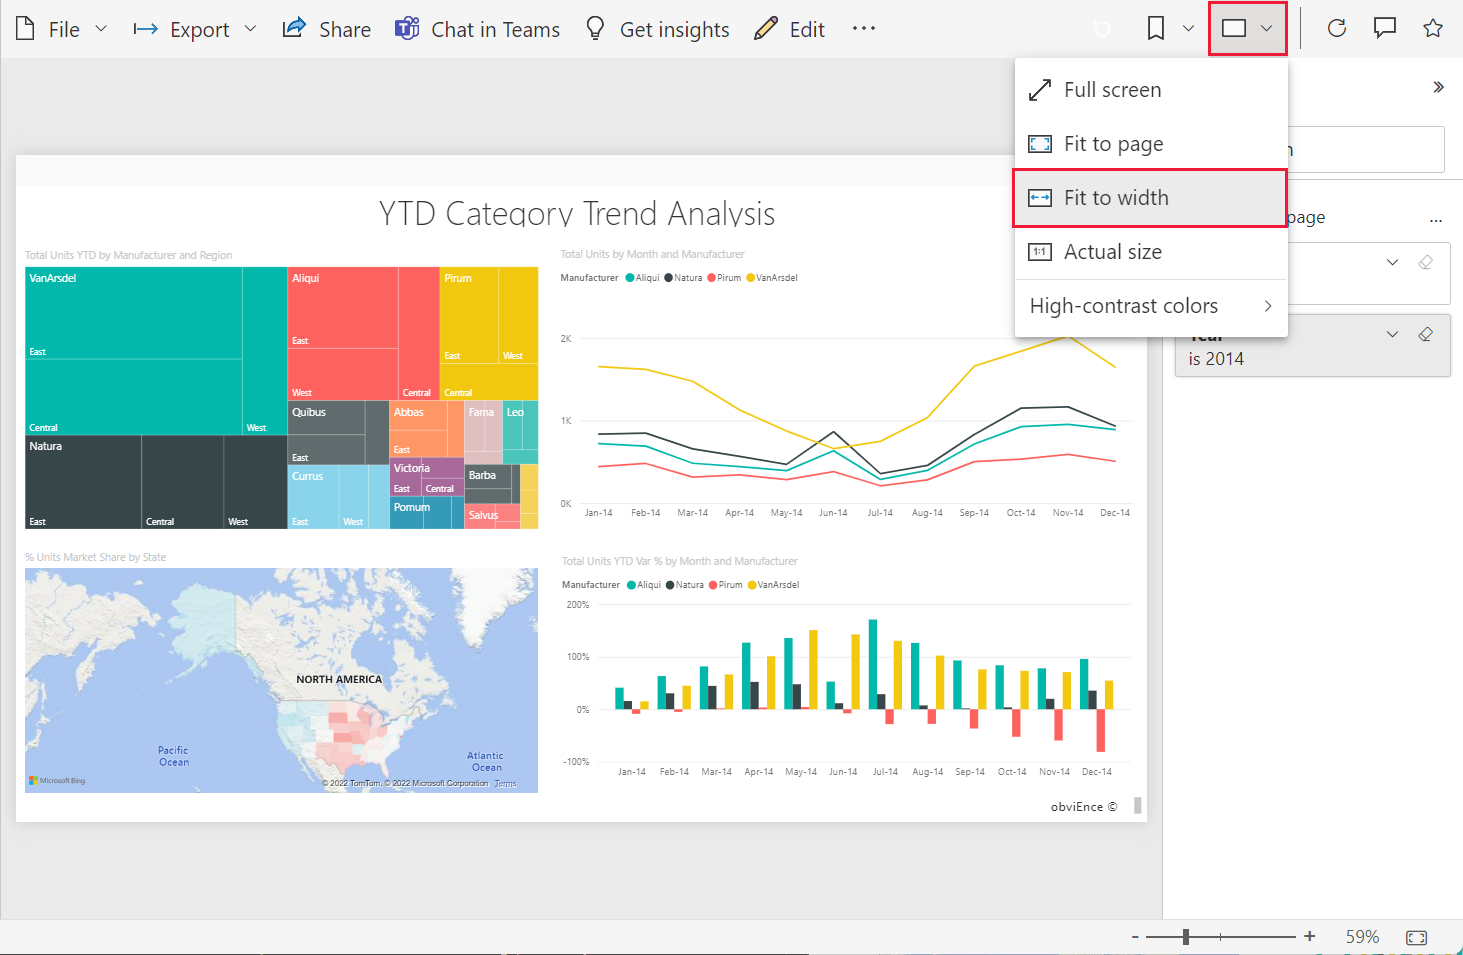
Change the size and display of your report. To adjust the report display size, use the slider in the bottom right. To select display options from a menu, open the View menu and choose a display option. Your choices are Full screen, Actual size, Fit to page, and Fit to width. Notice the difference that each display options makes.
There are many ways for you to interact with a report to discover insights and make business decisions. Other articles about Power BI reports are available from the Power BI Learn table of contents.
Open a report that's part of an app
The apps you receive from colleagues are located on the Home page and in the Apps container on your navigation pane. An app is a collection of dashboards and reports that a Power BI designer compiles for you.
You must have a Power BI Pro license to open an app unless the app workspace is stored in Premium capacity. A user with any Power BI license can have access to reports stored in Premium capacity.
Follow along with Microsoft sample content.
In your browser, go to appsource.microsoft.com.
Search for "Sales & Marketing" and select Microsoft sample - Sales & Marketing.
Select Get it now > Continue > Install to install the app in your Apps container.
Go back to Home by selecting Home from the navigation pane.
Scroll down and select My Apps.
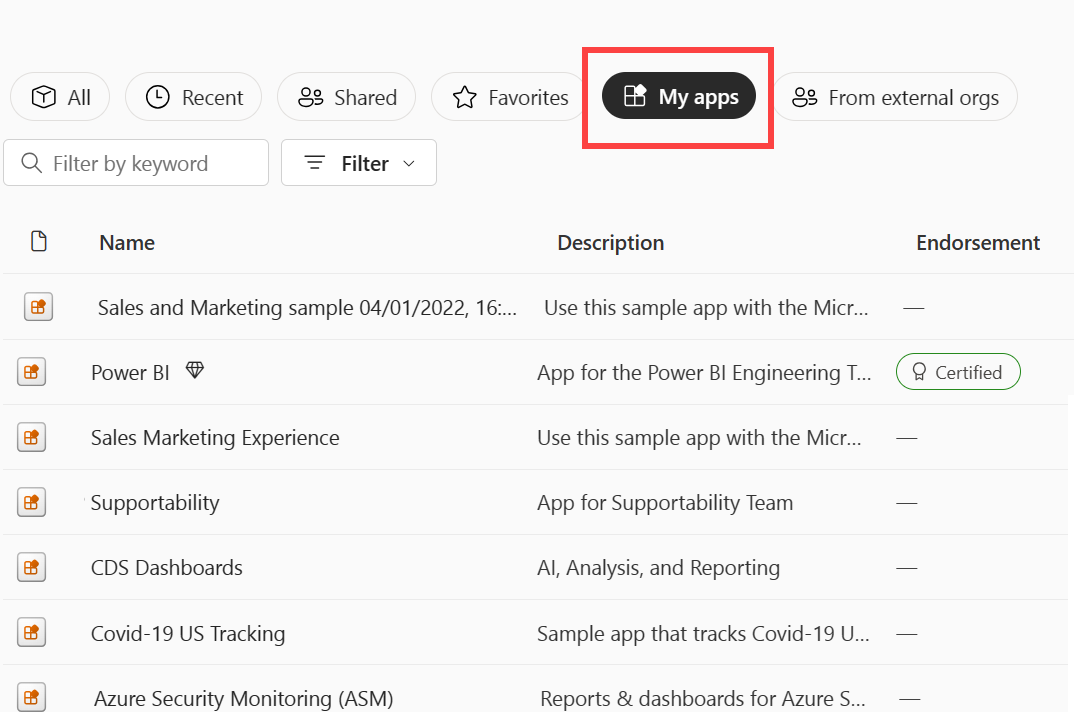
Select your new Sales and Marketing app to open it. Depending on the options set by the app designer, the app opens to a dashboard or a report. This app opens to a dashboard.
Open a report from a dashboard
Most dashboard tiles are pinned from reports. Selecting a tile opens the report that was used to create the tile.
To open an underlying report, select a tile from a dashboard. From the Sales and Marketing dashboard, we select the Total Units YTD Variance % column chart tile.
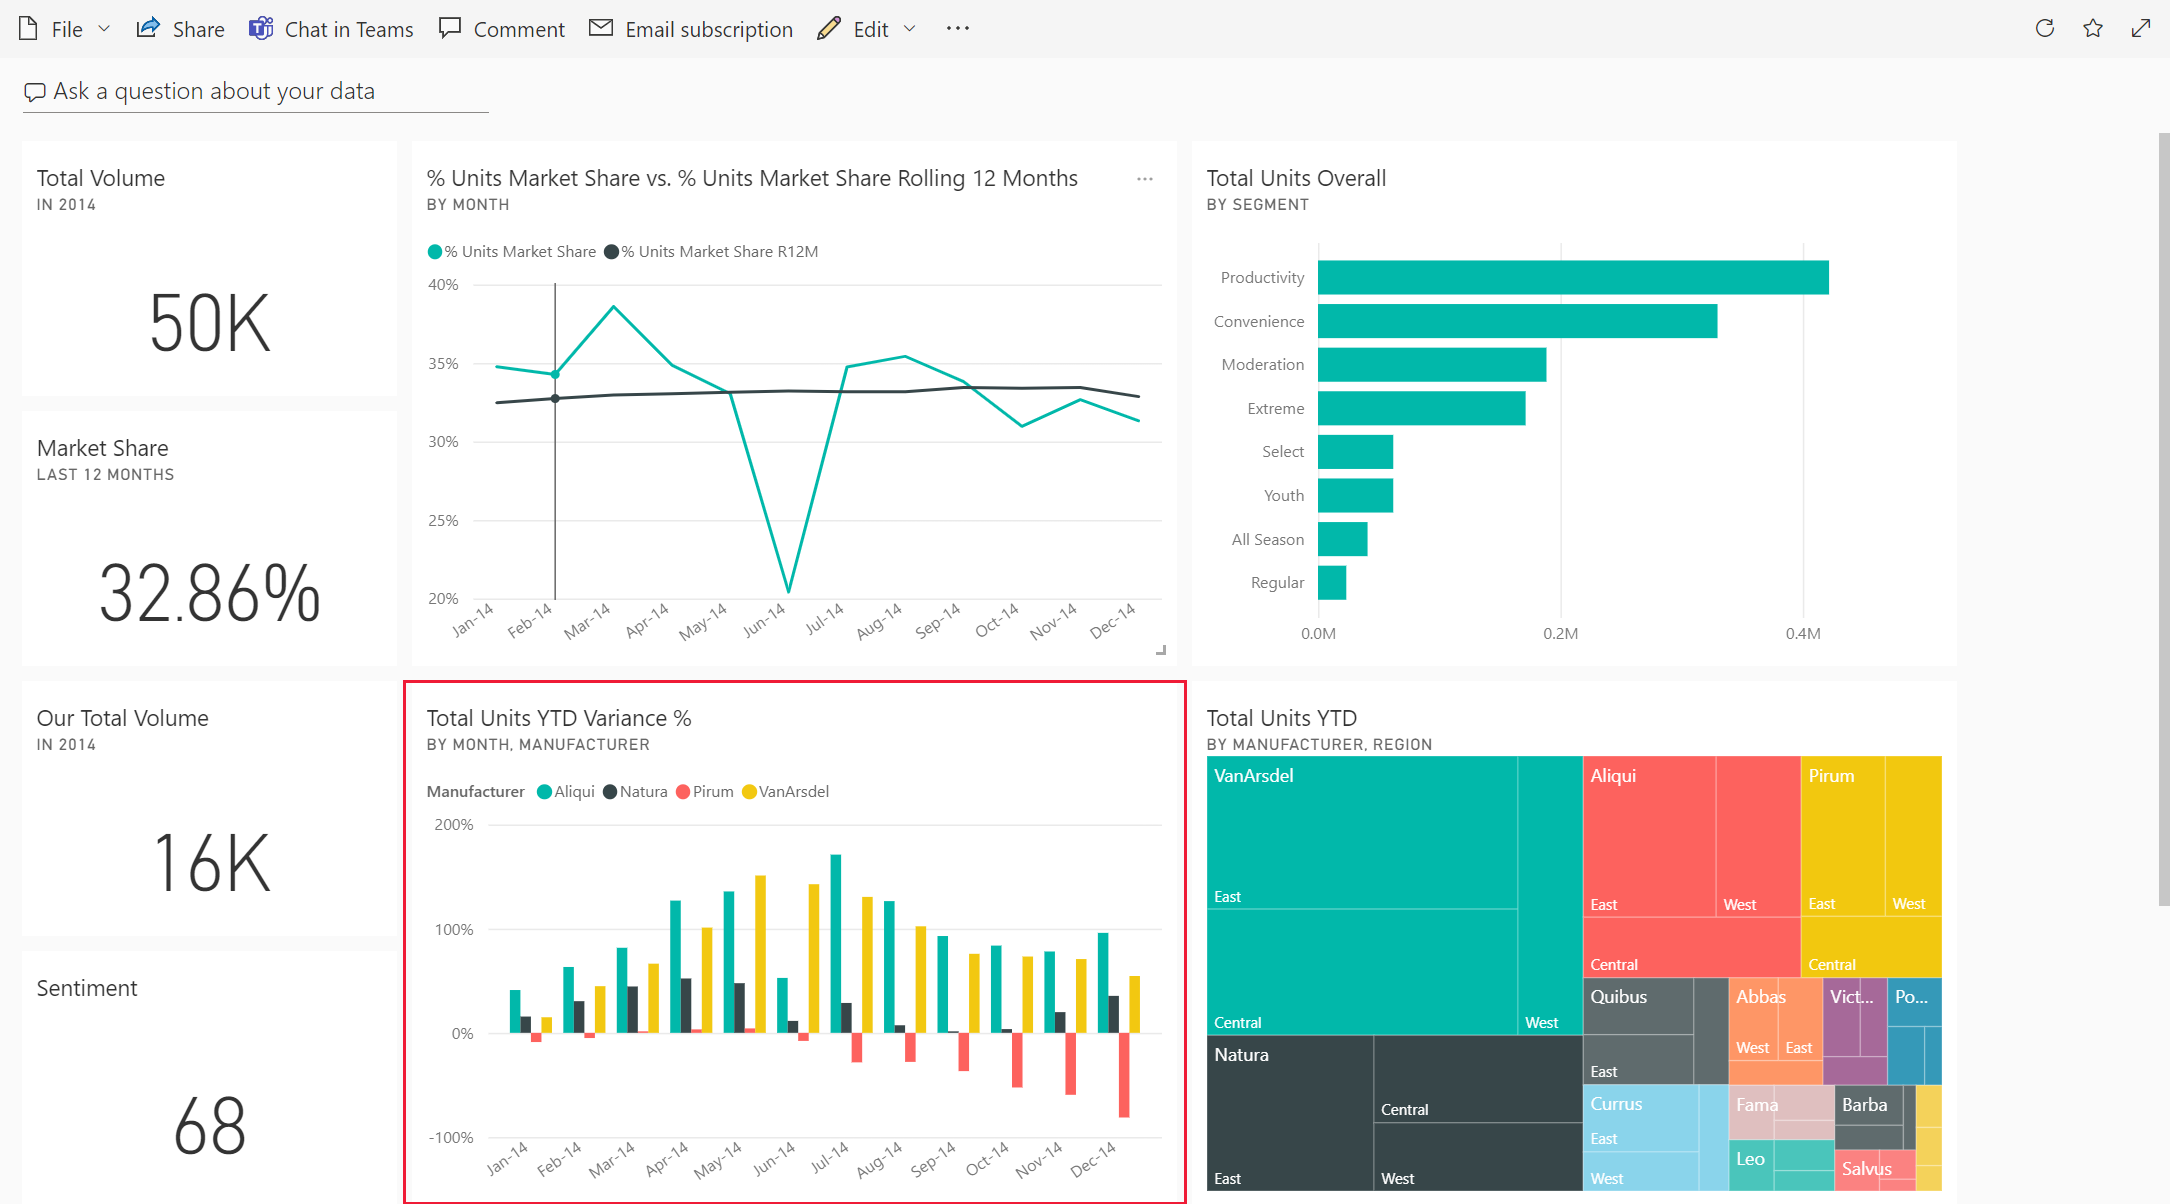
The associated report opens to the YTD Category Trend Analysis page. This is the source page for the column chart tile.
Note
Not all tiles lead to a report. If you select a tile that was created with Q&A, the Q&A screen opens. If you select a tile that was created using the dashboard Add tile widget, a video, website, or other content might open.
More ways to open a report
As you get more comfortable navigating the Power BI service, you figure out workflows that are best for you. A few other ways to access reports:
- Using the related content pane.
- In an email, when someone shares with you or you set an alert or you create or receive a subscription.
- From your Notification center
- From a workspace