Note
Access to this page requires authorization. You can try signing in or changing directories.
Access to this page requires authorization. You can try changing directories.
APPLIES TO: ![]() Power BI service for business users
Power BI service for business users ![]() Power BI service for designers & developers
Power BI service for designers & developers ![]() Power BI Desktop
Power BI Desktop ![]() Requires Pro or Premium license
Requires Pro or Premium license
Use this tutorial to set alerts in the Power BI service to notify you when data on a dashboard changes above or below limits you set. Alerts can be set on tiles pinned from report visuals or from Power BI Q&A. Alerts can be set only on gauges, KPIs, and cards. When you set an alert, the only person who sees those alerts is you.

Alerts only work on data that is refreshed. When data refreshes, Power BI looks to see if an alert is set for that data. If the data reaches an alert threshold, an alert is triggered.
This tutorial covers the following.
- Who can set dashboard alerts
- Which visuals support alerts
- Who can see my alerts
- Do alerts work on Power BI Desktop and mobile
- How to create an alert
- Where will I receive my alerts
Prerequisites
- A Power BI license. To sign in to Power BI, sign up for a free trial before you begin.
- Access to a dashboard with one of the following types of tile: gauge, KPI, or card.
- A semantic model that refreshes.
Who can set alerts
Alerts can be created in the Power BI service by customers with any license type. Set alerts on dashboard tiles:
- created in My workspace.
- shared with you in a Premium reserved capacity.
- saved in any workspace you can access, if you have a Power BI Pro or Premium Per User (PPU) license.
Who can see alerts I create?
Only you can see the alerts you set, even if you share your dashboard. Data alerts are fully synchronized across platforms; set and view data alerts in the Power BI service, in the Power BI mobile apps, and in Power BI for Teams.
Warning
These alerts provide information about your data. If you view your Power BI data on a mobile device and that device gets stolen, we recommend using the Power BI service to turn off all alerts.
Add an alert to a dashboard tile
Alerts can be set on three types of tiles (gauges, KPIs, and cards) on a Power BI dashboard. This tutorial uses the Sales and Marketing sample. To follow along, open the sample from the left nav pane Learn tab. Open the Market share report page and pin the % Units Market Share card to a dashboard.
From a dashboard gauge, KPI, or card tile, select the ellipses (...).
Select the alert icon,
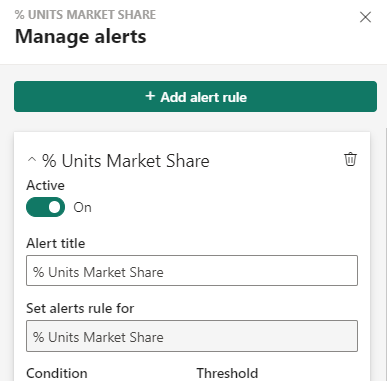
 or Manage alerts, to add one or more alerts for the Market share card.
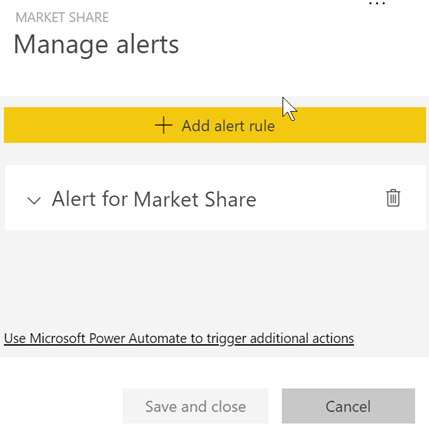
On the Manage alerts pane, select + Add alert rule. Ensure the slider is set to On, and give your alert a title. Titles help you easily recognize your alerts.
Scroll down and enter the alert details. In this example, we create an alert that notifies us once a day if our market share increases to 40% (.4) or higher. We opt to have Power BI send us an email when an alert is triggered. Triggered alerts also appear in our Notification center.
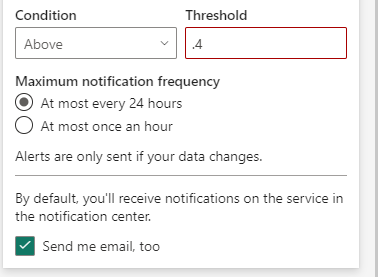
Select Save and close.
Receiving alerts
When the data being tracked reaches one of the thresholds you set, several things happen. First, Power BI checks to see if more than an hour has passed, or more than 24 hours (depending on the option you selected), since the last alert was sent. As long as the data is past the threshold, you get an alert.
Next, Power BI sends an alert to your Notification center and, optionally, in email. Each alert contains a direct link to your data. Select the link to see the relevant tile.
When you set the alert to send you an email, you find something like this in your Inbox. This email is from an alert we set for the Sentiment card.
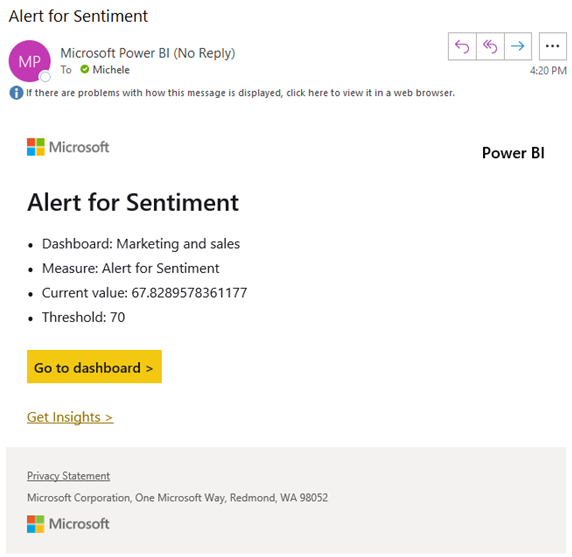
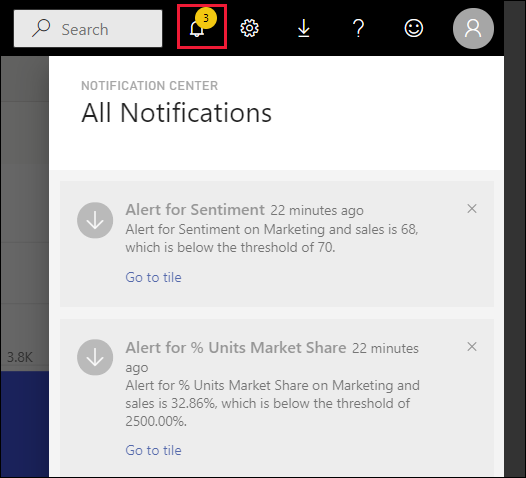
Power BI also adds a message to your Notification center.

Open your Notification center to see the alert details.
Managing alerts
There are many ways to manage your alerts: from the dashboard tile itself, from the Power BI Settings menu, on an individual tile in the Power BI mobile app on the iPhone, or in the Power BI mobile app for Windows 10.
From the tile itself
If you need to change or remove an alert for a tile, reopen the Manage alerts window. All the alerts that you set for that tile are displayed.
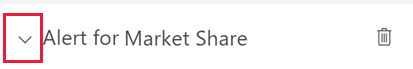
To modify an alert, select the arrow to the left of the alert name.
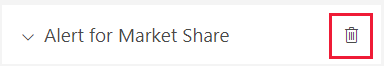
To delete an alert, select the trashcan to the right of the alert name.
From the Power BI settings menu
Select the gear icon from the Power BI menubar.
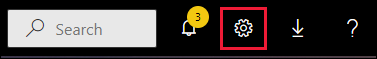
Under Settings select Notifications > Power BI Alerts.
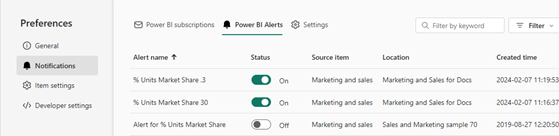
From here you can turn alerts on and off, open the Manage alerts window to make changes, or delete the alert.
Considerations and limitations
- If you're unable to set an alert for a gauge, KPI, or card, contact your Power BI admin or IT help desk for help. Sometimes alerts are turned off or unavailable for your dashboard or for specific types of dashboard tiles.
- Alerts only work on data that is refreshed. They don't work on static data. Most of the samples supplied by Microsoft are static.
- The ability to receive and view shared content requires a few conditions to be met. Those conditions are that you have a Power BI Pro license, a Premium Per User license, or the report is saved in Premium reserved capacity. For more information, read Which license do I have?.
- Alerts can be set on visuals created from streaming datasets that are pinned from a report to a dashboard. Alerts can't be set on streaming tiles created directly on the dashboard using Add tile > Custom streaming data.
Clean up resources
Delete the alerts you created in this tutorial. Select the gear icon from the Power BI menubar. Under Settings select Notifications > Power BI Alerts and delete the alert.