シンボル レイヤーを追加する (Android SDK)
この記事では、Azure Maps Android SDK を使用して、マップ上にデータ ソースからのポイント データをシンボル レイヤーとしてレンダリングする方法を示します。 シンボル レイヤーは、ポイントを画像とテキストとしてマップ上にレンダリングします。
Note
Azure Maps Android SDK の廃止
Android 用 Azure Maps Native SDK は非推奨となり、2025 年 3 月 31 日に廃止されます。 サービスの中断を回避するには、2025 年 3 月 31 日までに Azure Maps Web SDK に移行します。 詳細については、「Azure Maps Android SDK 移行ガイド」を参照してください。
ヒント
シンボル レイヤーでは、既定ではデータ ソース内のすべてのジオメトリの座標がレンダリングされます。 ポイント ジオメトリ フィーチャーのみがレンダリングされるようにレイヤーを制限するには、レイヤーの filter オプションを eq(geometryType(), "Point") に設定します。 MultiPoint フィーチャーも含める場合は、レイヤーの filter オプションを any(eq(geometryType(), "Point"), eq(geometryType(), "MultiPoint")) に設定します。
前提条件
クイックスタート: Android アプリの作成に関する記事の手順を必ず完了してください。 この記事のコード ブロックは、マップ onReady イベント ハンドラーに挿入できます。
シンボル レイヤーを追加する
マップにシンボル レイヤーを追加する前に、いくつかの手順を行う必要があります。 まず、データ ソースを作成してマップに追加します。 シンボル レイヤーを追加します。 次に、データ ソースからデータを取得するために、データ ソースをシンボル レイヤーに渡します。 最後に、データをデータ ソースに追加して、レンダリングするものが存在するようにします。
次のコードは、マップが読み込まれた後に、そこに追加する必要がある内容を示しています。 このサンプルでは、シンボル レイヤーを使用してマップ上に 1 つのポイントがレンダリングされます。
//Create a data source and add it to the map.
DataSource source = new DataSource();
map.sources.add(source);

//Create a point and add it to the data source.
source.add(Point.fromLngLat(0, 0));

//Create a symbol layer to render icons and/or text at points on the map.
SymbolLayer layer = new SymbolLayer(source);

//Add the layer to the map.
map.layers.add(layer);
//Create a data source and add it to the map.
val source = DataSource()
map.sources.add(source)

//Create a point and add it to the data source.
source.add(Point.fromLngLat(0, 0))

//Create a symbol layer to render icons and/or text at points on the map.
val layer = SymbolLayer(source)

//Add the layer to the map.
map.layers.add(layer)
マップに追加できるポイント データには、次の 3 種類があります。
- GeoJSON Point ジオメトリ - このオブジェクトには、ポイントの座標だけが含まれ、それ以外は含まれません。
Point.fromLngLat静的メソッドを使用すると、これらのオブジェクトを簡単に作成できます。 - GeoJSON MultiPoint ジオメトリ - このオブジェクトには、複数のポイントの座標が含まれ、それ以外は含まれません。 ポイントの配列を
MultiPointクラスに渡して、これらのオブジェクトを作成します。 - GeoJSON 機能 - このオブジェクトは、すべての GeoJSON ジオメトリと、ジオメトリに関連するメタデータを含むプロパティのセットで構成されます。
データの作成とマップへの追加の詳細については、「データ ソースを作成する」のドキュメントをご覧ください。
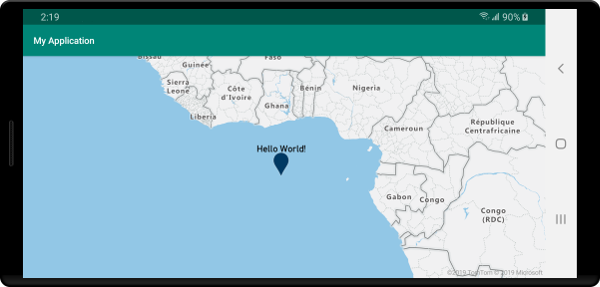
次のコード サンプルは、GeoJSON Point ジオメトリを作成して GeoJSON フィーチャーに渡し、title 値をそのプロパティに追加させます。 title プロパティは、マップ上のシンボル アイコンの上にテキストとして表示されます。
//Create a data source and add it to the map.
DataSource source = new DataSource();
map.sources.add(source);

//Create a point feature.
Feature feature = Feature.fromGeometry(Point.fromLngLat(0, 0));

//Add a property to the feature.
feature.addStringProperty("title", "Hello World!");

//Add the feature to the data source.
source.add(feature);

//Create a symbol layer to render icons and/or text at points on the map.
SymbolLayer layer = new SymbolLayer(source,
    //Get the title property of the feature and display it on the map.
    textField(get("title"))
);

//Add the layer to the map.
map.layers.add(layer);
//Create a data source and add it to the map.
val source = DataSource()
map.sources.add(source)

//Create a point feature.
val feature = Feature.fromGeometry(Point.fromLngLat(0, 0))

//Add a property to the feature.
feature.addStringProperty("title", "Hello World!")

//Add the feature to the data source.
source.add(feature)

//Create a symbol layer to render icons and/or text at points on the map.
val layer = SymbolLayer(
    source,  //Get the title property of the feature and display it on the map.
    textField(get("title"))
)

//Add the layer to the map.
map.layers.add(layer)
次のスクリーンショットでは、上記のコードにより、シンボル レイヤーでアイコンとテキスト ラベルを使ってポイント フィーチャーがレンダリングされた状態を示しています。
ヒント
既定では、重なっているシンボルがシンボル レイヤーによって非表示になることで、シンボルのレンダリングが最適化されます。 拡大すると、非表示のシンボルが表示されるようになります。 この機能を無効にして、すべてのシンボルを常にレンダリングするには、iconAllowOverlap および textAllowOverlap オプションを true に設定します。
シンボル レイヤーにカスタム アイコンを追加する
シンボル レイヤーは WebGL を使用してレンダリングされます。 このため、アイコンの画像などのすべてのリソースを WebGL コンテキストに読み込む必要があります。 このサンプルでは、マップ リソースにカスタム アイコンを追加する方法を示します。 このアイコンを使用して、ポイント データをカスタム シンボルでマップ上にレンダリングします。 シンボル レイヤーの textField プロパティに式を指定する必要があります。 ここでは、気温プロパティをレンダリングします。 気温は数値であるため、文字列に変換する必要があります。 加えて、そこに "°F" を追加したいと思います。 concat(Expression.toString(get("temperature")), literal("°F")) という式を使えば、この連結を実行できます。
//Load a custom icon image into the image sprite of the map.
map.images.add("my-custom-icon", R.drawable.showers);

//Create a data source and add it to the map.
DataSource source = new DataSource();
map.sources.add(source);

//Create a point feature.
Feature feature = Feature.fromGeometry(Point.fromLngLat(-73.985708, 40.75773));

//Add a property to the feature.
feature.addNumberProperty("temperature", 64);

//Add the feature to the data source.
source.add(feature);

//Create a symbol layer to render icons and/or text at points on the map.
SymbolLayer layer = new SymbolLayer(source,
    iconImage("my-custom-icon"),
    iconSize(0.5f),

    //Get the title property of the feature and display it on the map.
    textField(concat(Expression.toString(get("temperature")), literal("°F"))),
    textOffset(new Float[]{0f, -1.5f})
);
//Load a custom icon image into the image sprite of the map.
map.images.add("my-custom-icon", R.drawable.showers)

//Create a data source and add it to the map.
val source = DataSource()
map.sources.add(source)

//Create a point feature.
val feature = Feature.fromGeometry(Point.fromLngLat(-73.985708, 40.75773))

//Add a property to the feature.
feature.addNumberProperty("temperature", 64)

//Add the feature to the data source.
source.add(feature)

//Create a symbol layer to render icons and/or text at points on the map.
val layer = SymbolLayer(
    source,
    iconImage("my-custom-icon"),
    iconSize(0.5f),  //Get the title property of the feature and display it on the map.
    textField(concat(Expression.toString(get("temperature")), literal("°F"))),
    textOffset(arrayOf(0f, -1.5f))
)
このサンプルでは、次の画像がアプリのドローアブル フォルダーに読み込まれます。
 |
|---|
| showers.png |
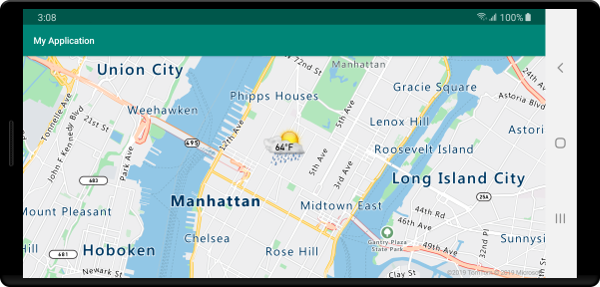
次のスクリーンショットでは、上記のコードにより、シンボル レイヤーでカスタム アイコンと書式設定されたテキスト ラベルを使ってポイント フィーチャーがレンダリングされた状態を示しています。
ヒント
シンボル レイヤーを使用してテキストをレンダリングするだけの場合は、アイコンのオプションの iconImage プロパティを "none" に設定することでアイコンを非表示にすることができます。
シンボルの色を変更する
Azure Maps Android SDK には、既定のマーカー アイコンの定義済みの色のバリエーション セットが付属しています。 たとえば、marker-red をシンボル レイヤーの iconImage オプションに渡して、そのレイヤーにマーカー アイコンの赤色のバージョンを表示することができます。
SymbolLayer layer = new SymbolLayer(source,
    iconImage("marker-red")
);
val layer = SymbolLayer(source,
    iconImage("marker-red")
)
次の表は、使用可能なすべての組み込みのアイコン画像名を示しています。 これらのマーカーは、オーバーライドできる色リソースから色をプルします。 ただし、これらのマーカーのいずれかの色をオーバーライドすると、そのアイコン画像を使用するすべてのレイヤーに適用されます。
| アイコン画像名 | 色リソース名 |
|---|---|
marker-default |
azure_maps_marker_default |
marker-black |
azure_maps_marker_black |
marker-blue |
azure_maps_marker_blue |
marker-darkblue |
azure_maps_marker_darkblue |
marker-red |
azure_maps_marker_red |
marker-yellow |
azure_maps_marker_yellow |
また、azure_maps_marker_border 色リソース名を使用して、すべてのマーカーの境界線の色をオーバーライドすることもできます。 これらのマーカーの色は、アプリの colors.xml ファイルに同じ名前の色を追加することでオーバーライドできます。 たとえば、次の colors.xml ファイルの場合、既定のマーカーの色が明るい緑になります。
<?xml version="1.0" encoding="utf-8"?>
<resources>
    <color name="azure_maps_marker_default">#00FF00</color>
</resources>
次のコードは、既定のマーカーのカスタム バージョンを作成するために変更できる既定のマーカー ベクター XML の変更後のバージョンです。 変更したバージョンを、アプリの drawable フォルダーに追加したり、map.images.add を使用してマップ イメージ スプライトに追加したりして、シンボル レイヤーで使うことができます。
<vector xmlns:android="http://schemas.android.com/apk/res/android"
    android:width="24.5dp"
    android:height="36.5dp"
    android:viewportWidth="24.5"
    android:viewportHeight="36.5">
    <path
        android:pathData="M12.25,0.25a12.2543,12.2543 0,0 0,-12 12.4937c0,6.4436 6.4879,12.1093 11.059,22.5641 0.5493,1.2563 1.3327,1.2563 1.882,0C17.7621,24.8529 24.25,19.1857 24.25,12.7437A12.2543,12.2543 0,0 0,12.25 0.25Z"
        android:strokeWidth="0.5"
        android:fillColor="@color/azure_maps_marker_default"
        android:strokeColor="@color/azure_maps_marker_border"/>
</vector>
次のステップ
マップに追加できる他のコード サンプルについては、次の記事をご覧ください。