Monitor Azure IoT Hub
This article describes:
- The types of monitoring data you can collect for this service.
- Ways to analyze that data.
Note
If you're already familiar with this service and/or Azure Monitor and just want to know how to analyze monitoring data, see the Analyze section near the end of this article.
When you have critical applications and business processes that rely on Azure resources, you need to monitor and get alerts for your system. The Azure Monitor service collects and aggregates metrics and logs from every component of your system. Azure Monitor provides you with a view of availability, performance, and resilience, and notifies you of issues. You can use the Azure portal, PowerShell, Azure CLI, REST API, or client libraries to set up and view monitoring data.
- For more information on Azure Monitor, see the Azure Monitor overview.
- For more information on how to monitor Azure resources in general, see Monitor Azure resources with Azure Monitor.
Monitor per-device disconnects with Event Grid
Azure Monitor provides a metric called Connected devices that you can use to monitor the number of devices connected to your IoT Hub. This metric triggers an alert when the number of connected devices drops below a threshold value. Azure Monitor also emits events in the connections category that you can use to monitor device connects, disconnects, and connection errors. While these events might be sufficient for some scenarios, Azure Event Grid provides a low-latency, per-device monitoring solution that you can use to track device connections for critical devices and infrastructure.
With Event Grid, you can subscribe to the IoT Hub DeviceConnected and DeviceDisconnected events to trigger alerts and monitor device connection state. Event Grid provides a much lower event latency than Azure Monitor, so you can monitor on a per-device basis rather than for all connected devices. These factors make Event Grid the preferred method for monitoring connections for critical devices and infrastructure. We highly recommend using Event Grid to monitor device connections in production environments.
For more information about monitoring device connectivity with Event Grid and Azure Monitor, see Monitor, diagnose, and troubleshoot device connectivity to Azure IoT Hub.
Resource types
Azure uses the concept of resource types and IDs to identify everything in a subscription. Resource types are also part of the resource IDs for every resource running in Azure. For example, one resource type for a virtual machine is Microsoft.Compute/virtualMachines. For a list of services and their associated resource types, see Resource providers.
Azure Monitor similarly organizes core monitoring data into metrics and logs based on resource types, also called namespaces. Different metrics and logs are available for different resource types. Your service might be associated with more than one resource type.
For more information about the resource types for IoT Hub, see Azure IoT Hub monitoring data reference.
Data storage
For Azure Monitor:
- Metrics data is stored in the Azure Monitor metrics database.
- Log data is stored in the Azure Monitor logs store. Log Analytics is a tool in the Azure portal that can query this store.
- The Azure activity log is a separate store with its own interface in the Azure portal.
You can optionally route metric and activity log data to the Azure Monitor logs store. You can then use Log Analytics to query the data and correlate it with other log data.
Many services can use diagnostic settings to send metric and log data to other storage locations outside Azure Monitor. Examples include Azure Storage, hosted partner systems, and non-Azure partner systems, by using Event Hubs.
For detailed information on how Azure Monitor stores data, see Azure Monitor data platform.
Collection and routing
Platform metrics, the Activity log, and resource logs have unique collection, storage, and routing specifications.
In the Azure portal from your IoT hub under Monitoring, you can select Diagnostic settings followed by Add diagnostic setting to create diagnostic settings scoped to the logs and platform metrics emitted by your IoT hub.
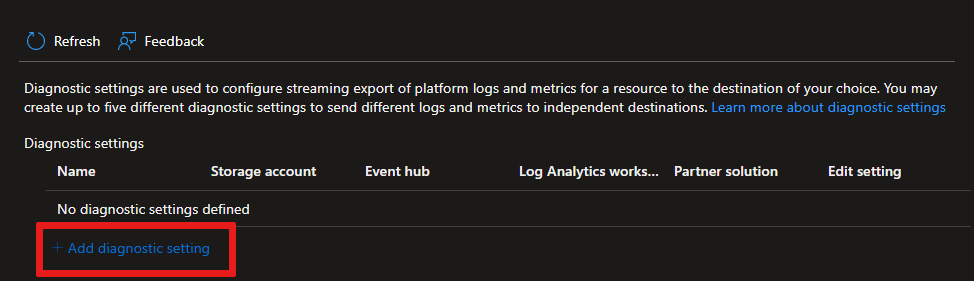
The following screenshot shows a diagnostic setting for routing the resource log type Connection Operations and all platform metrics to a Log Analytics workspace.

When routing IoT Hub platform metrics to other locations:
These platform metrics aren't exportable by using diagnostic settings: Connected devices and Total devices.
Multi-dimensional metrics, for example some routing metrics, are currently exported as flattened single dimensional metrics aggregated across dimension values. For more information, see Exporting platform metrics to other locations.
Azure Monitor platform metrics
Azure Monitor provides platform metrics for most services. These metrics are:
- Individually defined for each namespace.
- Stored in the Azure Monitor time-series metrics database.
- Lightweight and capable of supporting near real-time alerting.
- Used to track the performance of a resource over time.
Collection: Azure Monitor collects platform metrics automatically. No configuration is required.
Routing: You can also usually route platform metrics to Azure Monitor Logs / Log Analytics so you can query them with other log data. For more information, see the Metrics diagnostic setting. For how to configure diagnostic settings for a service, see Create diagnostic settings in Azure Monitor.
For a list of all metrics it's possible to gather for all resources in Azure Monitor, see Supported metrics in Azure Monitor.
Monitor overview
The Overview page in the Azure portal for each IoT hub includes charts that provide some usage metrics, such as the number of messages used and the number of devices connected to the IoT hub.
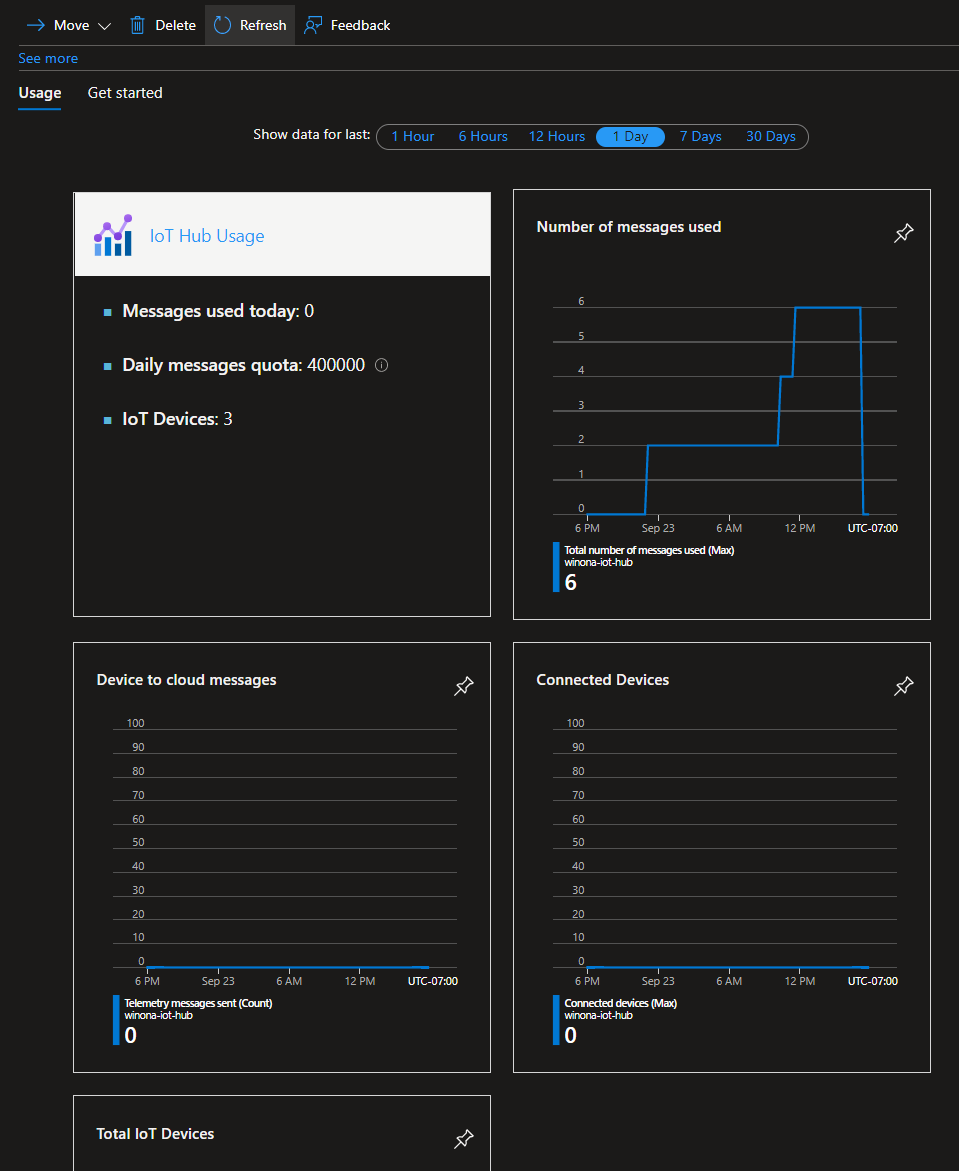
A correct message count value might be delayed by 1 minute. Due to the IoT Hub service infrastructure, the value can sometimes bounce between higher and lower values on refresh. This counter should be incorrect only for values accrued over the last minute.
The information presented on the Overview pane is useful, but represents only a small amount of monitoring data that's available for an IoT hub. Some monitoring data is collected automatically and available for analysis as soon as you create your IoT hub. You can enable other types of data collection with some configuration.
Important
The events emitted by the IoT Hub service using Azure Monitor resource logs aren't guaranteed to be reliable or ordered. Some events might be lost or delivered out of order. Resource logs aren't intended to be real-time, so it may take several minutes for events to be logged to your choice of destination.
Azure Monitor resource logs
Resource logs provide insight into operations that were done by an Azure resource. Logs are generated automatically, but you must route them to Azure Monitor logs to save or query them. Logs are organized in categories. A given namespace might have multiple resource log categories.
Collection: Resource logs aren't collected and stored until you create a diagnostic setting and route the logs to one or more locations. When you create a diagnostic setting, you specify which categories of logs to collect. There are multiple ways to create and maintain diagnostic settings, including the Azure portal, programmatically, and though Azure Policy.
Routing: The suggested default is to route resource logs to Azure Monitor Logs so you can query them with other log data. Other locations such as Azure Storage, Azure Event Hubs, and certain Microsoft monitoring partners are also available. For more information, see Azure resource logs and Resource log destinations.
For detailed information about collecting, storing, and routing resource logs, see Diagnostic settings in Azure Monitor.
For a list of all available resource log categories in Azure Monitor, see Supported resource logs in Azure Monitor.
All resource logs in Azure Monitor have the same header fields, followed by service-specific fields. The common schema is outlined in Azure Monitor resource log schema.
Route connection events to logs
IoT hub continuously emits resource logs for several categories of operations. To collect this log data, though, you need to create a diagnostic setting to route it to a destination where it can be analyzed or archived. One such destination is Azure Monitor Logs via a Log Analytics workspace (see pricing), where you can analyze the data using Kusto queries.
The IoT Hub resource logs connections category emits operations and errors having to do with device connections. The following screenshot shows a diagnostic setting to route these logs to a Log Analytics workspace:

We recommend creating a diagnostic setting as early as possible after you create your IoT hub, because, although IoT Hub always emits resource logs, Azure Monitor doesn't collect them until you route them to a destination.
To learn more about routing logs to a destination, see Collection and routing. For detailed instructions to create a diagnostic setting, see the Use metrics and logs tutorial.
Azure activity log
The activity log contains subscription-level events that track operations for each Azure resource as seen from outside that resource; for example, creating a new resource or starting a virtual machine.
Collection: Activity log events are automatically generated and collected in a separate store for viewing in the Azure portal.
Routing: You can send activity log data to Azure Monitor Logs so you can analyze it alongside other log data. Other locations such as Azure Storage, Azure Event Hubs, and certain Microsoft monitoring partners are also available. For more information on how to route the activity log, see Overview of the Azure activity log.
Analyzing logs
Data in Azure Monitor Logs is stored in tables where each table has its own set of unique properties. The data in these tables are associated with a Log Analytics workspace and can be queried in Log Analytics. To learn more about Azure Monitor Logs, see Azure Monitor Logs overview in the Azure Monitor documentation.
To route data to Azure Monitor Logs, you must create a diagnostic setting to send resource logs or platform metrics to a Log Analytics workspace. To learn more, see Collection and routing.
To perform Log Analytics, go to the Azure portal and open your IoT hub, then select Logs under Monitoring. These Log Analytics queries are scoped, by default, to the logs and metrics collected in Azure Monitor Logs for your IoT hub.

When routing IoT Hub platform metrics to Azure Monitor Logs:
The following platform metrics aren't exportable by using diagnostic settings: Connected devices and Total devices.
Multi-dimensional metrics, for example some routing metrics, are currently exported as flattened single dimensional metrics aggregated across dimension values. For more detail, see Exporting platform metrics to other locations.
For common queries with IoT Hub, see Sample Kusto queries. For more information on using Log Analytics queries, see Overview of log queries in Azure Monitor.
SDK version in IoT Hub logs
Some operations return an sdkVersion property in their properties object for the IoT Hub resource logs. For these operations, when a device or backend app is using one of the Azure IoT SDKs, this property contains information about the SDK being used, the SDK version, and the platform on which the SDK is running.
The following examples show the sdkVersion property emitted for a deviceConnect operation using:
- The Node.js device SDK:
"azure-iot-device/1.17.1 (node v10.16.0; Windows_NT 10.0.18363; x64)" - The .NET (C#) SDK:
".NET/1.21.2 (.NET Framework 4.8.4200.0; Microsoft Windows 10.0.17763 WindowsProduct:0x00000004; X86)".
The following table shows the SDK name used for different Azure IoT SDKs:
| SDK name in sdkVersion property | Language |
|---|---|
| .NET | .NET (C#) |
| microsoft.azure.devices | .NET (C#) service SDK |
| microsoft.azure.devices.client | .NET (C#) device SDK |
| iothubclient | C or Python v1 (deprecated) device SDK |
| iothubserviceclient | C or Python v1 (deprecated) service SDK |
| azure-iot-device-iothub-py | Python device SDK |
| azure-iot-device | Node.js device SDK |
| azure-iothub | Node.js service SDK |
| com.microsoft.azure.iothub-java-client | Java device SDK |
| com.microsoft.azure.iothub.service.sdk | Java service SDK |
| com.microsoft.azure.sdk.iot.iot-device-client | Java device SDK |
| com.microsoft.azure.sdk.iot.iot-service-client | Java service SDK |
| C | Embedded C |
| C + (OSSimplified = Eclipse ThreadX) | Eclipse ThreadX |
You can extract the SDK version property when you perform queries against IoT Hub resource logs. For example, the following query extracts the SDK version property (and device ID) from the properties returned by Connections operations. These two properties are written to the results along with the time of the operation and the resource ID of the IoT hub that the device is connecting to.
// SDK version of devices
// List of devices and their SDK versions that connect to IoT Hub
AzureDiagnostics
| where ResourceProvider == "MICROSOFT.DEVICES" and ResourceType == "IOTHUBS"
| where Category == "Connections"
| extend parsed_json = parse_json(properties_s)
| extend SDKVersion = tostring(parsed_json.sdkVersion) , DeviceId = tostring(parsed_json.deviceId)
| distinct DeviceId, SDKVersion, TimeGenerated, _ResourceId
Read logs from Azure Event Hubs
After you set up event logging through diagnostics settings, you can create applications that read out the logs so that you can take action based on the information in them. The following sample code retrieves logs from an event hub.
class Program
{
    static string connectionString = "{your AMS eventhub endpoint connection string}";
    static string monitoringEndpointName = "{your AMS event hub endpoint name}";
    static EventHubClient eventHubClient;
    //This is the Diagnostic Settings schema
    class AzureMonitorDiagnosticLog
    {
        string time { get; set; }
        string resourceId { get; set; }
        string operationName { get; set; }
        string category { get; set; }
        string level { get; set; }
        string resultType { get; set; }
        string resultDescription { get; set; }
        string durationMs { get; set; }
        string callerIpAddress { get; set; }
        string correlationId { get; set; }
        string identity { get; set; }
        string location { get; set; }
        Dictionary<string, string> properties { get; set; }
    };

    static void Main(string[] args)
    {
        Console.WriteLine("Monitoring. Press Enter key to exit.\n");
        eventHubClient = EventHubClient.CreateFromConnectionString(connectionString, monitoringEndpointName);
        var d2cPartitions = eventHubClient.GetRuntimeInformationAsync().PartitionIds;
        CancellationTokenSource cts = new CancellationTokenSource();
        var tasks = new List<Task>();
        foreach (string partition in d2cPartitions)
        {
            tasks.Add(ReceiveMessagesFromDeviceAsync(partition, cts.Token));
        }
        Console.ReadLine();
        Console.WriteLine("Exiting...");
        cts.Cancel();
        Task.WaitAll(tasks.ToArray());
    }

    private static async Task ReceiveMessagesFromDeviceAsync(string partition, CancellationToken ct)
    {
        var eventHubReceiver = eventHubClient.GetDefaultConsumerGroup().CreateReceiver(partition, DateTime.UtcNow);
        while (true)
        {
            if (ct.IsCancellationRequested)
            {
                await eventHubReceiver.CloseAsync();
                break;
            }
            EventData eventData = await eventHubReceiver.ReceiveAsync(new TimeSpan(0,0,10));
            if (eventData != null)
            {
                string data = Encoding.UTF8.GetString(eventData.GetBytes());
                Console.WriteLine("Message received. Partition: {0} Data: '{1}'", partition, data);
                var deserializer = new JavaScriptSerializer();
                //deserialize json data to azure monitor object
                AzureMonitorDiagnosticLog message = new JavaScriptSerializer().Deserialize<AzureMonitorDiagnosticLog>(result);
            }
        }
    }
}
For the available resource log categories, their associated Log Analytics tables, and the log schemas for IoT Hub, see Azure IoT Hub monitoring data reference.
Analyze monitoring data
There are many tools for analyzing monitoring data.
Azure Monitor tools
Azure Monitor supports the following basic tools:
Metrics explorer, a tool in the Azure portal that allows you to view and analyze metrics for Azure resources. For more information, see Analyze metrics with Azure Monitor metrics explorer.
Log Analytics, a tool in the Azure portal that allows you to query and analyze log data by using the Kusto query language (KQL). For more information, see Get started with log queries in Azure Monitor.
The activity log, which has a user interface in the Azure portal for viewing and basic searches. To do more in-depth analysis, you have to route the data to Azure Monitor logs and run more complex queries in Log Analytics.
Tools that allow more complex visualization include:
- Dashboards that let you combine different kinds of data into a single pane in the Azure portal.
- Workbooks, customizable reports that you can create in the Azure portal. Workbooks can include text, metrics, and log queries.
- Grafana, an open platform tool that excels in operational dashboards. You can use Grafana to create dashboards that include data from multiple sources other than Azure Monitor.
- Power BI, a business analytics service that provides interactive visualizations across various data sources. You can configure Power BI to automatically import log data from Azure Monitor to take advantage of these visualizations.
Azure Monitor export tools
You can get data out of Azure Monitor into other tools by using the following methods:
Metrics: Use the REST API for metrics to extract metric data from the Azure Monitor metrics database. The API supports filter expressions to refine the data retrieved. For more information, see Azure Monitor REST API reference.
Logs: Use the REST API or the associated client libraries.
Another option is the workspace data export.
To get started with the REST API for Azure Monitor, see Azure monitoring REST API walkthrough.
Kusto queries
You can analyze monitoring data in the Azure Monitor Logs / Log Analytics store by using the Kusto query language (KQL).
Important
When you select Logs from the service's menu in the portal, Log Analytics opens with the query scope set to the current service. This scope means that log queries will only include data from that type of resource. If you want to run a query that includes data from other Azure services, select Logs from the Azure Monitor menu. See Log query scope and time range in Azure Monitor Log Analytics for details.
For a list of common queries for any service, see the Log Analytics queries interface.
Use the following Kusto queries to help you monitor your IoT hub.
Connectivity Errors: Identify device connection errors.
AzureDiagnostics
| where ResourceProvider == "MICROSOFT.DEVICES" and ResourceType == "IOTHUBS"
| where Category == "Connections" and Level == "Error"
Throttling Errors: Identify devices that made the most requests resulting in throttling errors.
AzureDiagnostics
| where ResourceProvider == "MICROSOFT.DEVICES" and ResourceType == "IOTHUBS"
| where ResultType == "429001"
| extend DeviceId = tostring(parse_json(properties_s).deviceId)
| summarize count() by DeviceId, Category, _ResourceId
| order by count_ desc
Dead Endpoints: Identify dead or unhealthy endpoints by the number of times the issue was reported and know the reason why.
AzureDiagnostics
| where ResourceProvider == "MICROSOFT.DEVICES" and ResourceType == "IOTHUBS"
| where Category == "Routes" and OperationName in ("endpointDead", "endpointUnhealthy")
| extend parsed_json = parse_json(properties_s)
| extend Endpoint = tostring(parsed_json.endpointName), Reason = tostring(parsed_json.details)
| summarize count() by Endpoint, OperationName, Reason, _ResourceId
| order by count_ desc
Error summary: Count of errors across all operations by type.
AzureDiagnostics
| where ResourceProvider == "MICROSOFT.DEVICES" and ResourceType == "IOTHUBS"
| where Level == "Error"
| summarize count() by ResultType, ResultDescription, Category, _ResourceId
Recently connected devices: List of devices that IoT Hub saw connect in the specified time period.
AzureDiagnostics
| where ResourceProvider == "MICROSOFT.DEVICES" and ResourceType == "IOTHUBS"
| where Category == "Connections" and OperationName == "deviceConnect"
| extend DeviceId = tostring(parse_json(properties_s).deviceId)
| summarize max(TimeGenerated) by DeviceId, _ResourceId
Connection events for a specific device: All connection events logged for a specific device (test-device).
AzureDiagnostics
| where ResourceProvider == "MICROSOFT.DEVICES" and ResourceType == "IOTHUBS"
| where Category == "Connections"
| extend DeviceId = tostring(parse_json(properties_s).deviceId)
| where DeviceId == "test-device"
SDK version of devices: List of devices and their SDK versions for device connections or device to cloud twin operations.
AzureDiagnostics
| where ResourceProvider == "MICROSOFT.DEVICES" and ResourceType == "IOTHUBS"
| where Category == "Connections" or Category == "D2CTwinOperations"
| extend parsed_json = parse_json(properties_s)
| extend SDKVersion = tostring(parsed_json.sdkVersion) , DeviceId = tostring(parsed_json.deviceId)
| distinct DeviceId, SDKVersion, TimeGenerated, _ResourceId
Alerts
Azure Monitor alerts proactively notify you when specific conditions are found in your monitoring data. Alerts allow you to identify and address issues in your system before your customers notice them. For more information, see Azure Monitor alerts.
There are many sources of common alerts for Azure resources. For examples of common alerts for Azure resources, see Sample log alert queries. The Azure Monitor Baseline Alerts (AMBA) site provides a semi-automated method of implementing important platform metric alerts, dashboards, and guidelines. The site applies to a continually expanding subset of Azure services, including all services that are part of the Azure Landing Zone (ALZ).
The common alert schema standardizes the consumption of Azure Monitor alert notifications. For more information, see Common alert schema.
Types of alerts
You can alert on any metric or log data source in the Azure Monitor data platform. There are many different types of alerts depending on the services you're monitoring and the monitoring data you're collecting. Different types of alerts have various benefits and drawbacks. For more information, see Choose the right monitoring alert type.
The following list describes the types of Azure Monitor alerts you can create:
- Metric alerts evaluate resource metrics at regular intervals. Metrics can be platform metrics, custom metrics, logs from Azure Monitor converted to metrics, or Application Insights metrics. Metric alerts can also apply multiple conditions and dynamic thresholds.
- Log alerts allow users to use a Log Analytics query to evaluate resource logs at a predefined frequency.
- Activity log alerts trigger when a new activity log event occurs that matches defined conditions. Resource Health alerts and Service Health alerts are activity log alerts that report on your service and resource health.
Some Azure services also support smart detection alerts, Prometheus alerts, or recommended alert rules.
For some services, you can monitor at scale by applying the same metric alert rule to multiple resources of the same type that exist in the same Azure region. Individual notifications are sent for each monitored resource. For supported Azure services and clouds, see Monitor multiple resources with one alert rule.
IoT Hub alert rules
You can set alerts for any metric, log entry, or activity log entry listed in the IoT Hub monitoring data reference.
Set up metric alerts for device disconnects
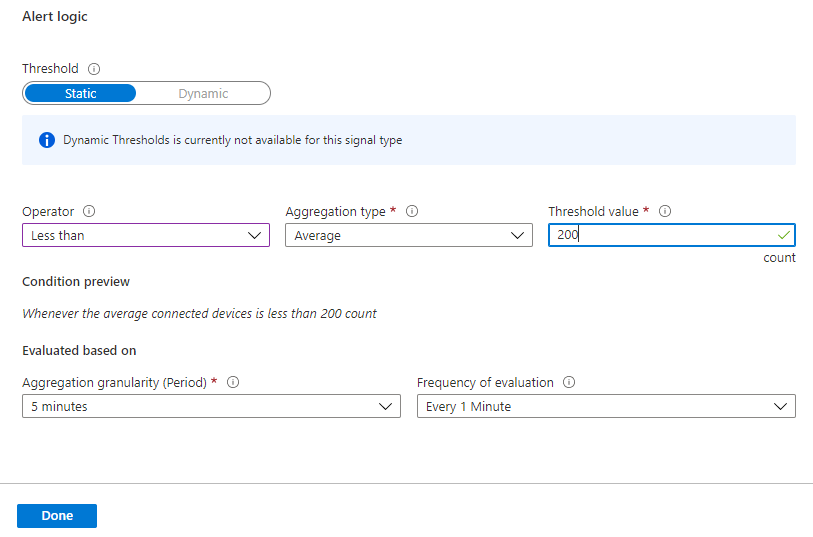
You can set up alerts based on the platform metrics emitted by IoT Hub. With metric alerts, you can notify individuals that a condition of interest occurred and also trigger actions that can respond to that condition automatically.
The Connected devices (preview) metric tells you how many devices are connected to your IoT Hub. If this metric drops below a threshold value, an alert can trigger:
You can use metric alert rules to monitor for device disconnect anomalies at-scale. That is, use alerts to determine when a significant number of devices unexpectedly disconnect. When this situation is detected, you can look at logs to help troubleshoot the issue. To monitor per-device disconnects and disconnects for critical devices in near real time, however, you must use Event Grid.
To learn more about alerts with IoT Hub, see Alerts in Monitor IoT Hub. For a walk-through of creating alerts in IoT Hub, see the Use metrics and logs tutorial. For a more detailed overview of alerts, see Overview of alerts in Microsoft Azure in the Azure Monitor documentation.
Advisor recommendations
For some services, if critical conditions or imminent changes occur during resource operations, an alert displays on the service Overview page in the portal. You can find more information and recommended fixes for the alert in Advisor recommendations under Monitoring in the left menu. During normal operations, no advisor recommendations display.
For more information on Azure Advisor, see Azure Advisor overview.
Related content
- See Azure IoT Hub monitoring data reference for a reference of the metrics, logs, and other important values created for IoT Hub.
- See Monitoring Azure resources with Azure Monitor for general details on monitoring Azure resources.
- See Monitor, diagnose, and troubleshoot device connectivity to Azure IoT Hub for monitoring device connectivity.