Nata
Norint pasiekti šį puslapį, reikalingas leidimas. Galite pabandyti prisijungti arba pakeisti katalogus.
Norint pasiekti šį puslapį, reikalingas leidimas. Galite pabandyti pakeisti katalogus.
Logs help you understand how your User Data Functions are executing and diagnose issues when functions don't behave as expected. You can view logs in two ways:
- During testing - View real-time logs in the Test panel when testing functions in Develop mode
- After invocation - View historical logs for published functions that have been invoked
This article explains how to view and use logs to monitor function execution and troubleshoot issues.
View logs during testing
When you test functions, you can see logs in real time as your function executes:
- Test panel in Develop mode - View logs when testing unpublished or published functions
- Run panel in Run only mode - View logs when running published functions
Both panels display log output immediately, allowing you to see execution details and debug issues as they occur. For more information about testing functions, see Test your User Data Functions.
View historical logs for invoked functions
After your published functions have been invoked, you can view historical logs to analyze past executions.
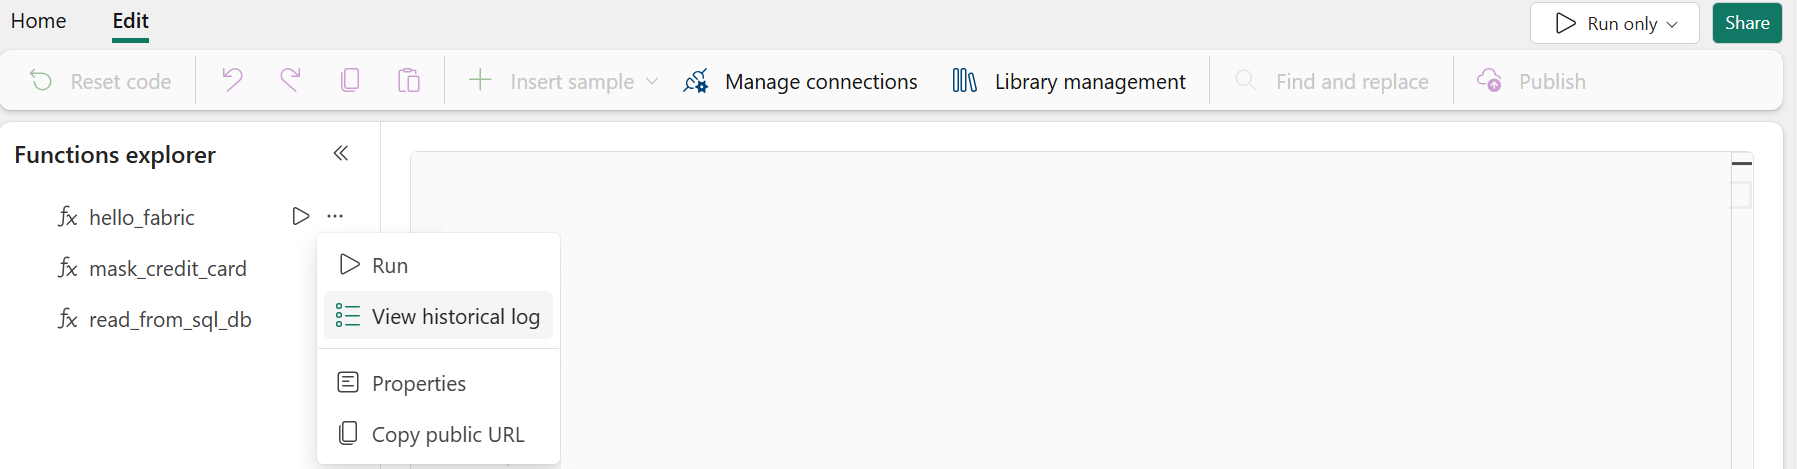
To access historical logs:
Switch to Run only mode using the mode switcher.
Hover over the function name in the functions list.
Select the ellipses icon (...), then select View historical log.

Understand the historical logs view
The historical logs view shows recent invocations for the selected function. You can see up to 50 entries, and logs are retained for 30 days. Select the date link in the Date (UTC) column to view detailed logs for a specific invocation.

The All historical logs pane contains the following information per invocation:
- Date (UTC). The timestamp showing the start of the function invocation. Select the link to review all the logs for that invocation. It displays the details of the invocation with all messages logged by the user or service.
- Status. Indicates whether the invocation succeeded or failed.
- Duration(ms). The duration of the function execution in milliseconds.
- Invocation ID. The ID of that specific function invocation. The Invocation ID is returned as part of an HTTP header. If there are any issues, users can reference this Invocation ID in a support request to retrieve more information about the invocation.
View detailed logs for a specific invocation
After you've opened the historical logs view (as described in the previous section), you can drill down into individual invocations. When you select a timestamp link in the Date (UTC) column, the Invocation details pane opens to display all logs for that invocation. You can view:
- All logs added in your function code using the
loggingmodule - System-generated logs about function execution
- Any errors or exceptions that occurred
Each log entry includes the timestamp, log message, and log level (Information, Warning, Error, Critical).

Add logging to your functions
You can add custom log statements to your functions using Python's standard logging module. Logs help you track function behavior, monitor data processing, and diagnose issues.
Import the logging module
First, import the logging module in your function code:
import logging
Note
The logging module is imported by default when you create a new User Data Functions item in the Fabric portal or using the VS Code extension.
Use appropriate log levels
Python provides different log levels for different situations. Use the appropriate level to make your logs more meaningful:
# INFO - Track normal function execution and key steps
logging.info('Processing started for customer ID: 12345')
logging.info('Successfully retrieved 150 records from database')

# WARNING - Log potentially problematic situations that don't prevent execution
logging.warning('API response time exceeded 2 seconds')
logging.warning('Using cached data because fresh data is unavailable')

# ERROR - Log errors that affect functionality but don't crash the function
logging.error('Failed to connect to external API: Connection timeout')
logging.error('Invalid data format in row 42')

# CRITICAL - Log severe errors that may cause function failure
logging.critical('Database connection lost')
logging.critical('Required configuration parameter missing')
Best practices for logging
Follow these practices to make your logs more effective:
- Log meaningful information - Include relevant details like IDs, counts, or parameter values that help diagnose issues
- Use appropriate log levels - Don't log everything as INFO or ERROR; use the right level for the situation
- Log at key points - Add logs at the start of functions, before and after external calls, and when processing data
- Avoid logging sensitive data - Don't log passwords, tokens, personal information, or other sensitive data
- Keep messages concise - Write clear, brief log messages that are easy to scan
- Be mindful of volume - Excessive logging can impact performance and reach the daily ingestion limit
For more information about writing function code, see the Python programming model.
Limitations and log retention
Keep the following limitations in mind when working with logs:
- Log retention - Historical invocation logs are retained for 30 days by default
- Visible entries - The historical logs view shows up to 50 entries per function
- Log availability - Invocation logs can take a few minutes to appear; refresh the page if you don't see recent logs
- Daily ingestion limit - 250 MB per day; the limit resets daily
- Sampling - Logs may be sampled to reduce volume while preserving statistically correct analysis
- Supported log types - Information, Error, Warning, and Trace
For complete service limits information, see Service details and limitations.
Related content
- Test your User Data Functions - Learn how to test functions and view real-time logs in the Test panel
- Python programming model - Understand how to write function code and use the logging module
- Service details and limitations - Review log retention and service limits
- Tutorial: Invoke user data functions from a Python application - Learn how to invoke functions and use invocation IDs