Zdarzenia
19 lis, 23 - 21 lis, 23
Uzyskaj przewagę konkurencyjną, której potrzebujesz dzięki zaawansowanym rozwiązaniom sztucznej inteligencji i chmury, uczestnicząc w konferencji Microsoft Ignite online.
Zarejestruj się terazTa przeglądarka nie jest już obsługiwana.
Przejdź na przeglądarkę Microsoft Edge, aby korzystać z najnowszych funkcji, aktualizacji zabezpieczeń i pomocy technicznej.
To check out the latest features of Microsoft Edge DevTools and the Microsoft Edge DevTools extension for Microsoft Visual Studio Code and Visual Studio, read these announcements.
To stay up to date and get the latest DevTools features, download an Insiders preview version of Microsoft Edge. Whether you're on Windows, Linux, or macOS, consider using Canary (or another preview channel) as your default development browser. The Beta, Dev, and Canary versions of Microsoft Edge run as separate apps, side-by-side with the stable, released version of Microsoft Edge. See Microsoft Edge Insider Channels.
For the latest announcements, follow the Microsoft Edge team on Twitter. To report a problem with DevTools or ask for a new feature, file an issue in the MicrosoftEdge/DevTools repo.

We're excited to announce the new MicrosoftEdge > DevTools repo at GitHub! This new repo is a place for our community of developers to send us ideas, feedback, suggestions, and tips to improve DevTools. We're eager to discuss with you how DevTools can better serve your needs and meet the challenges you face every day in building great web experiences.

Head to our DevTools repo at GitHub to become a part of the Edge DevTools community.
When looking at all the objects in a heap snapshot in the Memory tool, it can be difficult to focus on specific objects or retaining paths. Now in Microsoft Edge 100, you can use the new Node Types filter when looking at a heap snapshot, to focus on only specific types of nodes. For example, to see only the arrays and string objects that are in the heap, select the Array and String entries in the Node Types filter:

See also:
Customizing and simplifying the developer experience includes making our tools available to everyone, regardless of their preferred language. We've added two new languages, Czech and Vietnamese, to our list of supported languages, and will keep adding more. If your preferred language isn't supported in DevTools, let us know!

See also:
In Microsoft Edge 100, the Network tool supports a new Fulfilled by column in the request log. If the request was fulfilled by your service worker or from the cache, that information is now tracked in the Fulfilled by column. When exporting or importing the request log as a HAR file, the information in the Fulfilled by column is also included.

See also:
For the history of this feature, see Issue #16.
In the Issues tool, the new Severity and Browser dropdown lists allow you to filter messages by severity and browser target, to help you focus on the most relevant feedback. You can select or clear the options in each dropdown list.
To see all relevant messages, you might need to refresh the page. If prompted, in the Issues tool, click the Regenerate issues button.
By default, the Severity filter is set to show only warnings and errors:

The Browser filter only applies to browser compatibility feedback, which is shown in the Compatibility section of the Issues list. By default, the Browser filter shows messages for the top browsers, as defined by Browserslist:
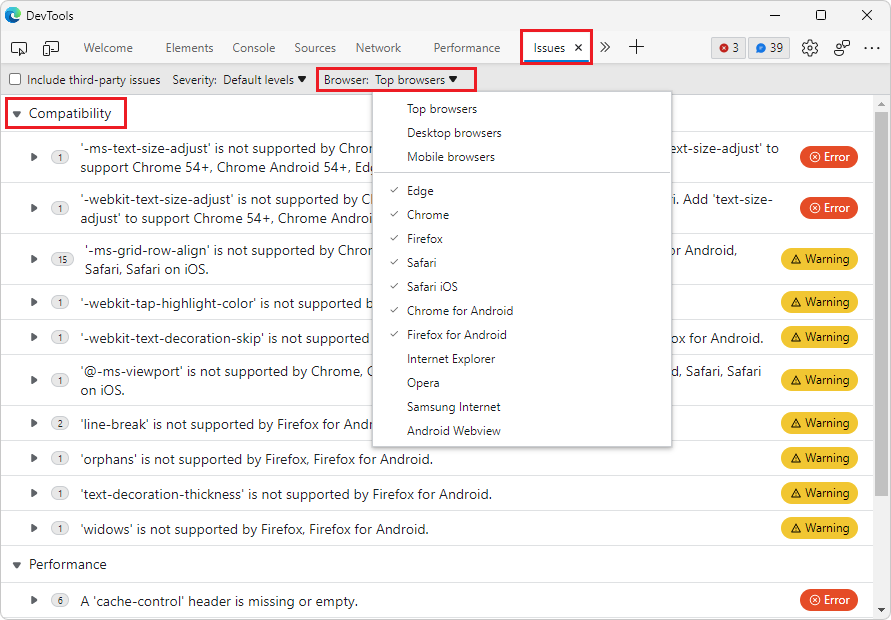
In the following example, messages about Firefox and Firefox for Android are filtered out:

See also:
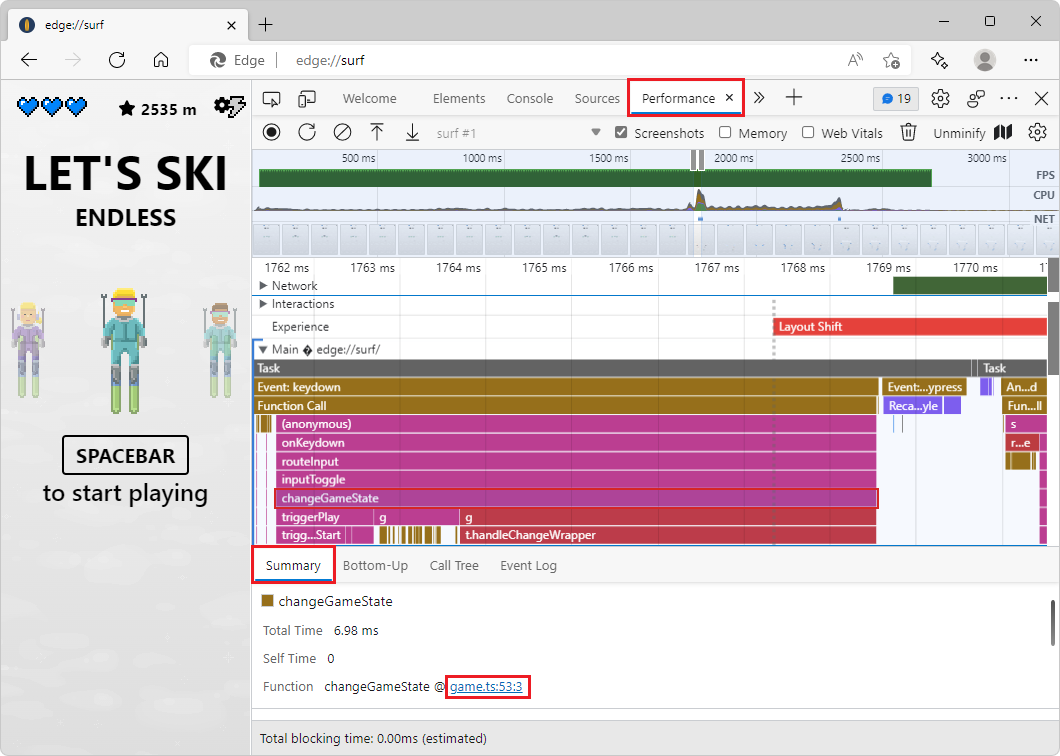
When recording a performance profile, the flame chart in the Performance tool displays links from each event on the main thread to the corresponding JavaScript function in the Sources tool. However, these links are broken when you export and import a performance profile.
In Microsoft Edge 100, the links from an imported performance profile now use source maps from Azure Artifacts symbol server to map back to your familiar, original source code. The performance profile must have been exported in Microsoft Edge 100 (or greater), so that the profile includes the information that's needed to resolve source maps in the exported performance trace.
See also:
In previous versions of Microsoft Edge, the Waterfall view of requests in the Network tool didn't match the themes from Visual Studio Code that apply to the rest of DevTools. In Microsoft Edge 100, this issue has been fixed.
Before Microsoft Edge 100, the selected theme wasn't applied in the Waterfall view:

Now in Microsoft Edge 100, the selected theme is applied to the Waterfall view of requests in the Network tool:

See also:
Microsoft Edge version 100 also includes the following updates from the Chromium project:
Zdarzenia
19 lis, 23 - 21 lis, 23
Uzyskaj przewagę konkurencyjną, której potrzebujesz dzięki zaawansowanym rozwiązaniom sztucznej inteligencji i chmury, uczestnicząc w konferencji Microsoft Ignite online.
Zarejestruj się teraz