將泡泡圖層新增至地圖 (Android SDK)
本文說明如何將資料來源的點資料轉譯為地圖上的泡泡圖層。 泡泡圖層會將點轉譯為地圖上具有固定像素半徑的圓圈。
注意
Azure 地圖服務 Android SDK 淘汰
適用於 Android 的 Azure 地圖服務原生 SDK 現已被取代,將於 3/31/25 淘汰。 若要避免服務中斷,請在 3/31/25 之前遷移至 Azure 地圖服務 Web SDK。 如需詳細資訊,請參閱 Azure 地圖服務 Android SDK 移轉指南 (部分機器翻譯)。
提示
根據預設,泡泡圖層會轉譯資料來源中所有幾何圖形的座標。 若要限制圖層,使其只轉譯點幾何特徵,請將圖層的 filter 選項設為 eq(geometryType(), "Point")。 如果還要加上 MultiPoint 特徵,請將圖層的 filter 選項設定為 any(eq(geometryType(), "Point"), eq(geometryType(), "MultiPoint"))。
必要條件
完成快速入門:建立 Android 應用程式一文中的步驟。 本文中的程式碼區塊可以插入地圖 onReady 事件處理常式中。
新增泡泡圖層
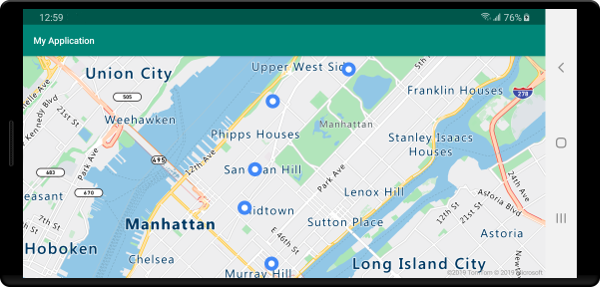
下列程式碼會將點的陣列載入至資料來源。 然後,它會將資料點連接到泡泡圖層。 泡泡圖層會以五個像素轉譯每個泡泡的半徑,並以白色填滿色彩。 還有藍色筆劃色彩,以及六像素的筆劃寬度。
//Create a data source and add it to the map.
DataSource source = new DataSource();
map.sources.add(source);

//Create point locations.
Point[] points = new Point[] {
    Point.fromLngLat(-73.985708, 40.75773),
    Point.fromLngLat(-73.985600, 40.76542),
    Point.fromLngLat(-73.985550, 40.77900),
    Point.fromLngLat(-73.975550, 40.74859),
    Point.fromLngLat(-73.968900, 40.78859)
};

//Add multiple points to the data source.
source.add(points);

//Create a bubble layer to render the filled in area of the circle, and add it to the map.
BubbleLayer layer = new BubbleLayer(source,
    bubbleRadius(5f),
    bubbleColor("white"),
    bubbleStrokeColor("#4288f7"),
    bubbleStrokeWidth(6f)
);

map.layers.add(layer);
//Create a data source and add it to the map.
val source = DataSource()
map.sources.add(source)

//Create point locations.
val points: Array<Point> = arrayOf<Point>(
    Point.fromLngLat(-73.985708, 40.75773),
    Point.fromLngLat(-73.985600, 40.76542),
    Point.fromLngLat(-73.985550, 40.77900),
    Point.fromLngLat(-73.975550, 40.74859),
    Point.fromLngLat(-73.968900, 40.78859)
)

//Add multiple points to the data source.
source.add(points)

//Create a bubble layer to render the filled in area of the circle, and add it to the map.
val layer = BubbleLayer(
    source,
    bubbleRadius(5f),
    bubbleColor("white"),
    bubbleStrokeColor("#4288f7"),
    bubbleStrokeWidth(6f)
)

map.layers.add(layer)
下列螢幕擷取畫面顯示上述程式碼在泡泡圖層中轉譯的點。
顯示標籤與泡泡圖層
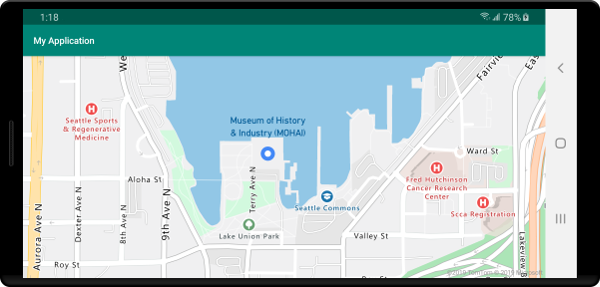
此程式碼會示範如何使用泡泡圖層轉譯地圖上的點。 以及如何使用符號圖層來轉譯標籤。 若要隱藏符號圖層的圖示,請將 iconImage 選項設定為 "none"。
//Create a data source and add it to the map.
DataSource source = new DataSource();
map.sources.add(source);

//Add a data point to the map.
source.add(Point.fromLngLat(-122.336641,47.627631));

//Add a bubble layer.
map.layers.add(new BubbleLayer(source,
    bubbleRadius(5f),
    bubbleColor("white"),
    bubbleStrokeColor("#4288f7"),
    bubbleStrokeWidth(6f)
));

//Add a symbol layer to display text, hide the icon image.
map.layers.add(new SymbolLayer(source,
    //Hide the icon image.
    iconImage("none"),
    textField("Museum of History & Industry (MOHAI)"),
    textColor("#005995"),
    textOffset(new Float[]{0f, -2.2f})
));
//Create a data source and add it to the map.
val source = DataSource()
map.sources.add(source)

//Add a data point to the map.
source.add(Point.fromLngLat(-122.336641, 47.627631))

//Add a bubble layer.
map.layers.add(
    BubbleLayer(
        source,
        bubbleRadius(5f),
        bubbleColor("white"),
        bubbleStrokeColor("#4288f7"),
        bubbleStrokeWidth(6f)
    )
)

//Add a symbol layer to display text, hide the icon image.
map.layers.add(
    SymbolLayer(
        source,  //Hide the icon image.
        iconImage("none"),
        textField("Museum of History & Industry (MOHAI)"),
        textColor("#005995"),
        textOffset(arrayOf(0f, -2.2f))
    )
)
下列螢幕擷取畫面顯示上述程式碼在泡泡圖層中轉譯的點,以及使用符號圖層轉譯該點的文字標籤。
下一步
請參閱下列文章,以取得更多可新增至地圖的程式碼範例: