Note
Access to this page requires authorization. You can try signing in or changing directories.
Access to this page requires authorization. You can try changing directories.
Use general properties and scheduling options to define and schedule a forecast model.
Define a forecast model
Define the entities that must be used to generate the forecast.
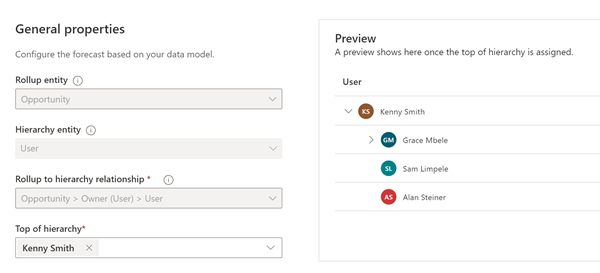
In the General step of the Forecast configuration page, define the fields that should be used for the forecast. The following screenshot is an example of the General step for an org chart forecast. Let's walk through the options in the subsequent steps.
Enter a descriptive name for the forecast. Example: Kenny's Org FY2023 Forecast.
Select a Rollup entity.
The forecast is based on the gross rollup of the entity you select. Each forecast template starts with a default rollup entity:
Template Default rollup entity Org chart forecast Opportunity Product forecast Opportunity Product Territory forecast Opportunity Choose a custom or out-of-the-box entity to support your organization's specific requirements if needed.
Only entities that have Change Tracking turned on are listed. To learn more, see Enable change tracking to control data synchronization.
Select the Funnel icon next to Rollup entity to filter opportunities that participate in calculating the forecast values. Learn more about roll up filters.
Select a Hierarchy entity.
The forecast uses this entity to group your organization's data. Only entities that have a hierarchy are shown in the list.
Each forecast template starts with a default hierarchy entity:
Template Default hierarchy entity Org chart forecast User Product forecast Product Territory forecast Territory Select the Funnel icon next to Hierarchy entity to filter your forecast to include only those hierarchies that meet the specified conditions. Learn more about hierarchy filters.
Select a Rollup to hierarchy relationship.
This step establishes a relationship between the rollup and hierarchy entities. Each forecast template starts with a default rollup to hierarchy relationship:
Template Rollup to hierarchy relationship Description Org chart forecast Opportunity > Owner (User) > User The forecast hierarchy is defined based on the organizational hierarchy. Product forecast Opportunity Product > Existing Product (Product) > Product The forecast hierarchy is defined based on the product hierarchy. Territory forecast Opportunity > Account (Account) > Territory (Territory) > Territory The forecast hierarchy is defined based on the territory hierarchy. Choose different values to support your organization's specific requirements if needed.
In the example screenshot, we selected User as the hierarchy entity. We can choose from fields in the Opportunity entity that are related to the User entity. As we want to build a forecast based on sellers who own opportunities, we selected Owner as the relationship. The relationship is mapped as Opportunity > Owner (User) > User. The mapping specifies that the forecast values are based on the Owner field in the Opportunity entity.
What if there is no direct relationship between the rollup entity and the hierarchy entity? In that case, you can choose a field from a related entity to define an indirect relationship. Select the Related tab, and then choose a field from the list. Only fields in hierarchical entities are shown in the Related list.
In the following example, we selected Opportunity as the rollup entity and Territory as the hierarchy entity. Because there's no direct relationship between them, we must select the Related tab.
In our example, the Territory field in the Related list is indirectly related to Opportunity through the Account entity. In other words, Account is an intermediate entity for establishing a relationship between Opportunity and Territory.
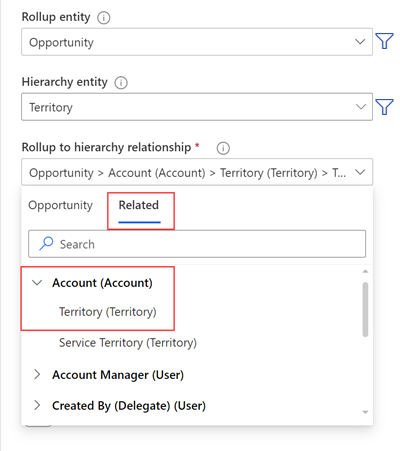
The relationship is mapped as Opportunity > Account (Account) > Territory (Territory) > Territory. The mapping specifies that there's a field Account in the Opportunity entity that's related to the Account entity. The Account entity in turn has a Territory field that's related to the Territory entity. The rollup values in the forecast are based on the relationship defined through the Territory field.
In the Top of hierarchy list, select a value that will be at the top of this forecast hierarchy.
The list of values depends on the hierarchy entity you selected. For example, if you select User as the hierarchy entity, the list displays active users in your organization.
Let's say that Kenny Smith, a sales director, wants to see the forecast for their team. Kenny builds a forecast based on the Org chart template and selects their own name as the top of the hierarchy. The team's hierarchy is previewed to the right of the forecast options.

Schedule the forecast, as described in the following section. You must add at least one forecast period to go to the next step.
When you've finished scheduling, select Next.

Schedule the forecast
In the Scheduling section, add forecast periods to match the forecast periods in your organization and how often you want to generate the forecast. Each forecast configuration can have multiple forecast periods with different period types.
Quick example
Let's say your organization's fiscal year runs from January 1 to December 31. To schedule a monthly forecast for the fiscal year 2023, select the values as follows:
- Scheduling format: Gregorian
- Period start date: Jan 1, 2023
- Forecast period: Monthly
- Fiscal year: FY2023
- Start this forecast: January
- Number of periods: 12

When you add the above schedule, 12 forecast periods are added to the Periods for this forecast table on the right side. Select the image to see the full screen view. For information about each of the above fields, see Manage forecast periods.
Can't find the feature in your app?
There are a few possibilities:
- You don't have the necessary license to use this feature. Check out the comparison table and the licensing guide to see which features are available with your license.
- You don't have the necessary security role to use this feature.
- To configure or setup a feature, you need to have the Administration and customization roles
- To use sales-related features, you need to have the Primary sales roles
- Some tasks require specific Functional roles.
- Your administrator hasn't turned on the feature.
- Your organization is using a custom app. Check with your administrator for exact steps. The steps described in this article are specific to the out-of-the-box Sales Hub and Sales Professional apps.
| > [!div class="nextstepaction"] > [Previous step: Select a template](select-template-forecast.md) |
Related information
Configure forecasts in your organization
Configure forecasts by using a custom rollup entity
Forecast period rules
Work with fiscal year settings
Troubleshooting forecasts