Navigate the Fabric Lakehouse explorer
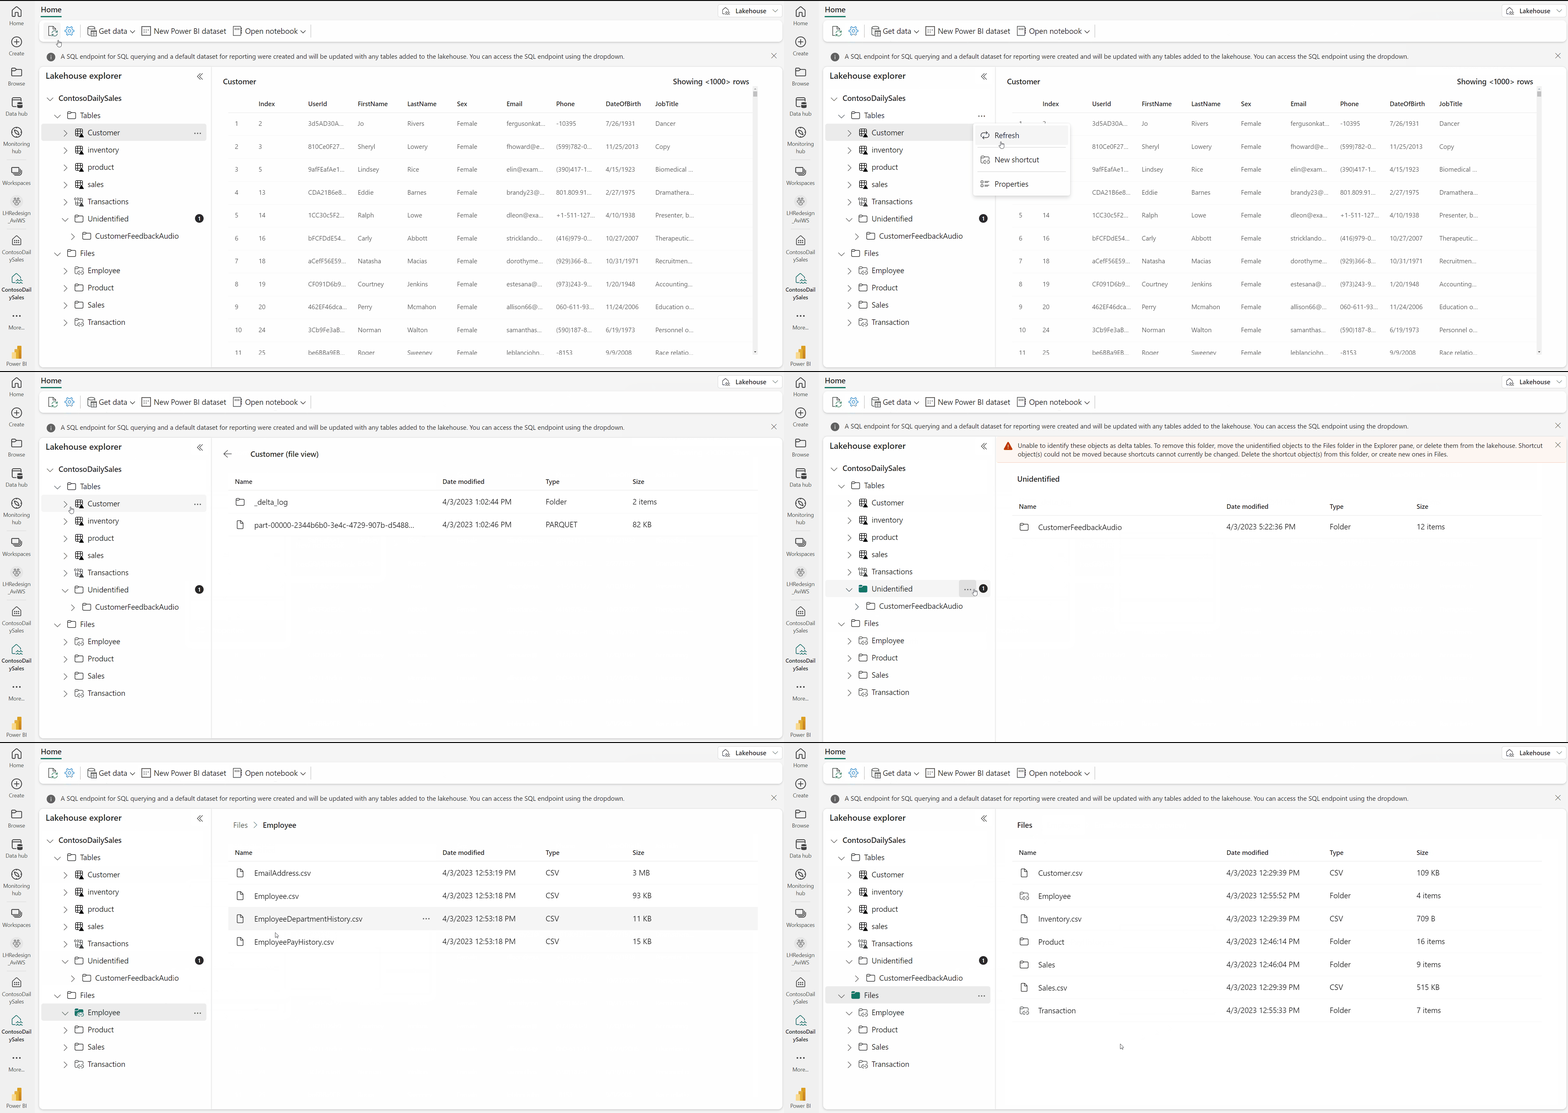
The Lakehouse explorer page serves as the central hub for all your interactions within the Lakehouse environment. The explorer is built into the Fabric portal. To open the lakehouse explorer, switch to Data Engineering with the workload switcher. Find and navigate to your lakehouse item, which opens the explorer where you can interact with the lakehouse data. The explorer is your gateway to seamlessly load data into your lakehouse, navigate through your data, preview content, and perform various data-related tasks. This page is divided into three main sections: the Lakehouse explorer, the Main View, and the Ribbon.
Lakehouse explorer
The Lakehouse explorer offers a unified, graphical representation of your entire lakehouse, providing users with an intuitive interface for data navigation, access, and management.
The Table Section is a user-friendly representation of the managed area within your lakehouse. This area is typically organized and governed to facilitate efficient data processing and analysis. Here, you find all your tables, whether they were automatically generated or explicitly created and registered in the metastore. You can select a table to preview, inspect the table schema, access underlying files, and execute various other actions related to your data.
The Unidentified Area is a unique space within the managed area of your lakehouse. It displays any folders or files present in the managed area that lack associated tables in SyMS. For instance, if a user uploads unsupported files like images or audio files to the managed area, they won't be automatically detected and linked to tables. Instead, they appear in this unidentified area. The primary purpose of this section is to prompt users to either remove these files from the managed area or transfer them to the File Section for further processing.
The File Section represents the unmanaged area of your lakehouse and can be considered a "landing zone" for raw data ingested from various sources. Before this data can be used for analysis, it often requires additional processing. In this section, you can navigate through directories, select a directory to preview, load a folder into a table, and perform various other actions. It's worth noting that the File Section displays folder-level objects exclusively. To view file-level objects, you need to utilize the Main View area.
Main view area
The main view area of the lakehouse page is the space where most of the data interaction occurs. The view changes depending on what you select. Since the object explorer only displays a folder level hierarchy of the lake, the main view area is what you use to navigate your files, preview files & tables, and various other tasks.
Table preview
Our table preview datagrid is equipped it with a suite of powerful features that elevate your data interactions to make working with your data even more seamless. Here's are some key features:
Sort columns in ascending or descending order with a simple click. This feature provides you with full control over your data's organization while working with large semantic models or when you need to quickly identify trends.
Filter data by substring or by selecting from a list of available values in your table.
Resize columns to tailor your data view to suit your preferences. This feature helps you prioritize essential data or expand your field of view to encompass a broader range of information.
File preview
Previewing data files in a lakehouse offers a range of benefits that enhance data quality, understanding, and overall data management efficiency. It empowers data professionals to make informed decisions, optimize resource allocation, and ensure that their analysis is based on reliable and valuable data.
Preview is available for the following file types: bmp, css, csv, gif, html, jpeg, jpg, js, json, md, mjs, png, ps1, py, svg, ts, tsx, txt, xml,yaml
Ribbon
The lakehouse ribbon is your quick-access action bar, offering a convenient way to perform essential tasks within your lakehouse. From here, you can refresh your lakehouse, update settings, load data, create or open notebooks, create new custom semantic models, to manage OneLake data access with ease.
Different ways to load data into a lakehouse
There are several ways to load data into your lakehouse from the explorer page:
Local file/folder upload: Easily upload data from your local machine directly to the File section of your lakehouse. Learn more here.
Notebook code: Utilize available Spark libraries to connect to data sources and load data into dataframes, then save it in your lakehouse. Find additional information here.
Copy tool in pipelines: Connect to various data sources and land the data in its original format or convert it into a Delta table. Learn more here.
Dataflows Gen 2: Create dataflows to import data, transform it, and publish it into your lakehouse. Find out more here.
Shortcut: Create shortcuts that connect to existing data in your lakehouse without needing to copy it. Find additional information here.
Samples: Quickly ingest sample data to jump-start your exploration of semantic models and tables.
Discover different use cases to understand the best way to load data in your lakehouse.
Access a lakehouse's SQL analytics endpoint
The SQL analytics endpoint can be accessed directly from a lakehouse by using the dropdown in top-right area of the ribbon. Using this quick access method, you immediately land in the t-sql mode, which will allow you to work directly on top of your Delta tables in the lake to help you prepare them for reporting.
Related content
We hope this guide helps you make the most of the Lakehouse explorer and its diverse functionalities. Feel free to explore, experiment, and make your data management tasks more efficient.
