Note
Access to this page requires authorization. You can try signing in or changing directories.
Access to this page requires authorization. You can try changing directories.
These are the latest features in the Stable release of Microsoft Edge DevTools.
Announcements from the Microsoft Edge DevTools team
Accessibility improvements to the DevTools
The DevTools team has contributed 170 changes to Chromium to address high-impact color contrast, keyboard, and screen reader issues in the DevTools. Every developer building the web should be able to use the DevTools.
Want to learn how to make your web page accessible to all of your users? Download the Accessibility Insights and webhint extensions for Microsoft Edge to get started.
If you use screen readers or the keyboard to navigate around the DevTools, send us your feedback by tweeting at us or clicking the Send Feedback icon!
Chromium issue #963183
See also:
Using the DevTools in other languages
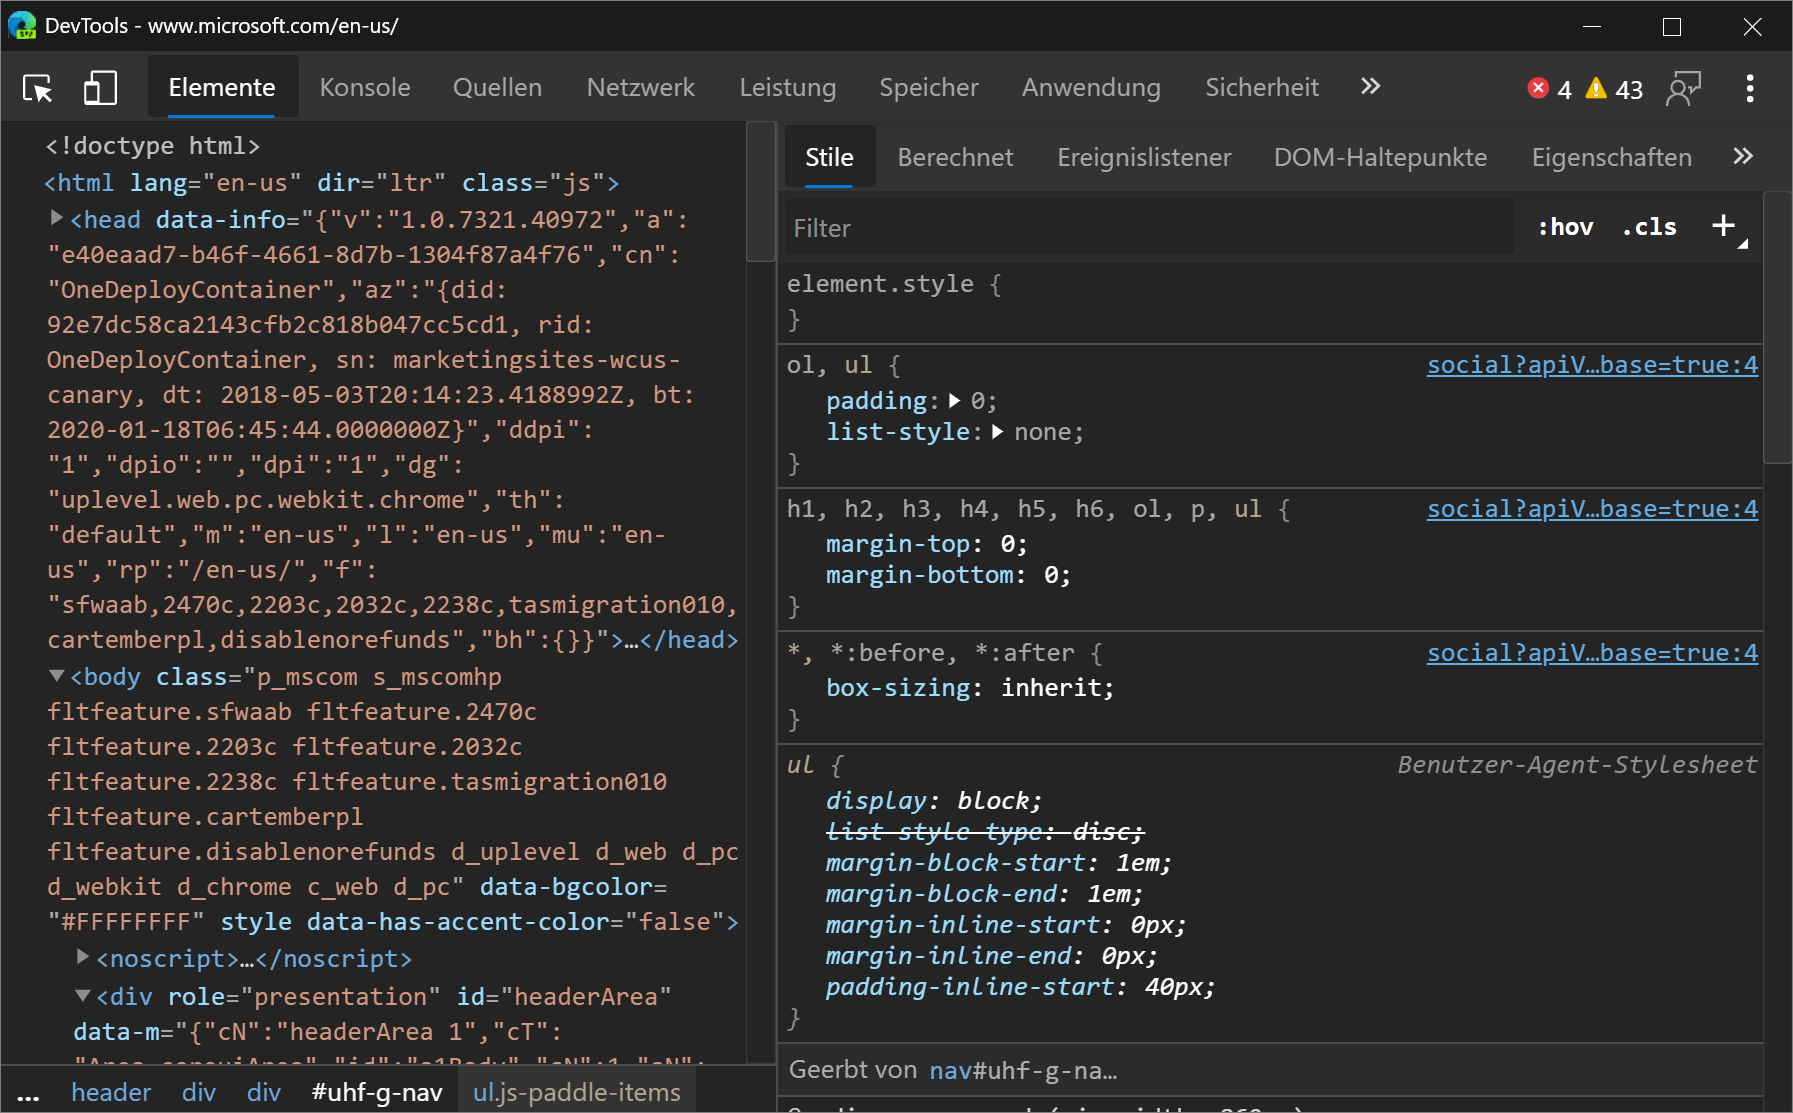
Many developers use other developer tools, like StackOverflow and Visual Studio Code, in their native language, not just in English. We're excited to announce localization for the DevTools, which you can now use in one of 10 languages besides English:
- Chinese (Simplified) - 中文(简体)
- Chinese (Traditional) - 中文(繁體)
- French – français
- German - deutsch
- Italian - italiano
- Japanese - 日本語
- Korean - 한국어
- Portuguese - português
- Russian – русский
- Spanish - español
The DevTools automatically match the language you use for Microsoft Edge in edge://settings/languages.
If you want Microsoft Edge to be in one language and your DevTools to remain in English, press F1 in DevTools to open Settings and disable Match browser language.
Console messages aren't localized. Only the strings used in the DevTools UI are displayed in the language you use for Microsoft Edge.
If you want to use the DevTools in a different language than the ones that are available, tweet at us or click the Send Feedback icon.
Chromium issue #941561
See also:
webhint Microsoft Edge extension
The webhint Microsoft Edge extension allows you to easily scan your web page and get feedback on accessibility, browser compatibility, security, performance, and more within the DevTools. Read more at https://webhint.io.
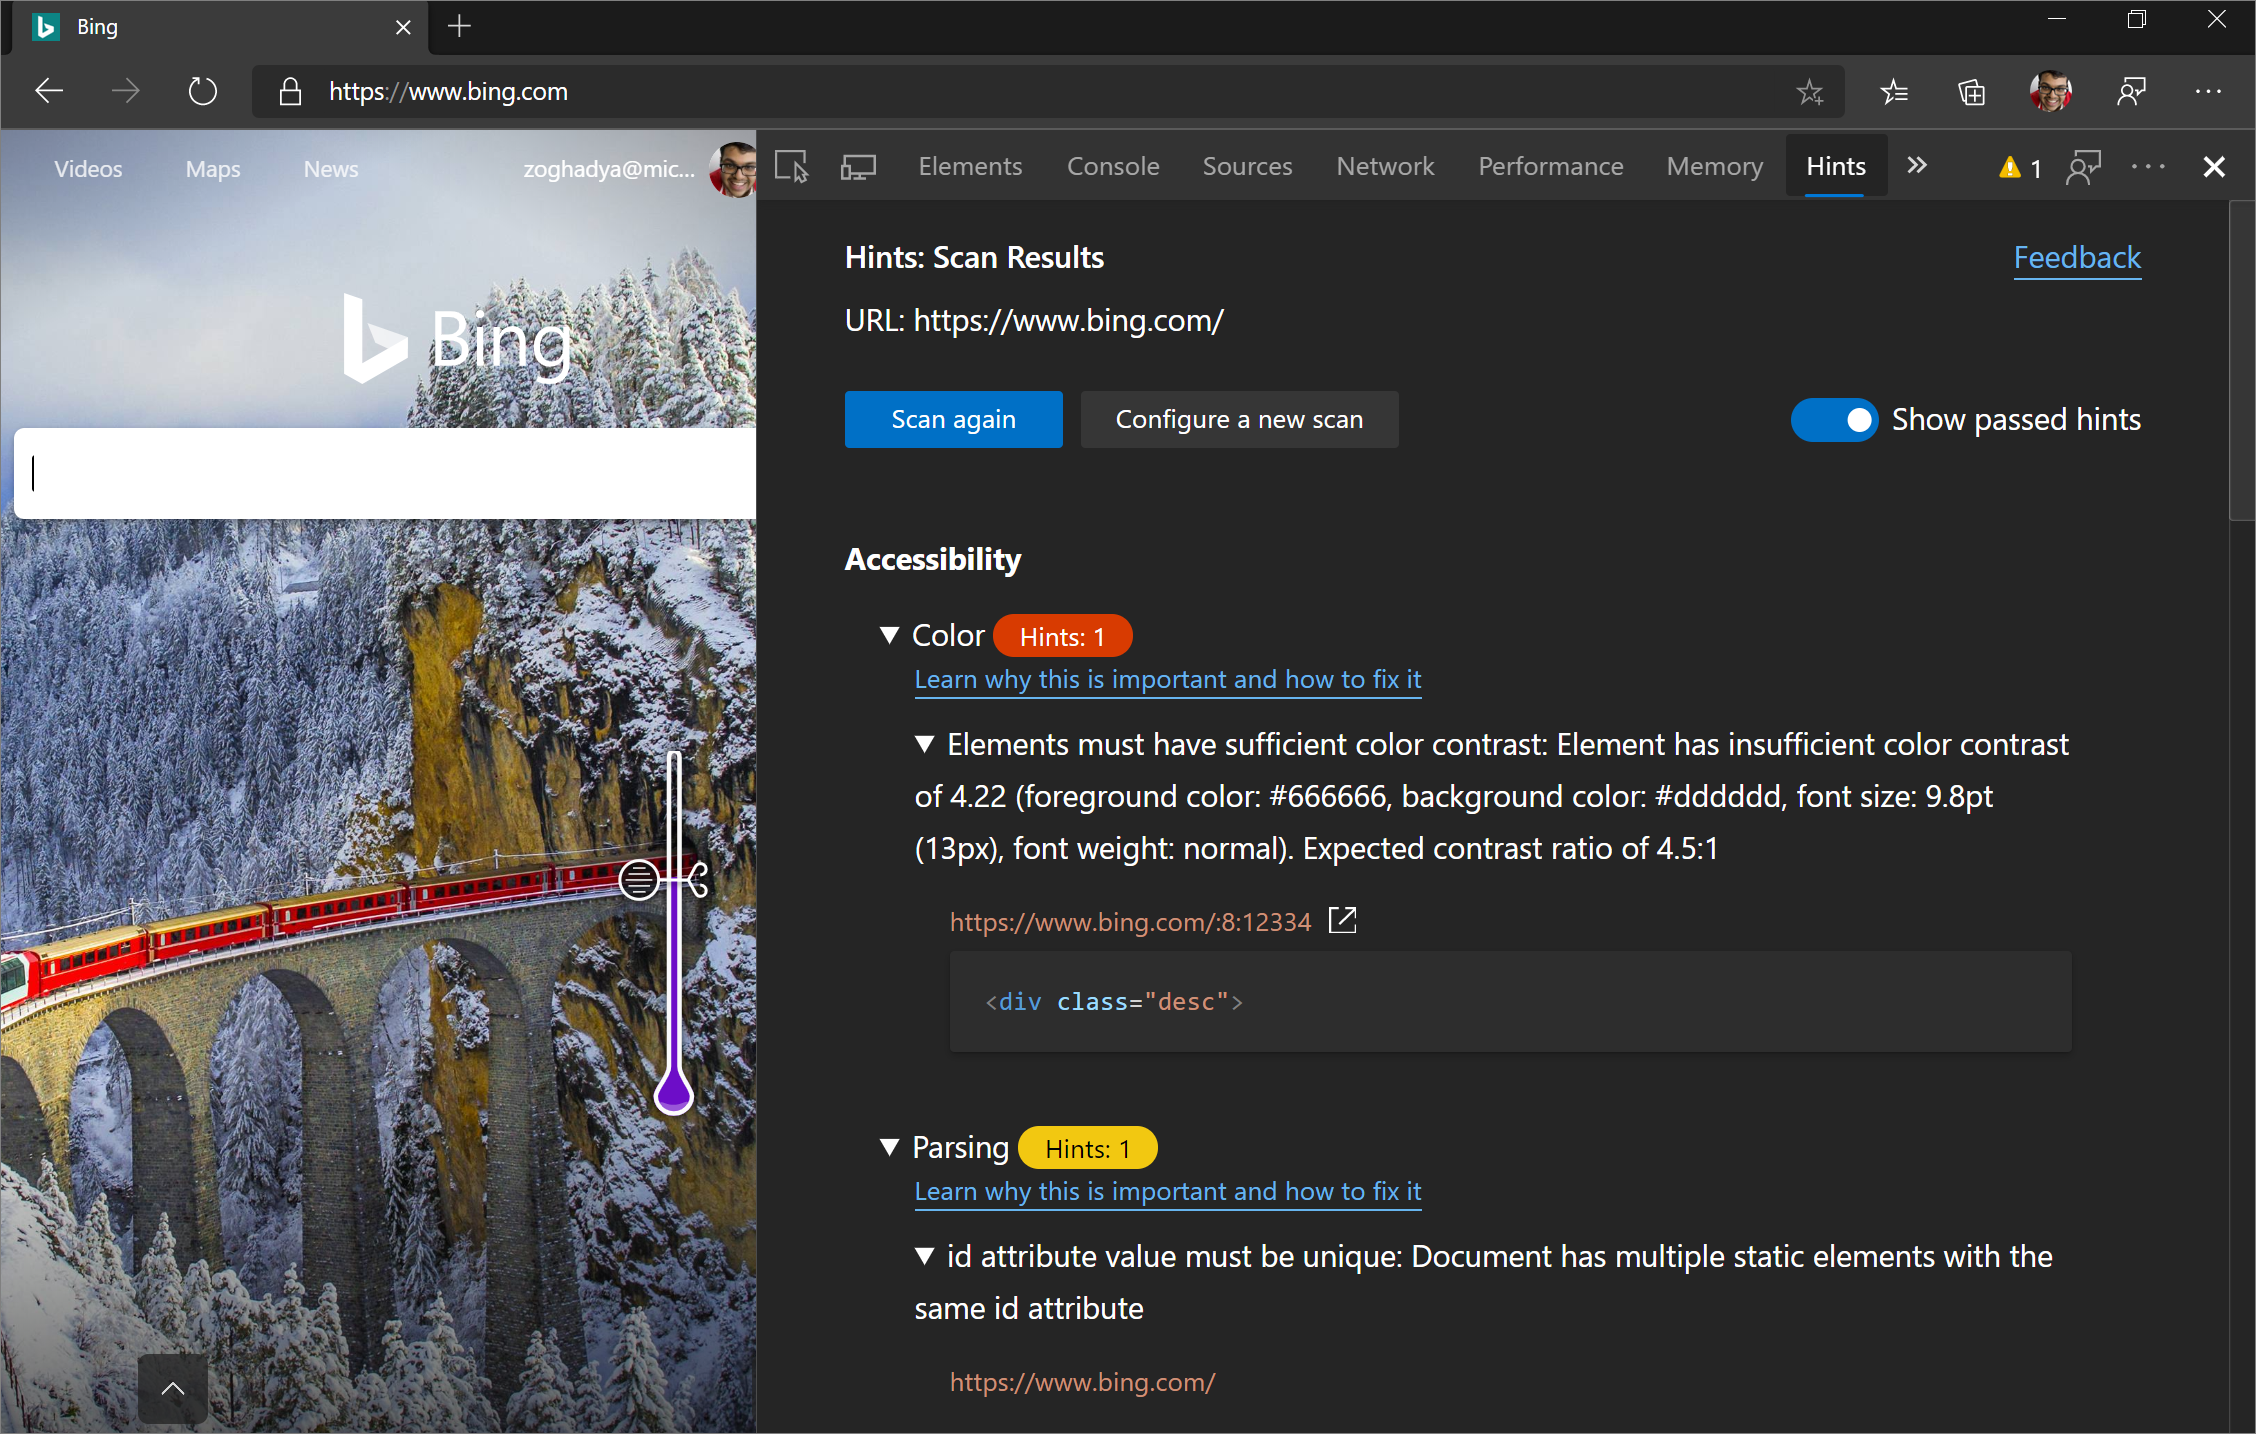
Try the webhint browser extension in Microsoft Edge. Once you install the extension, open the DevTools and select the Hints tool. From here, run a customizable site scan. Head over to webhint.io to learn more.
See also:
3D View
Use the 3D View to debug your web application by navigating through the Document Object Model (DOM) or the z-index stacking context.
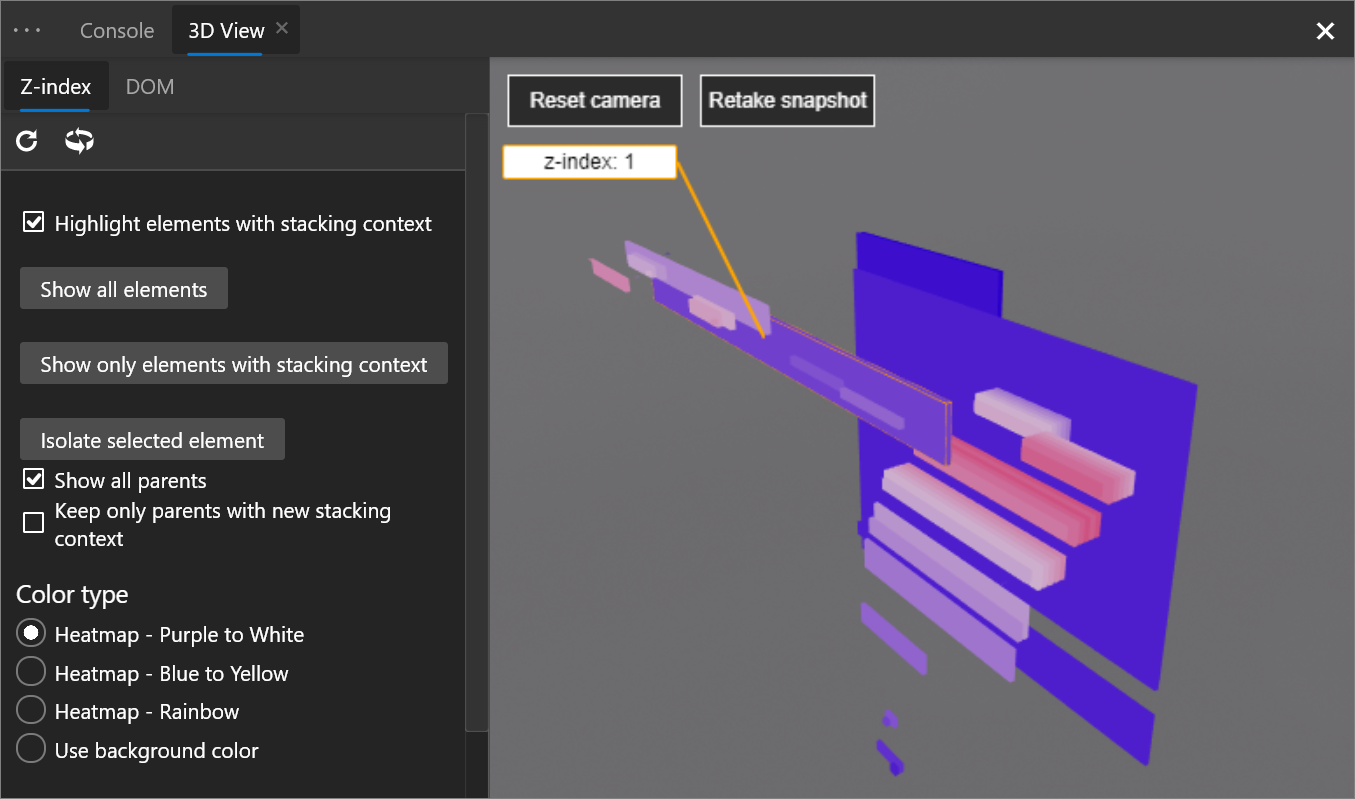
To open the 3D View tool, press Ctrl+Shift+P (Windows/Linux) or Command+Shift+P (macOS) to open the Command Menu, start typing 3d view, and then select Show 3D View.
The Microsoft Edge team is working with the Chromium team on the UI and adding more functionality to the 3D View, so please use the Send Feedback icon!
Chromium issue #987787
See also:
Visual Studio Code extensions
The DevTools team has also released some extensions for Visual Studio Code that let you use the power of the DevTools directly from your text editor! Check out the extensions below:
See also:
Elements for Microsoft Edge
Use the Elements tool from within Visual Studio Code by adding the Elements for Microsoft Edge Visual Studio Code extension.
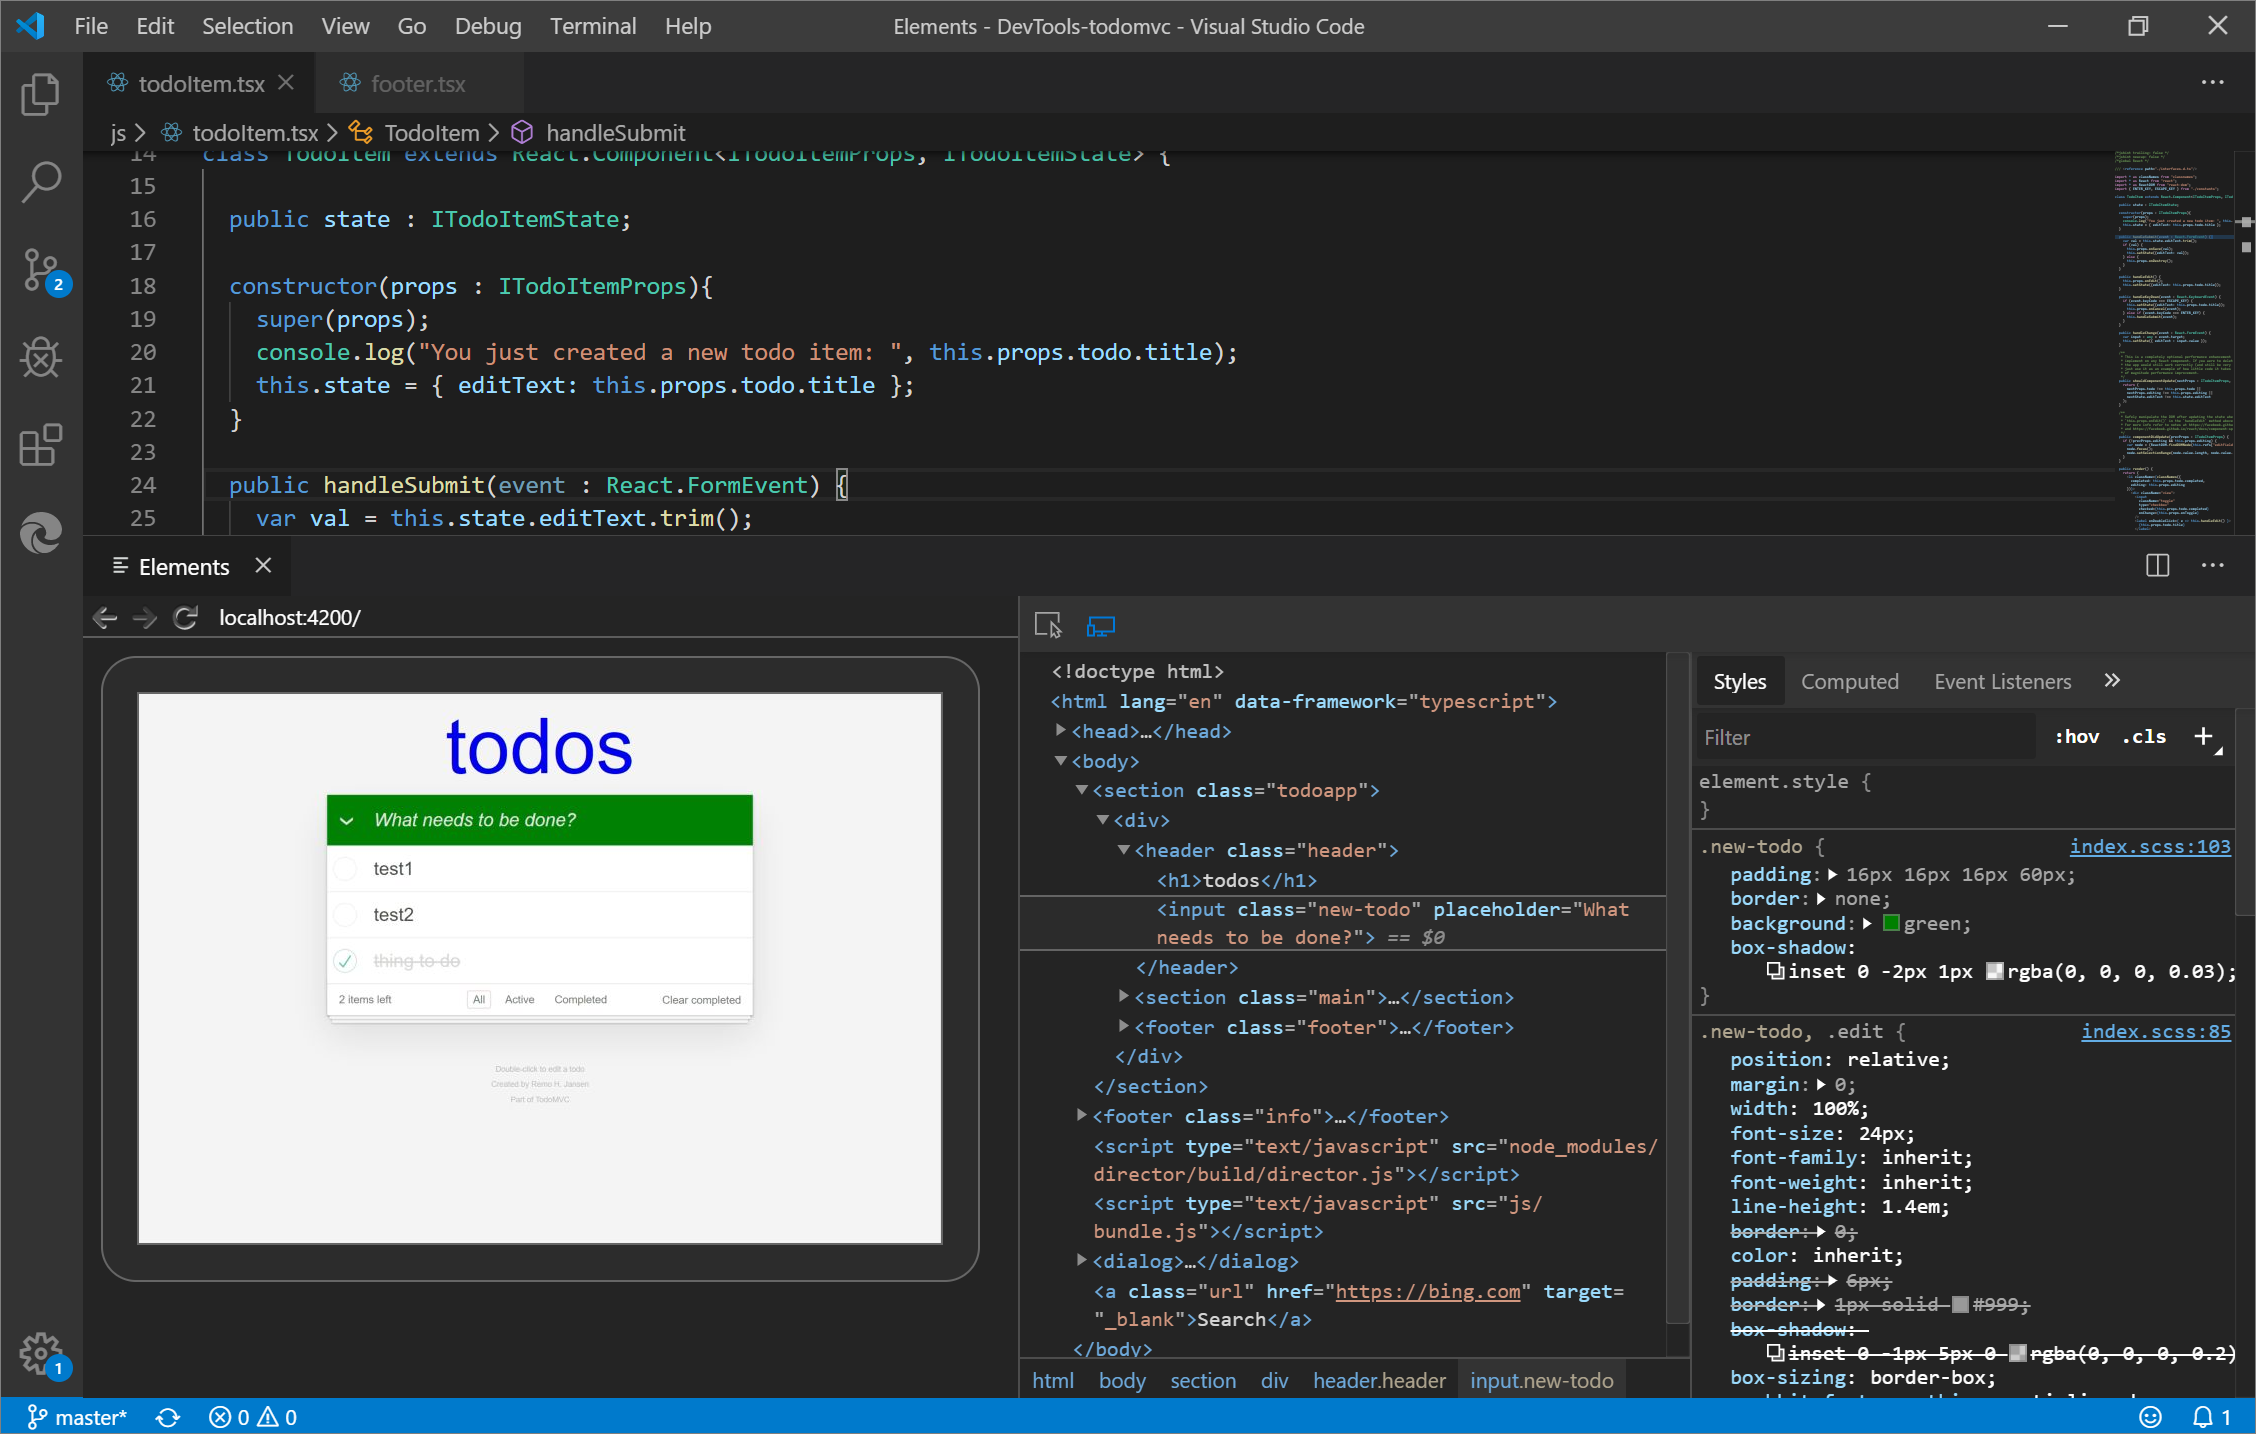
Update: As of 2022, the Elements for Microsoft Edge extension is now the Microsoft Edge DevTools extension for Visual Studio Code.
For more information, check out Microsoft Edge DevTools extension for Visual Studio Code.
Debugger for Microsoft Edge
With the Debugger for Microsoft Edge Visual Studio Code extension, debug JavaScript running in Microsoft Edge directly from Visual Studio Code.
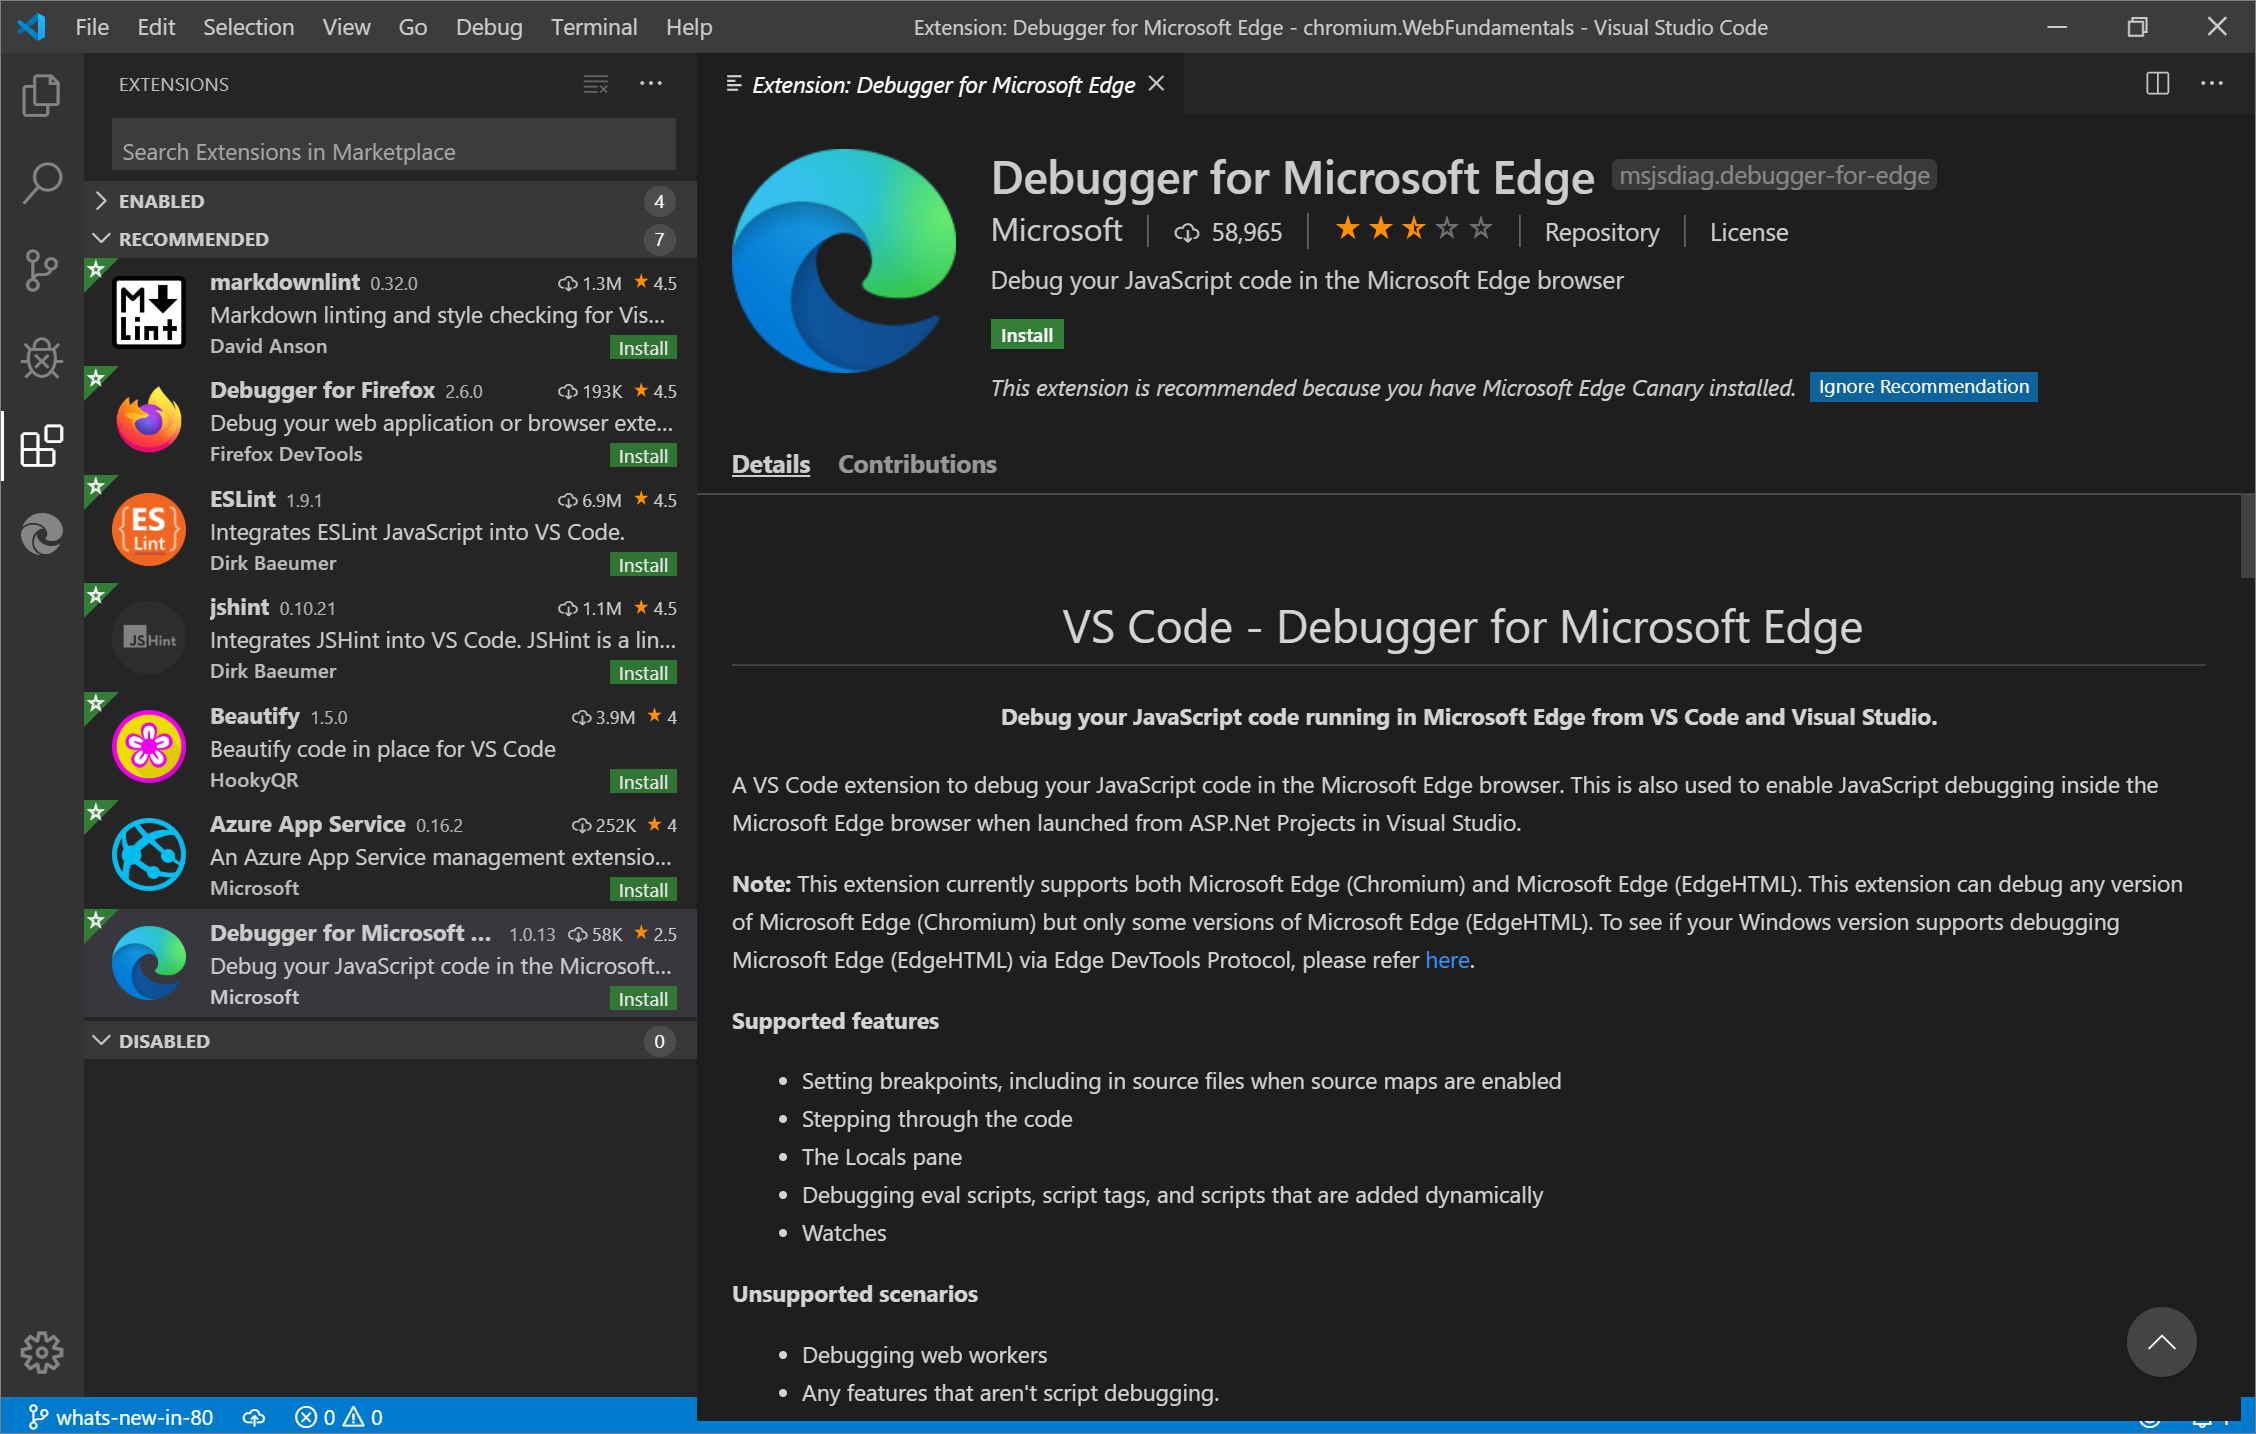
Update: As of 2022, the Debugger for Microsoft Edge Visual Studio Code extension has been replaced by a built-in debugger for Microsoft Edge in Visual Studio Code. See Debug Microsoft Edge in Visual Studio Code.
webhint
The webhint Visual Studio Code extension uses webhint to improve your web page while you are writing it. This extension runs and reports diagnostics on your workspace files based on webhint analysis.
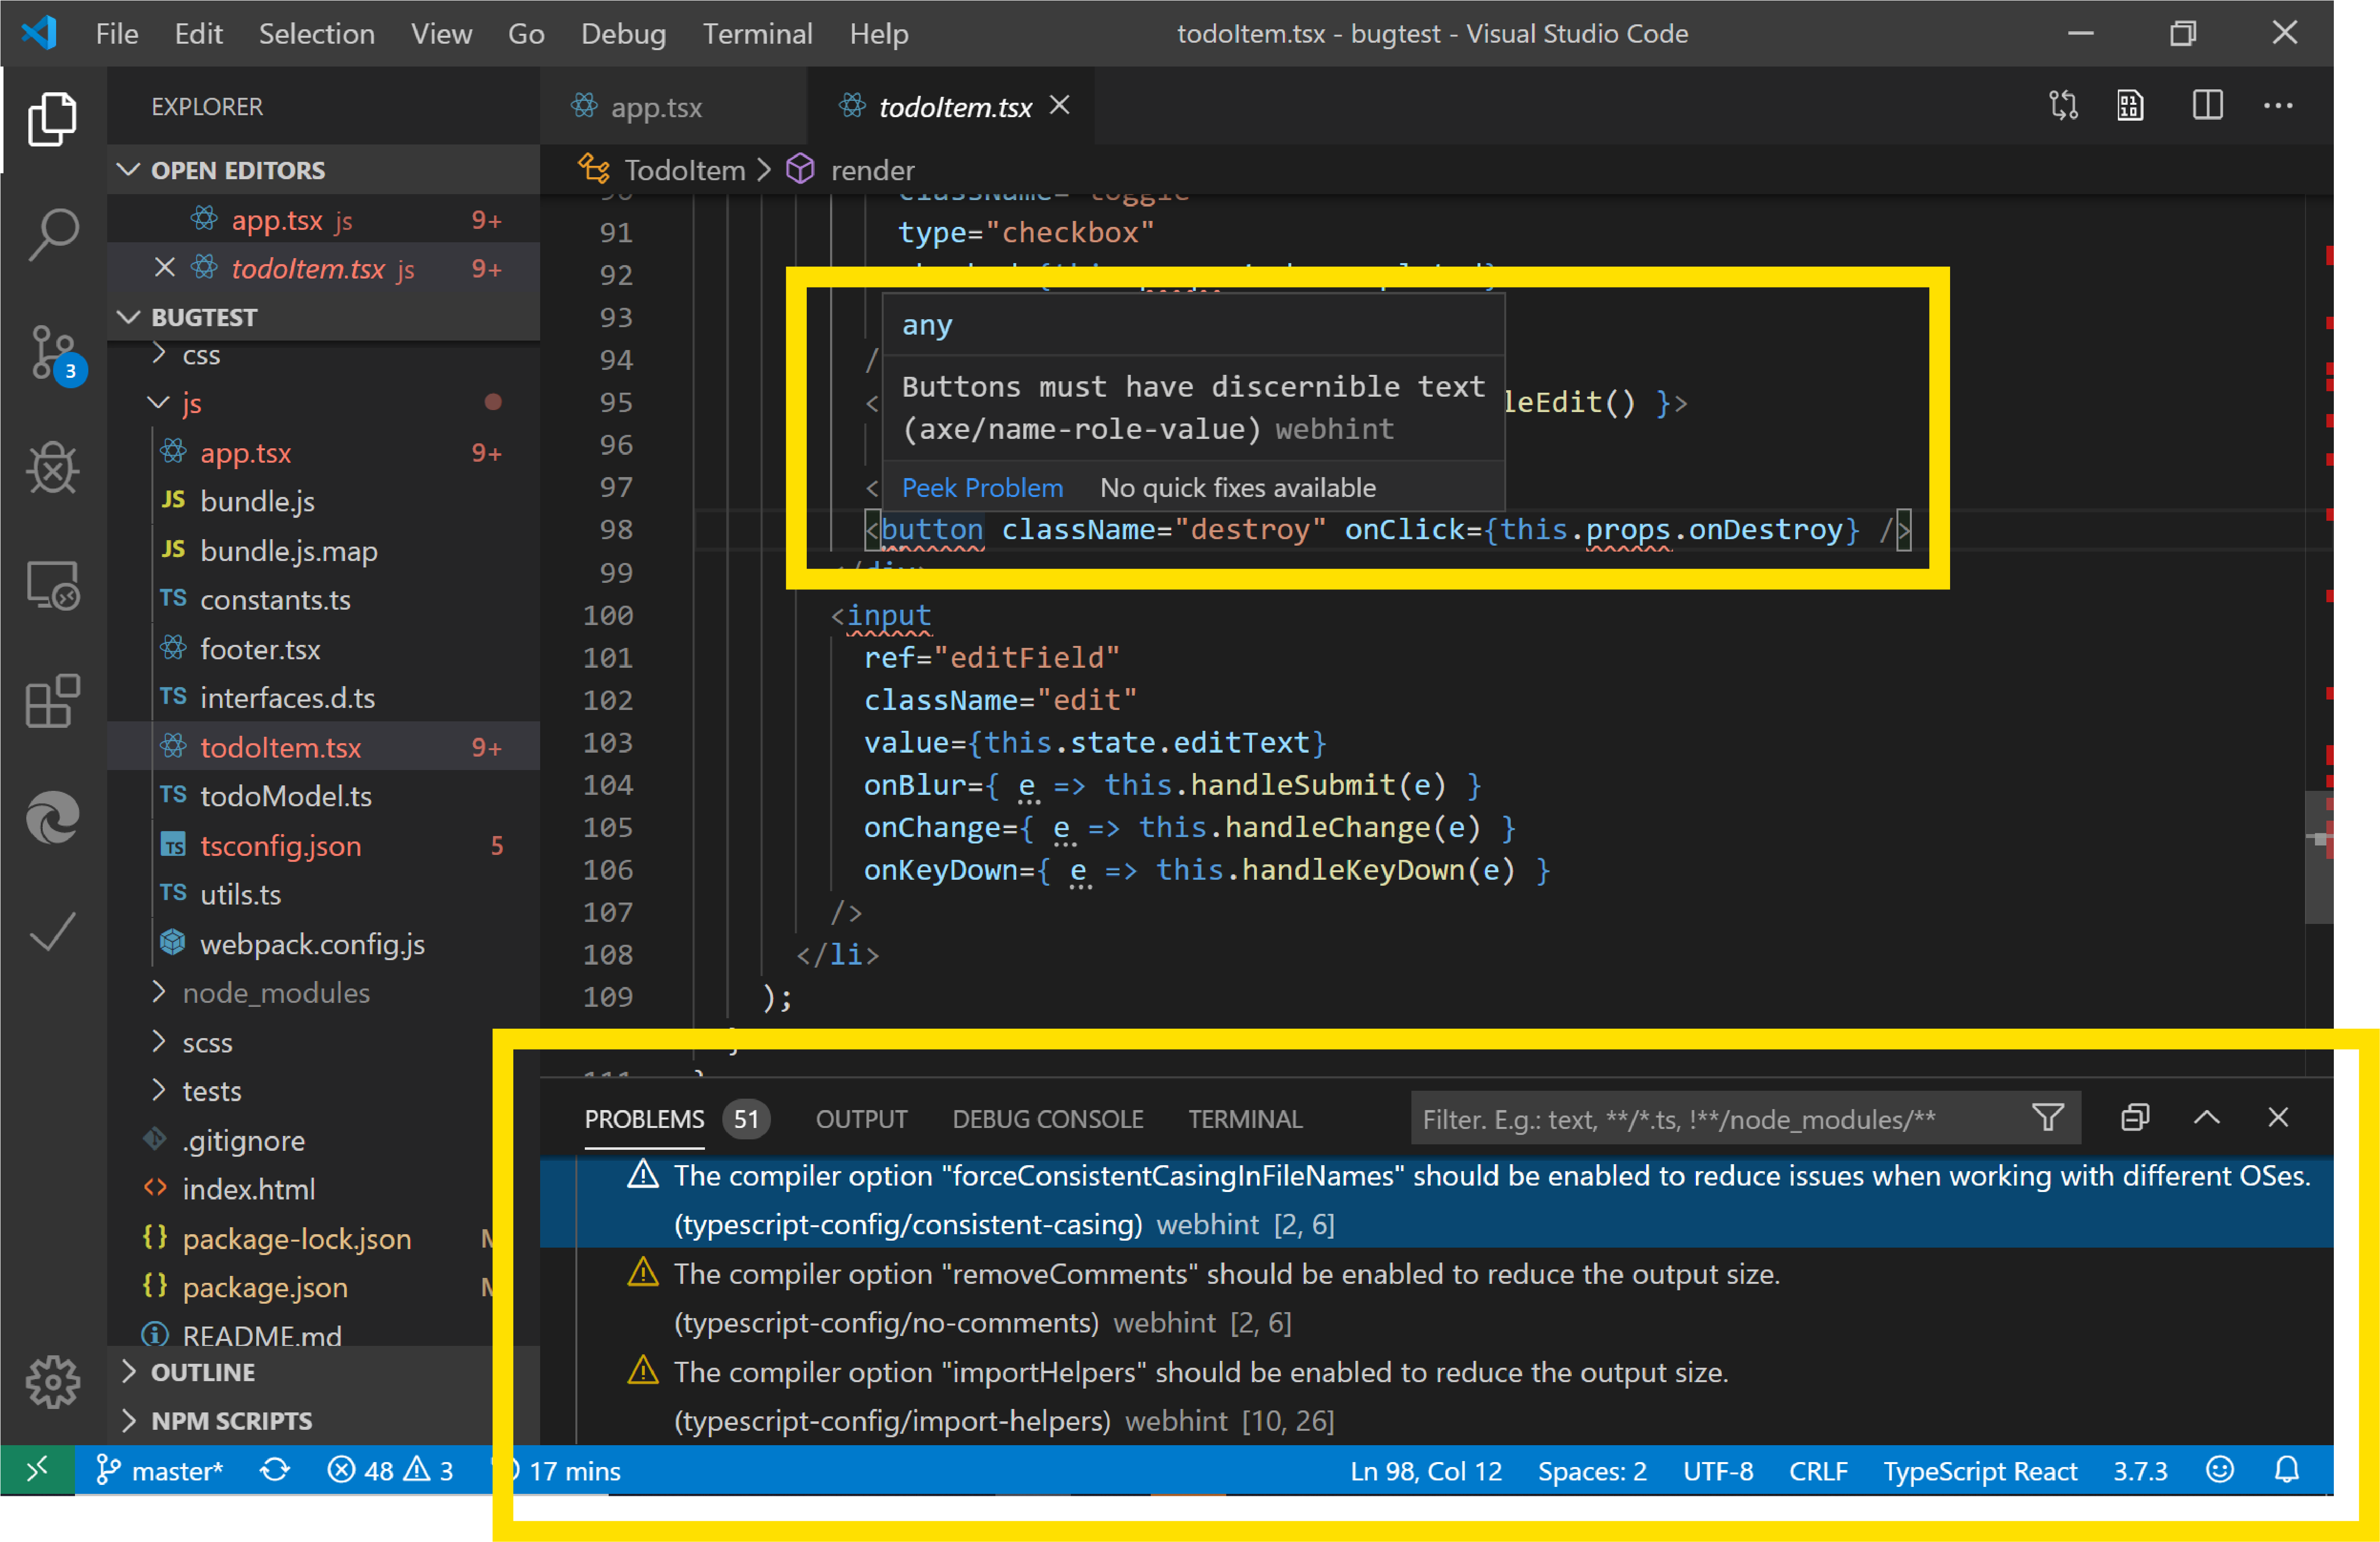
Learn more about the Visual Studio Code webhint extension.
See also:
Visual Studio integration
In Visual Studio 2019 version 16.2 or later, use the Visual Studio debugger to debug JavaScript running in Microsoft Edge. Download Visual Studio 2019 to try this feature out!
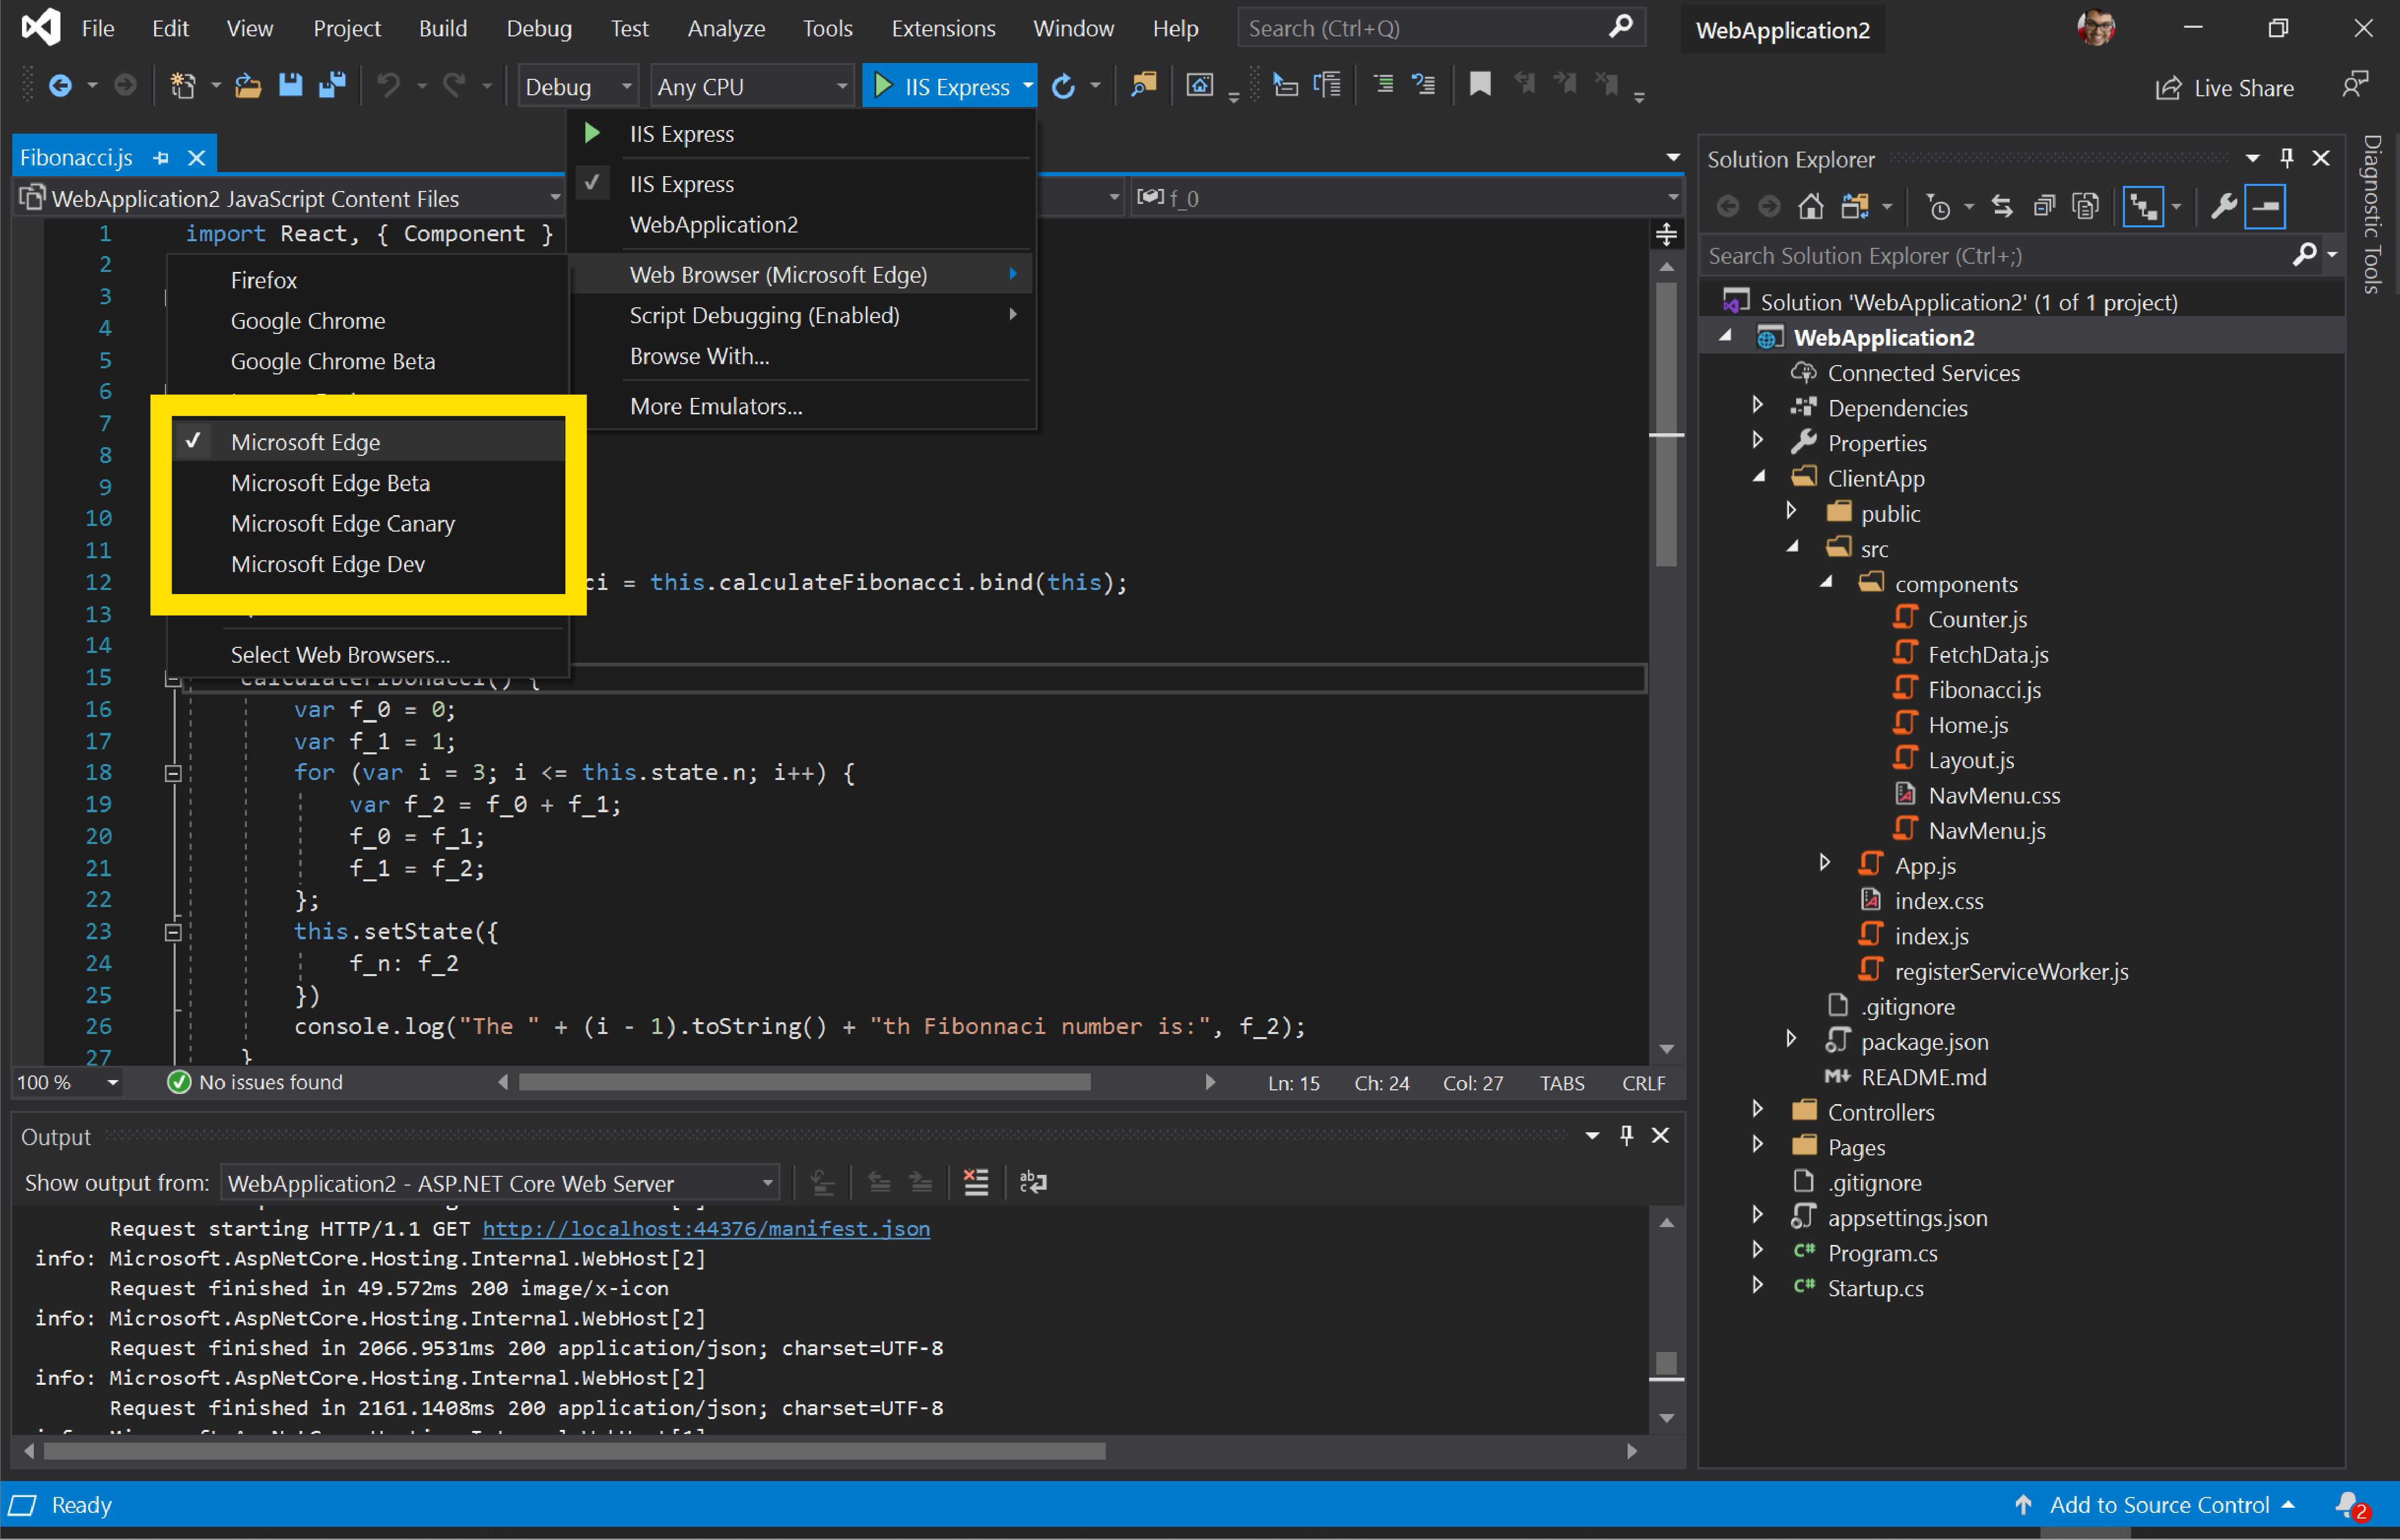
To learn more about debugging Microsoft Edge from Visual Studio, see Visual Studio for web development.
Tracking prevention Console messages
Tracking prevention is a unique feature in Microsoft Edge that protects you from being tracked by websites you have not visited before. The default tracking prevention setting is Balanced mode, which blocks 3rd party trackers and known malicious trackers for an experience that balances privacy and web compatibility. To give you more insight into the compatibility of your web page when certain trackers are blocked, warning messages were added in the Console when a tracker is blocked.
![]()
Read more about tracking prevention and the balance between privacy and web compatibility.
See also:
Announcements from the Chromium project
The following sections announce additional features available in Microsoft Edge 81 that were contributed to the open source Chromium project.
Moto G4 support in Device Mode
After enabling the Device Toolbar, simulate the dimensions of a Moto G4 viewport from the Device list.
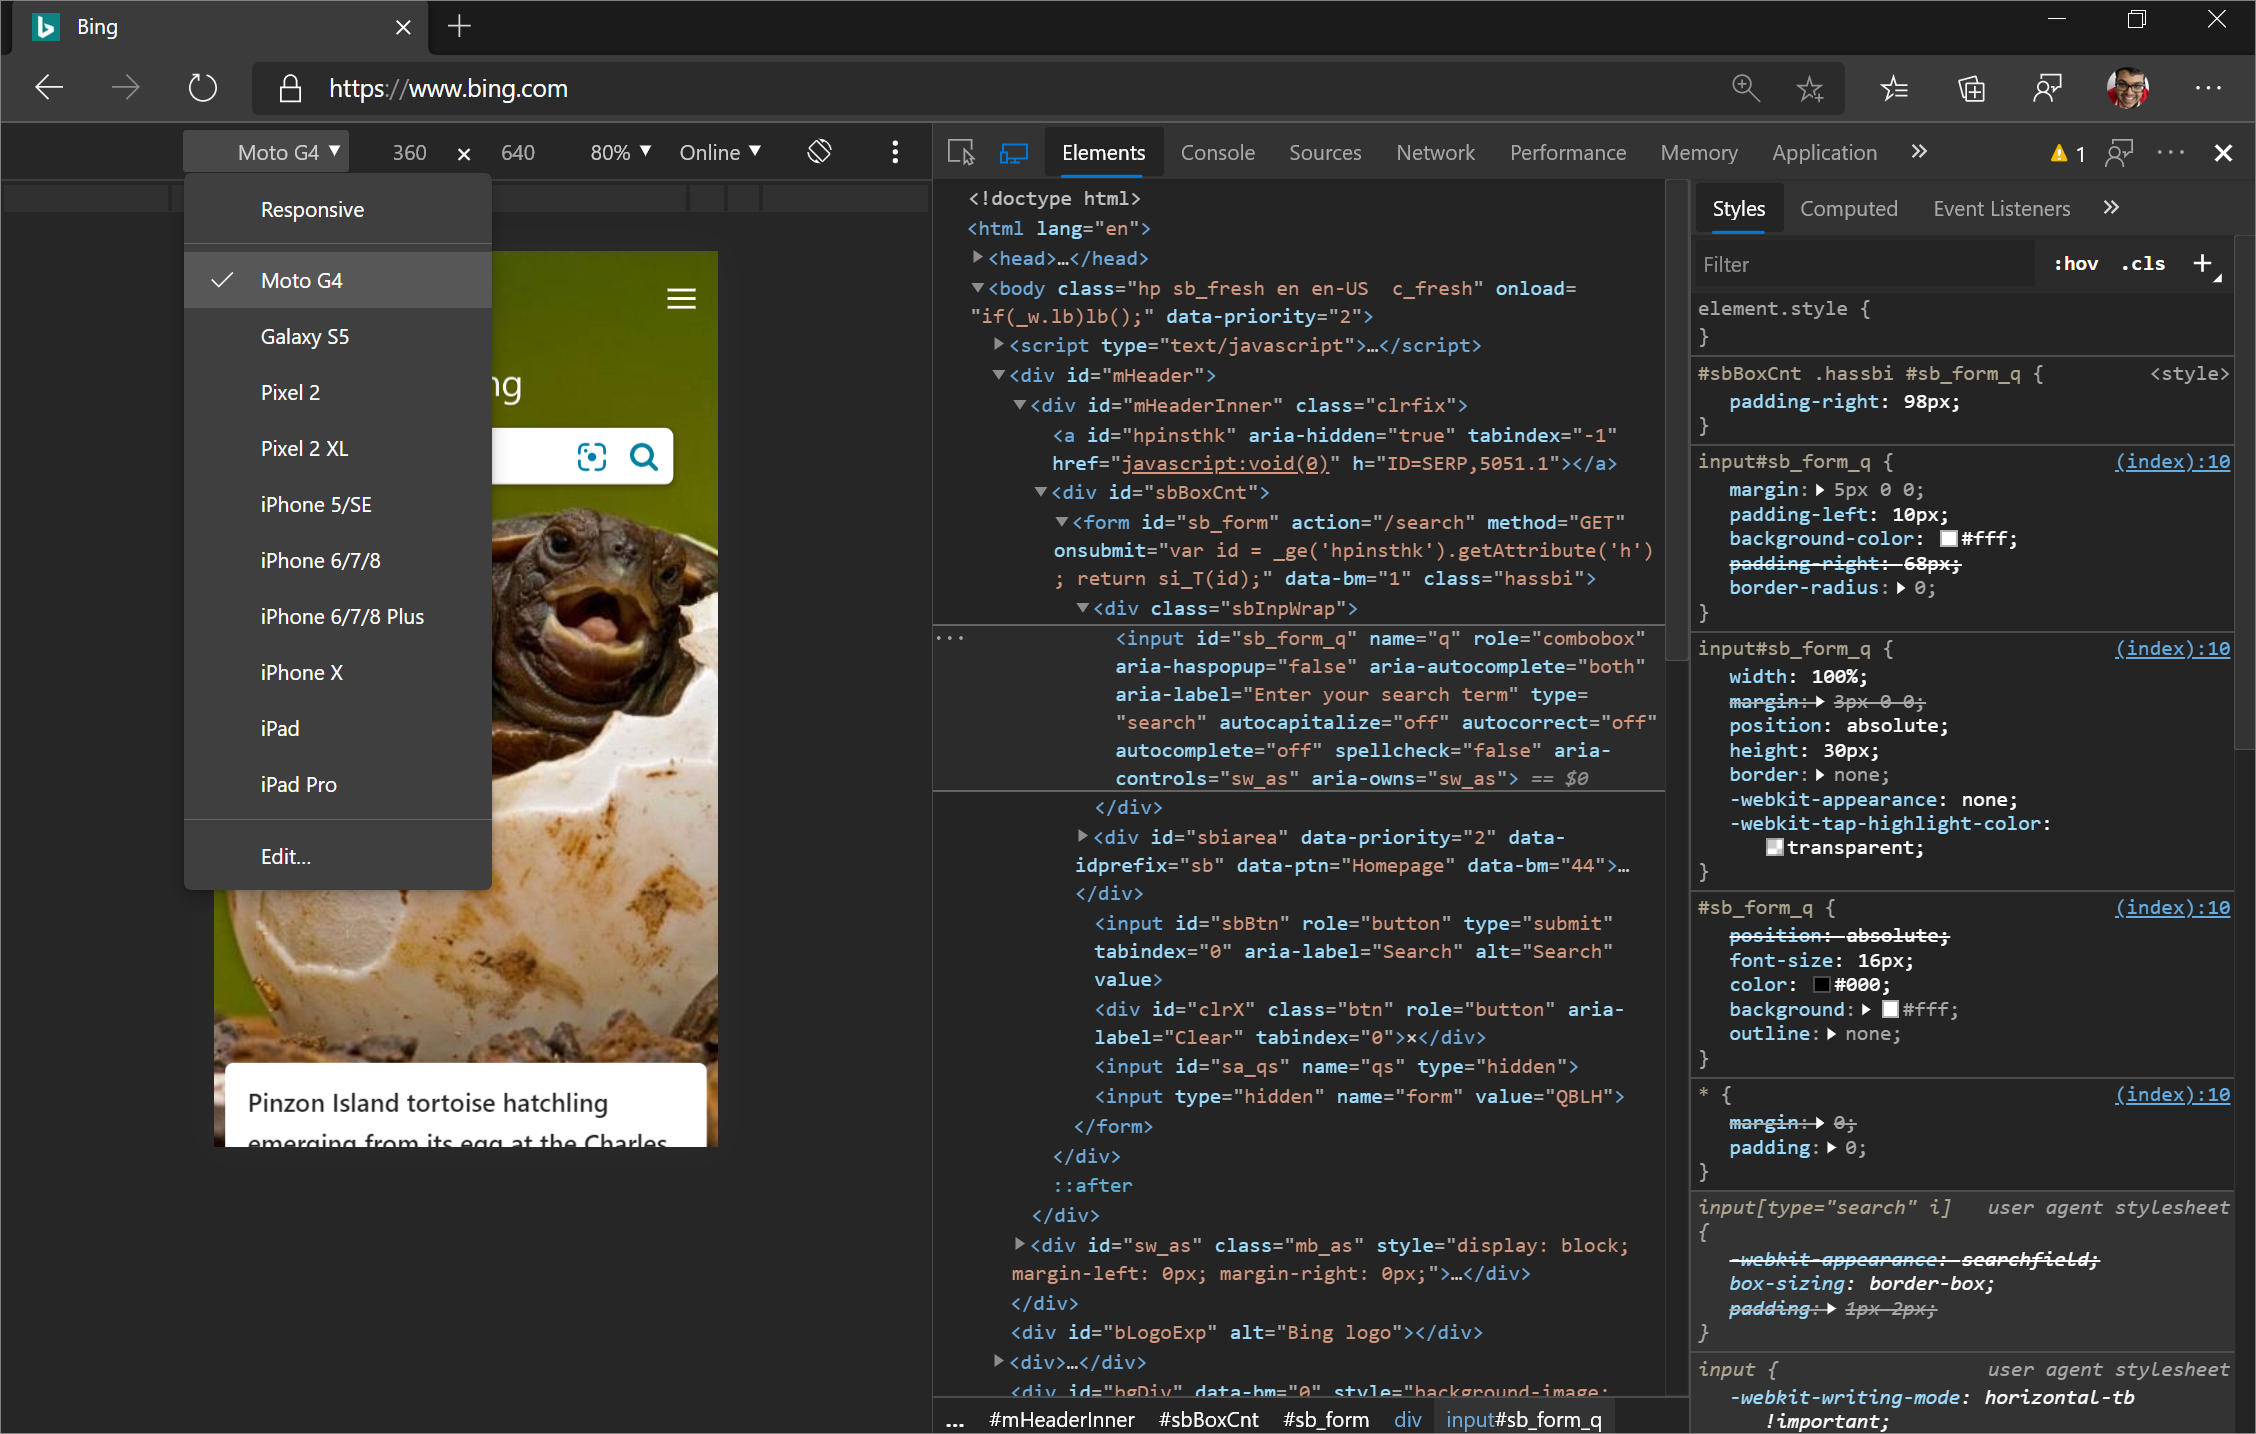
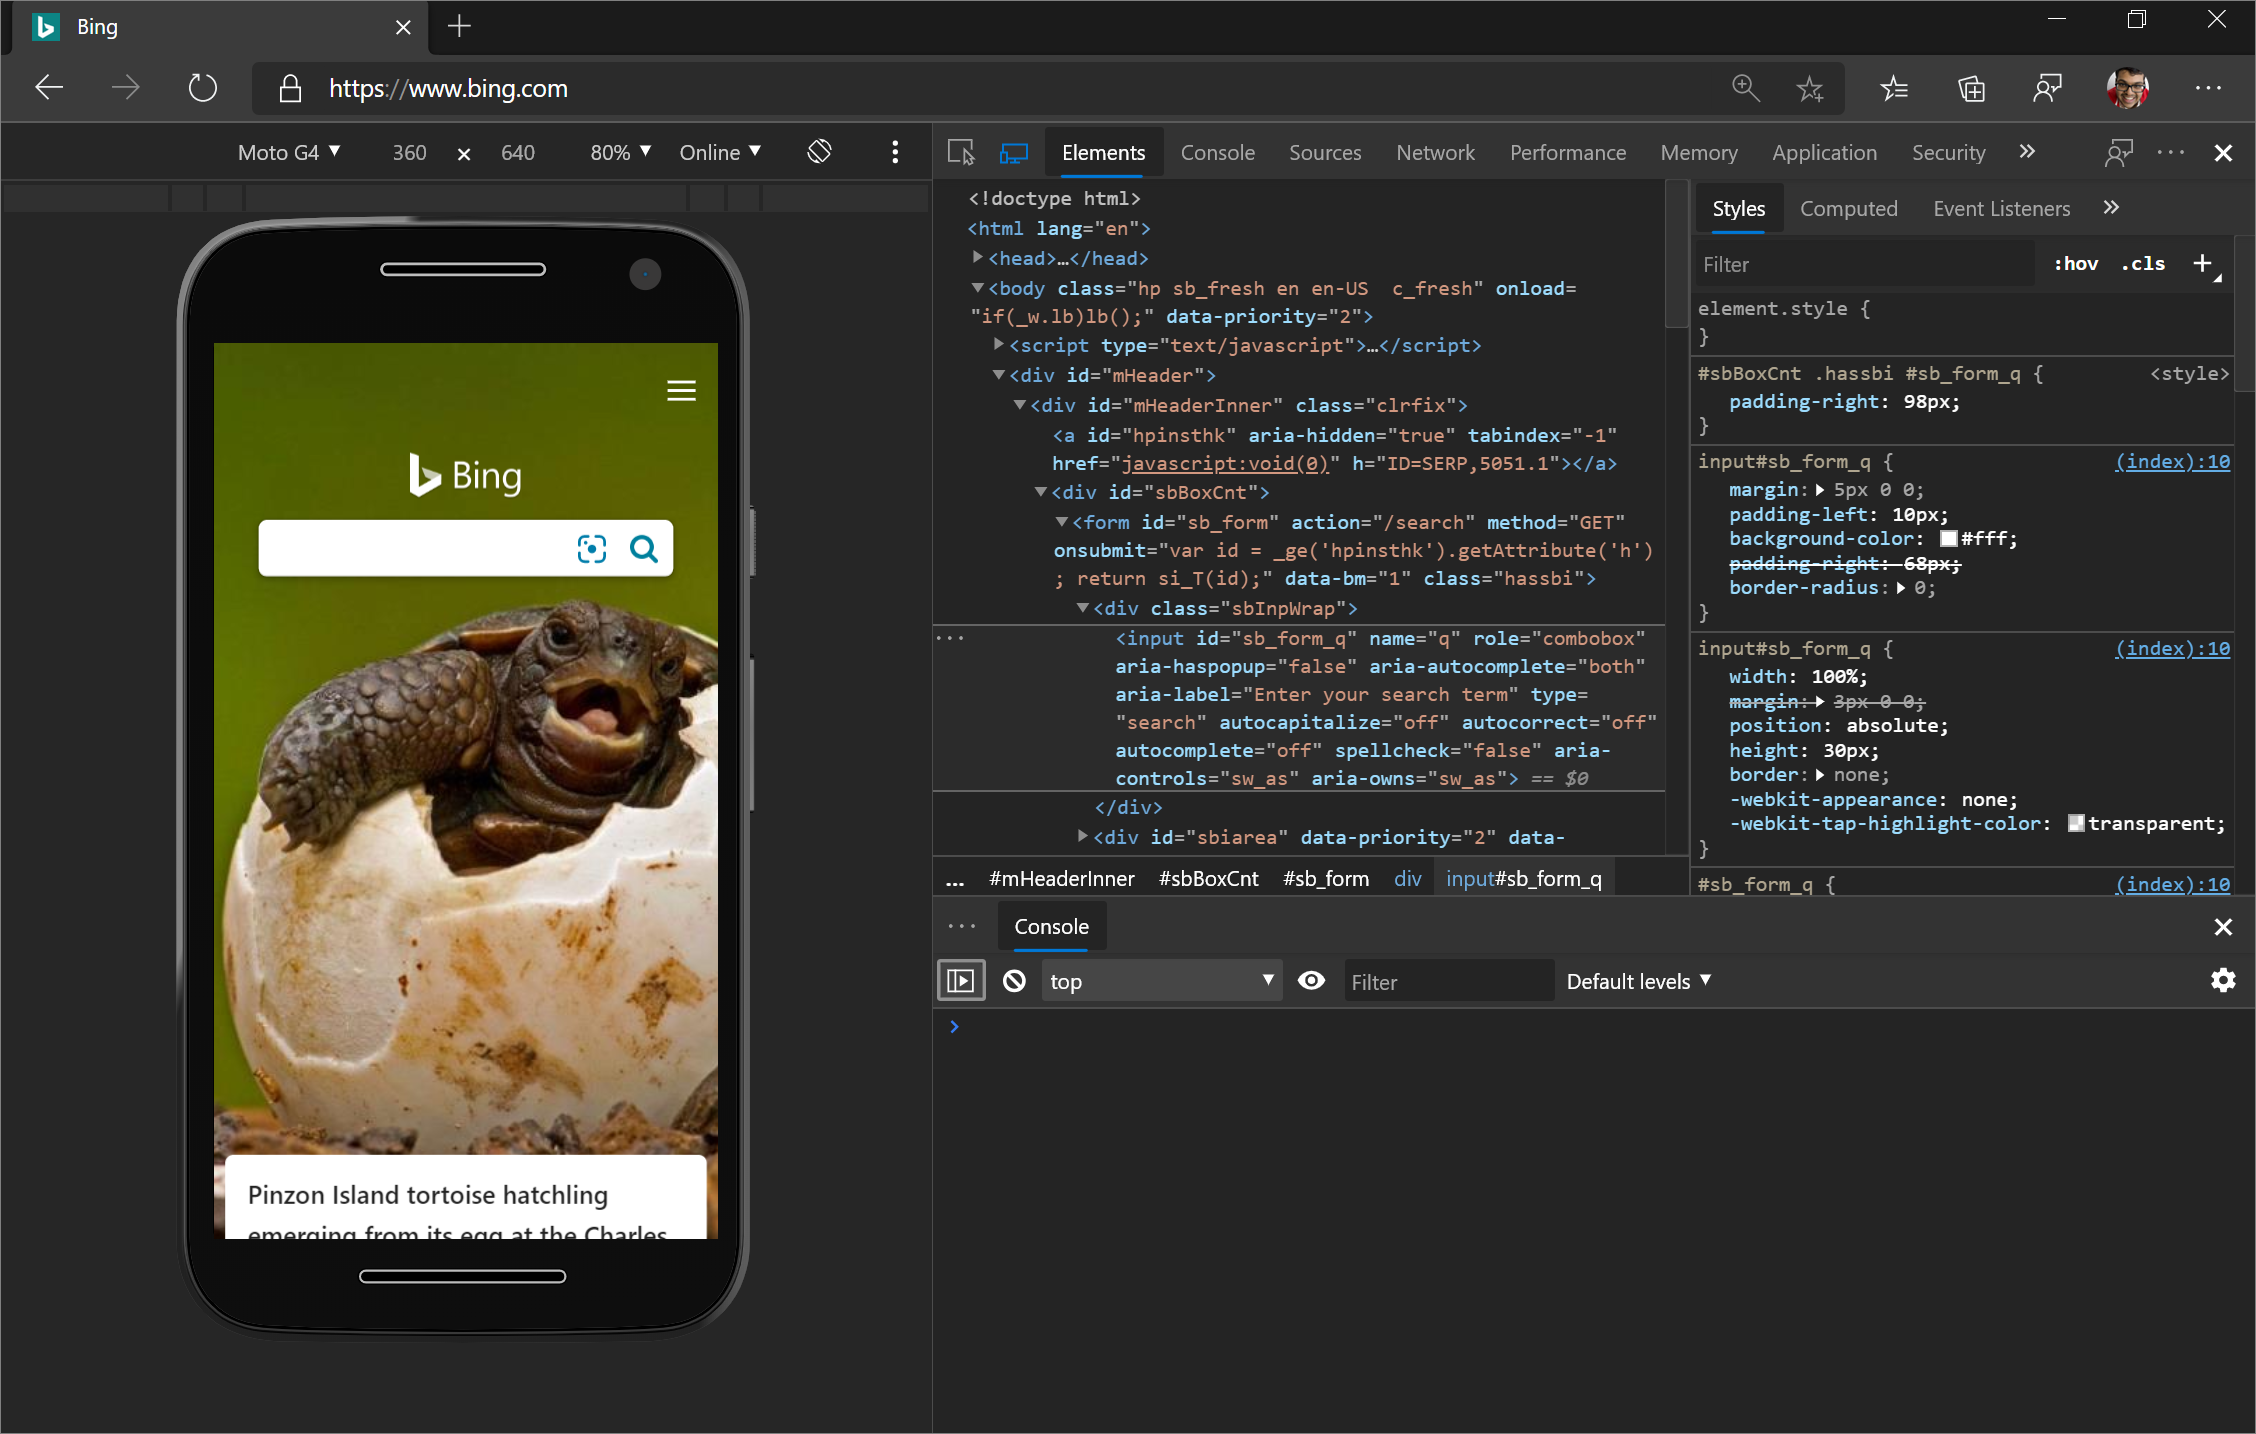
Click Show Device Frame to show the Moto G4 hardware around the viewport.
Related features:
- Open the Command Menu and run the
Capture screenshotcommand to take a screenshot of the viewport that includes the Moto G4 hardware (after enabling Show Device Frame). - Throttle the network and CPU to more accurately simulate a mobile user's web browsing conditions.
Chromium issue #924693
Cookie-related updates
See also:
- View, edit, and delete cookies
- Display cookies in Network features reference
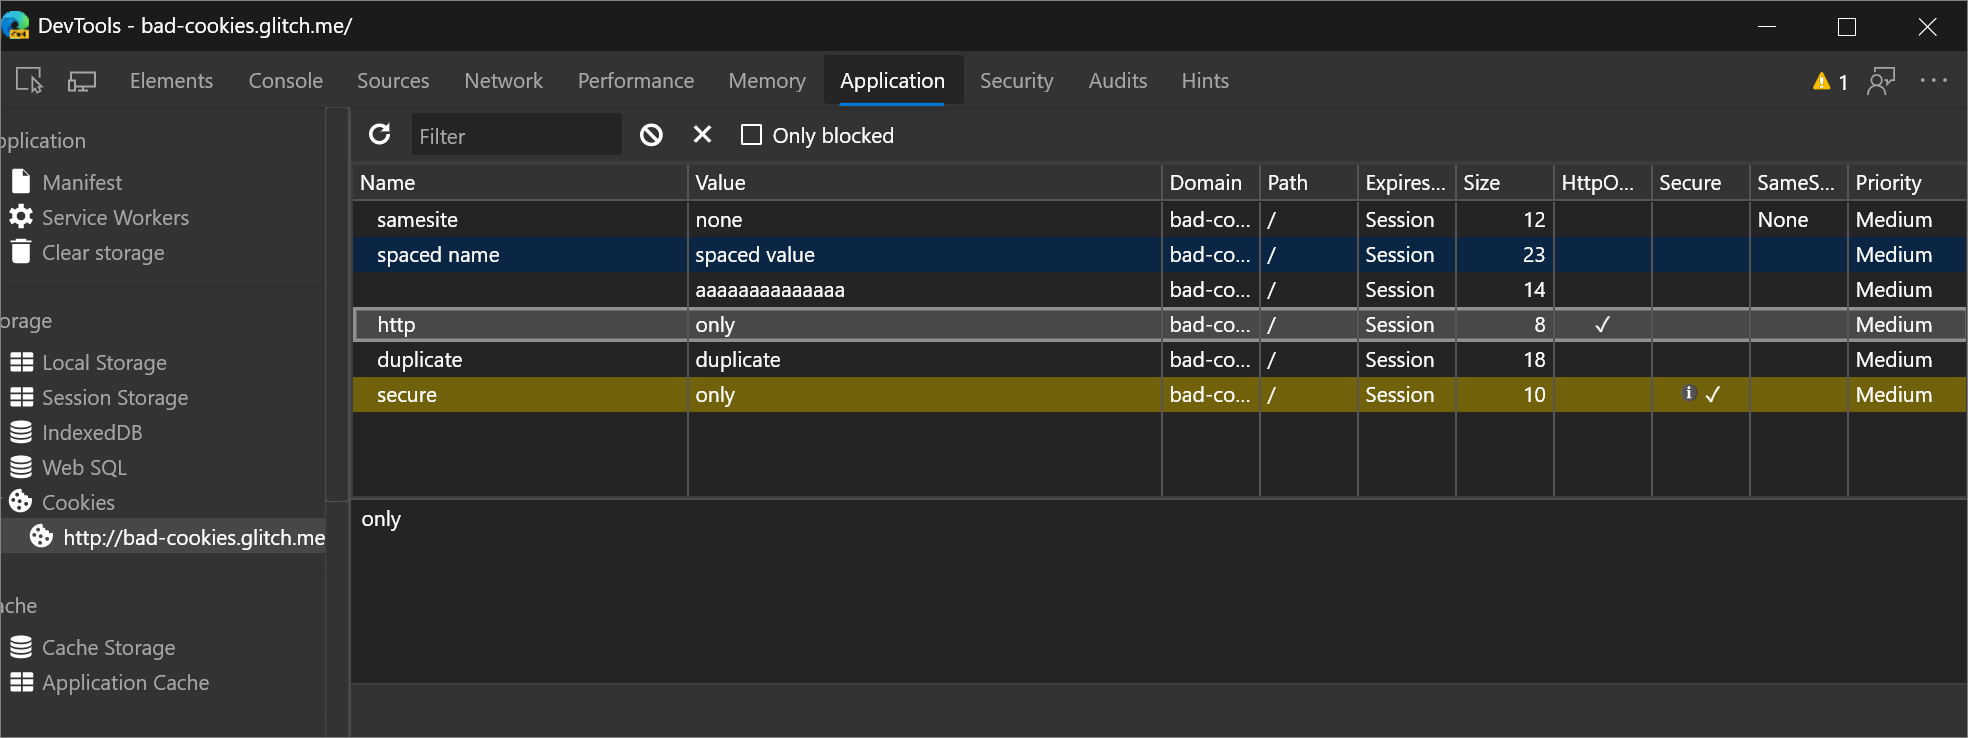
Blocked cookies in the Cookies pane
The Cookies pane in the Application panel now displays blocked cookies with a yellow background.
Chromium issue #1030258
Cookie priority in the Cookie pane
The Cookies tables in the Network and Application tools now include a Priority column.
Caution: Chromium-based browsers, like Microsoft Edge, are the only browsers that support cookie priority.
Chromium issue #1026879
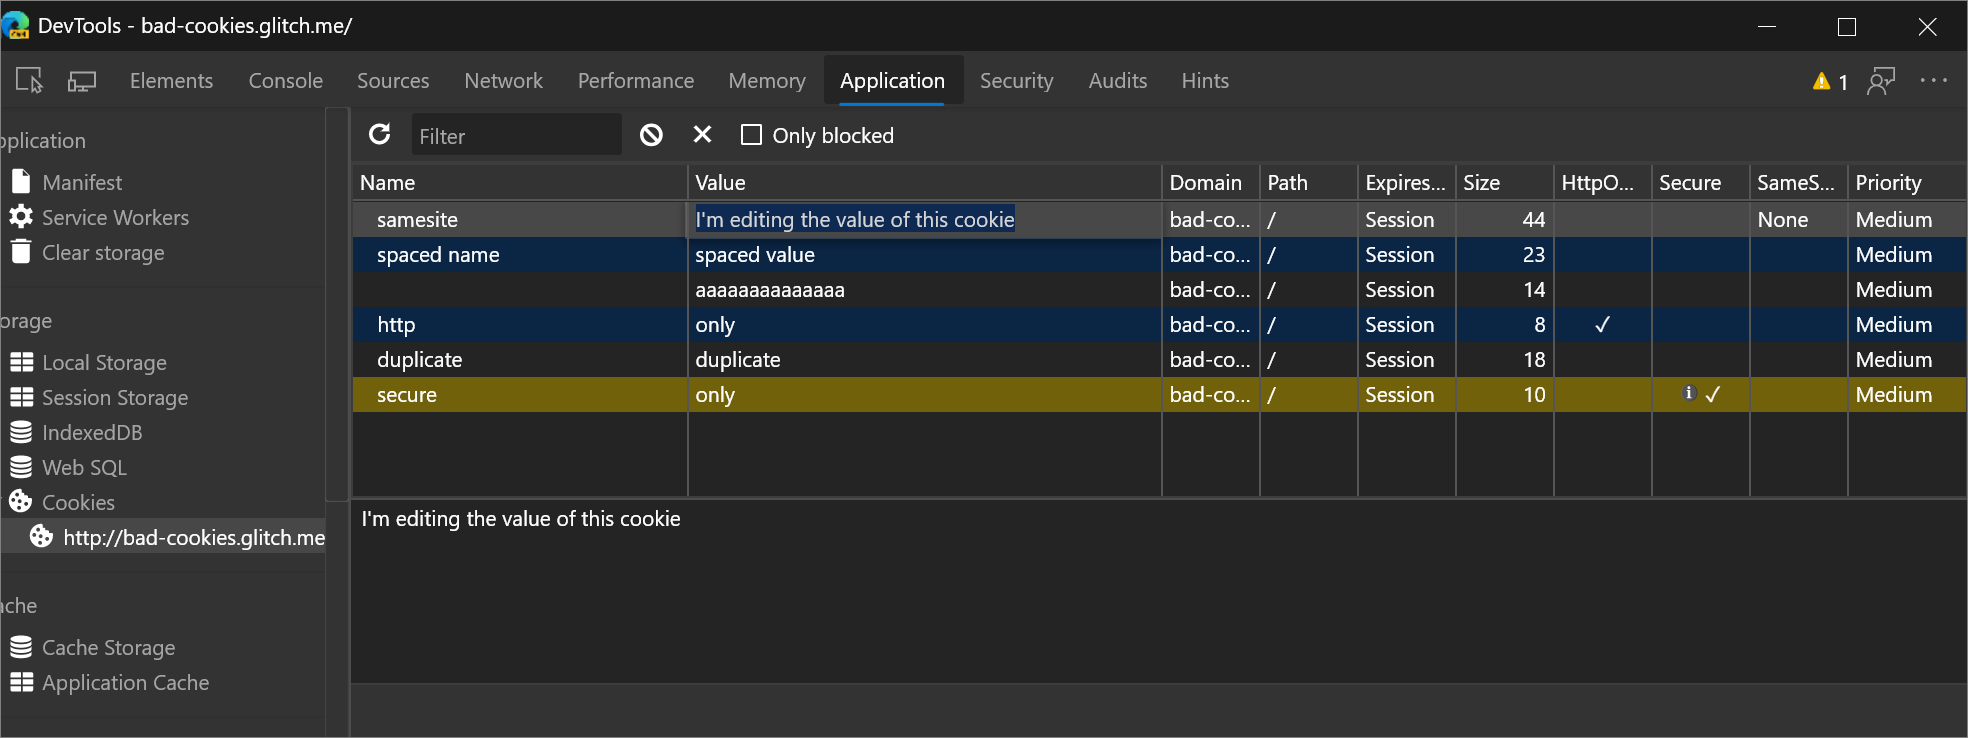
Edit all cookie values
All cells in the Cookie tables are editable now, except cells in the Size column because that column represents the network size of the cookie, in bytes. For an explanation of each column, see Fieldsin View, edit, and delete cookies.
Copy as Node.js fetch to include cookie data
To get a fetch expression that includes cookie data, right-click a network request, and then select Copy > Copy as Node.js fetch.
Chromium issue #1029826
More accurate web app manifest icons
Previously, the Manifest pane in the Application panel sent its own requests in order to display web app manifest icons. DevTools now shows the exact same manifest icon that Microsoft Edge uses.
Chromium issue #985402
See also:
- Open the Cookies pane in View, edit, and delete cookies
Hover on CSS content properties to display unescaped values
In the Styles pane of the Elements tool, to display the unescaped version of a value of a content property, hover on the value.
For example, in this demo when you inspect the p::after pseudo-element an escaped string is displayed in the Styles pane:
When you hover on the content value, the unescaped value is displayed.
See also:
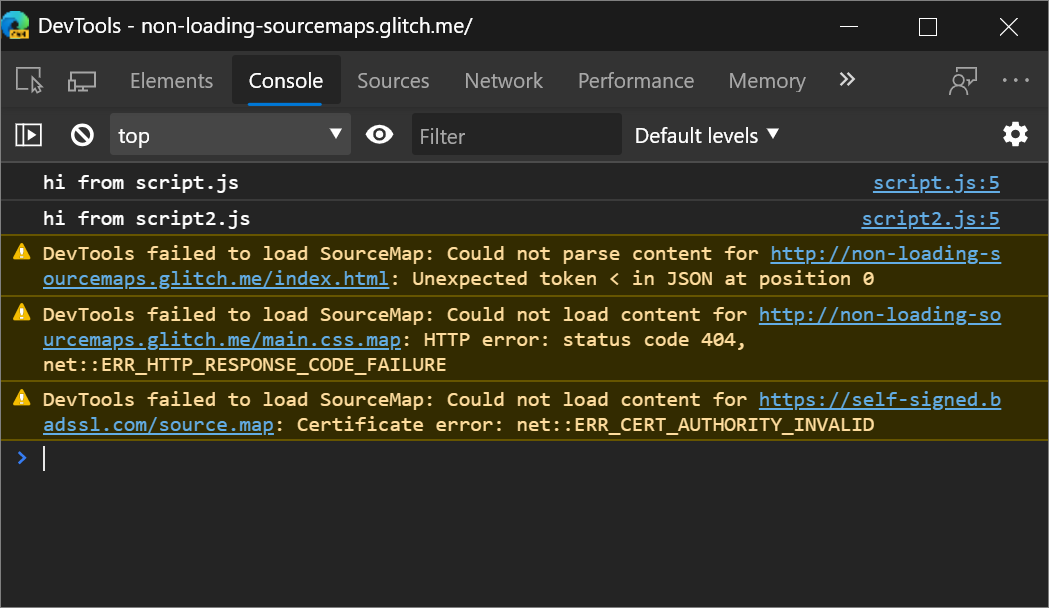
More detailed source map errors in the Console
The Console now provides more detail on why a source map failed to load or parse. Previously it just provided an error without explaining what went wrong.
See also:
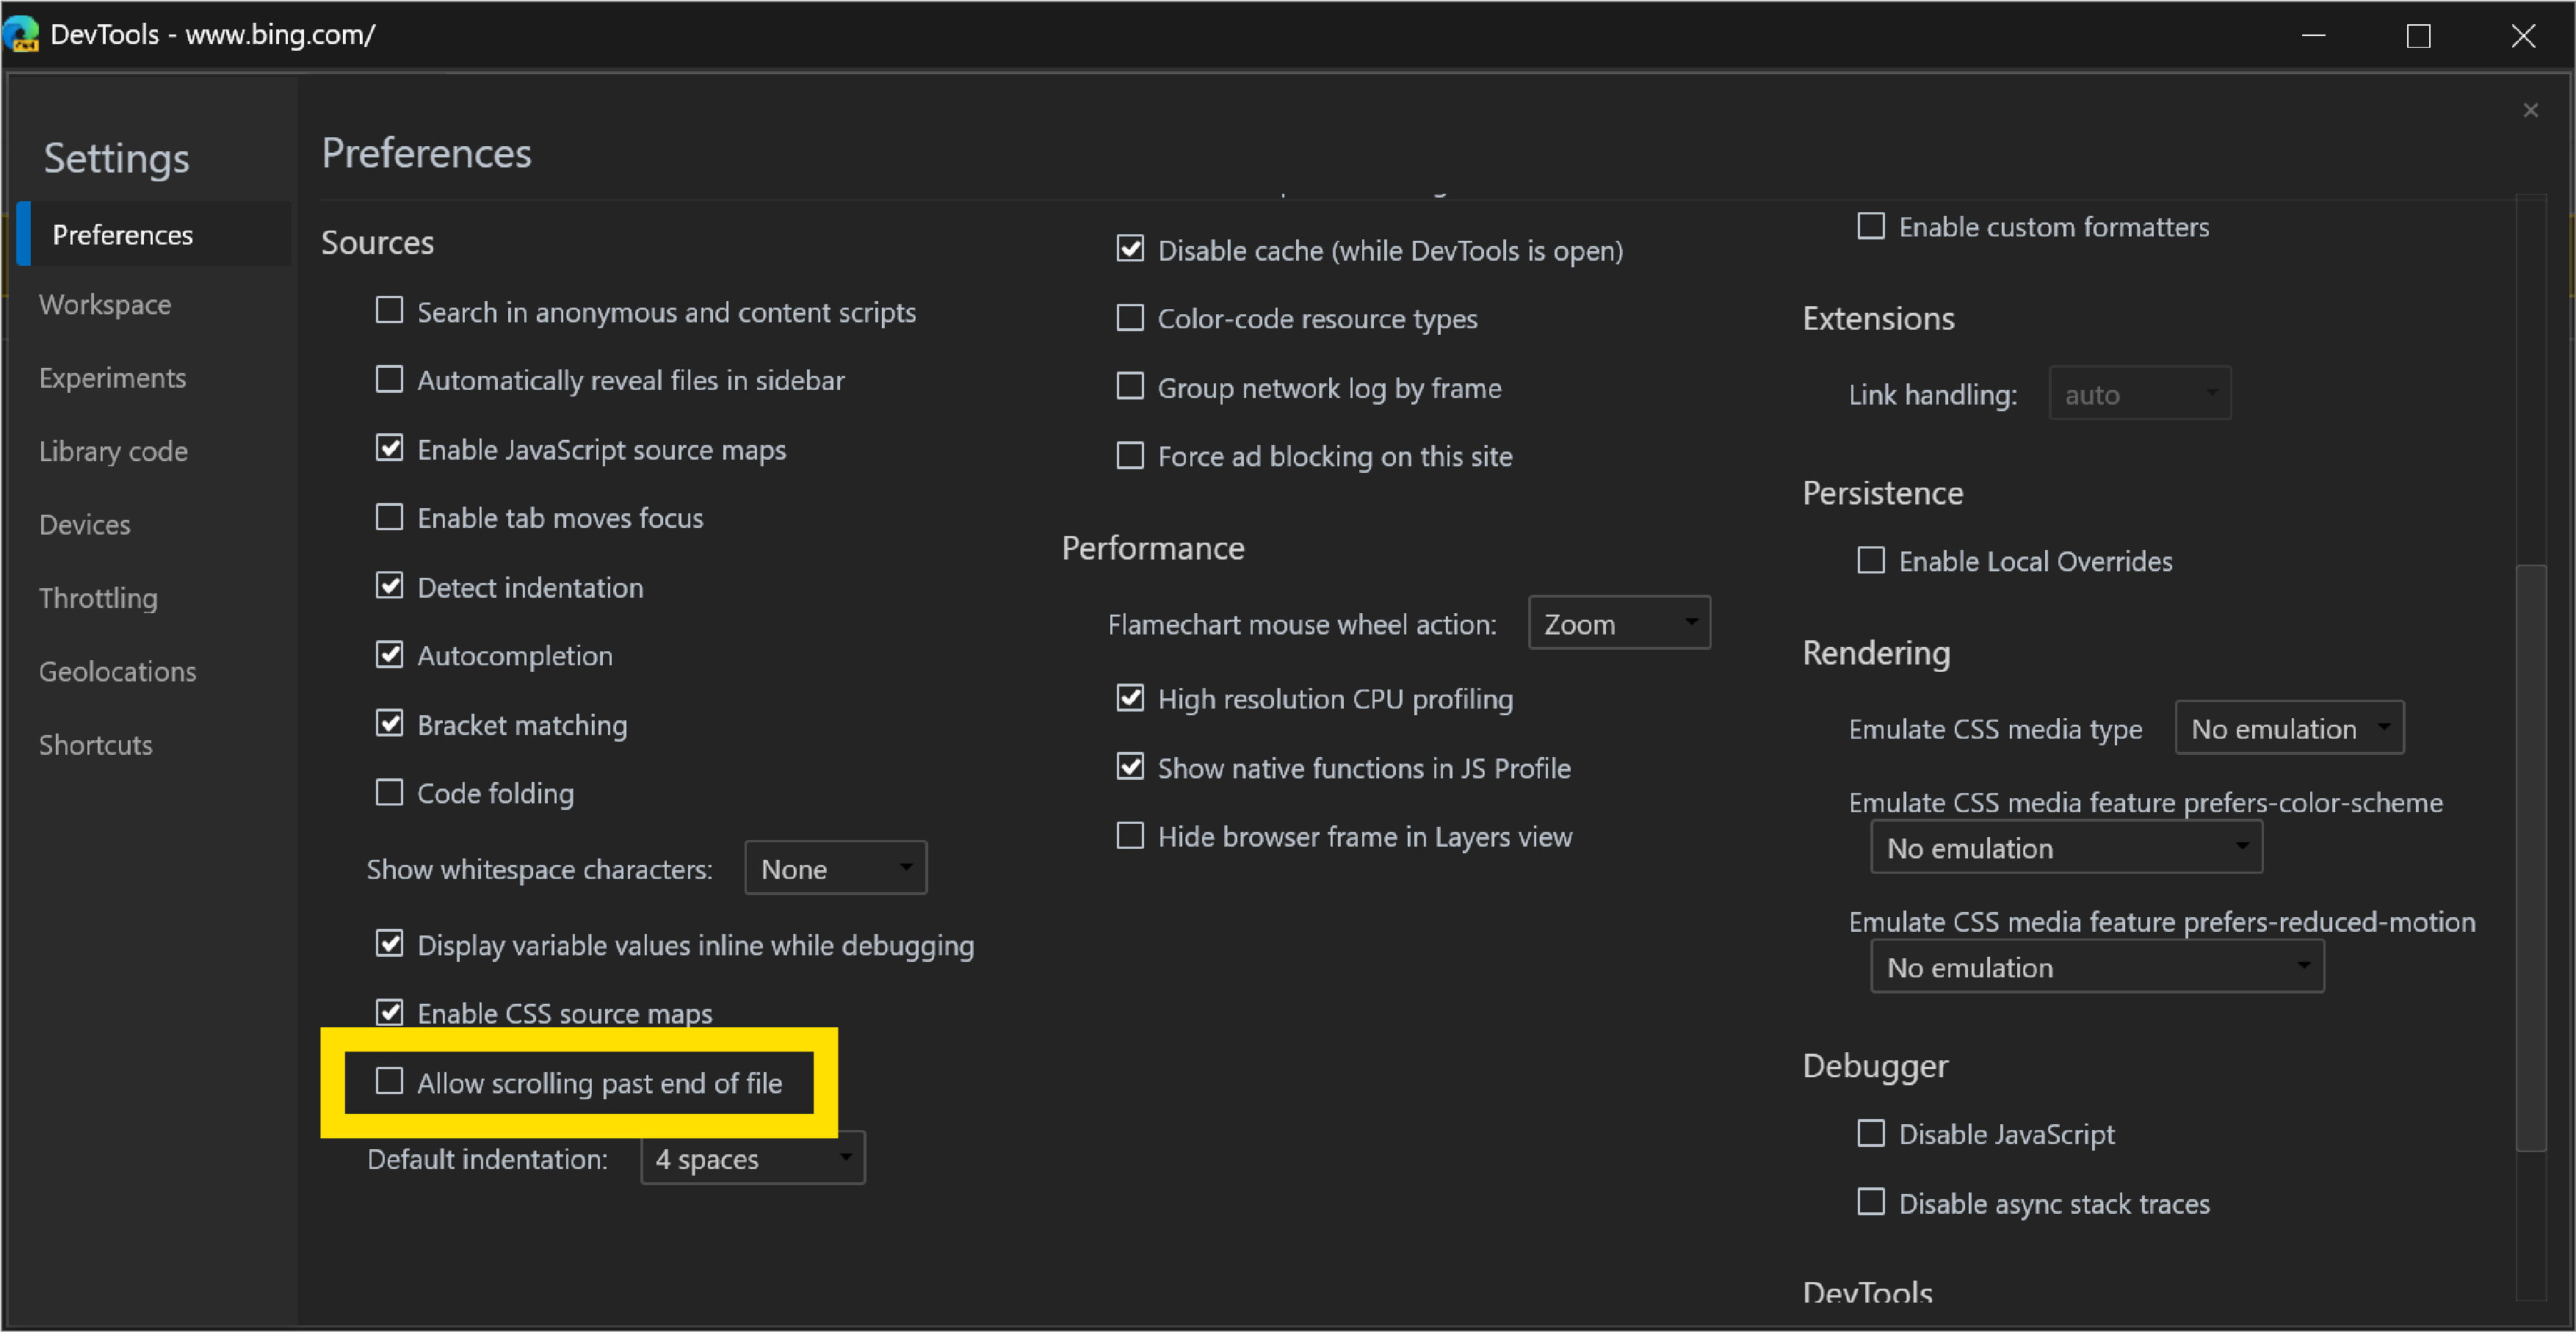
Setting for disabling scrolling past the end of a file
To prevent the default UI behavior that allows you to scroll well past the end of a file in the Sources panel, open Settings and then clear the checkbox Preferences > Sources > Allow scrolling past end of file.
See also:
- Using the Editor pane to view or edit files in Sources tool overview.
Note
Portions of this page are modifications based on work created and shared by Google and used according to terms described in the Creative Commons Attribution 4.0 International License. The original page is found here and is authored by Kayce Basques.
![]() This work is licensed under a Creative Commons Attribution 4.0 International License.
This work is licensed under a Creative Commons Attribution 4.0 International License.