Issue diagnosis
During the monitoring of your private mobile network, you may find network issues. For example, a connection or a network function may not work as expected. In this case, you can use the distributed tracing tool, a network issue diagnostic tool that Azure Private 5G Core offers, to diagnose the issues reported.
The distributed tracing tool allows you to collect detailed traces for signaling flows involving a packet core instance. Each trace represents the results of a distinct occurrence of a network activity. Through a web graphical user interface (GUI), you can use traces to diagnose many common configuration, network, and interoperability problems affecting network services.
The distributed tracing tool is available from the ASE on which the packet core instance runs. As the tool resides within each site in your private mobile network, it doesn't have much reliance on network bandwidth or cloud connectivity. With the tool, you can quickly diagnose network issues and minimize their impact on your network services.
Important
To effectively diagnose issues in your private mobile network, you need to be familiar with the network functions that Azure Private 5G Core provides. For more information about the network functions, see Packet core architecture.
If you can't find the root cause of an issue with the distributed tracing tool, Azure Private 5G Core allows you to collect a diagnostics package from the relevant site. The package can then be used by Azure support engineers to assist you. In addition, Azure Private 5G Core allows you to use the UPF Trace (UPFT) tool to do data plane packet analysis.
Video: Issue diagnosis
The following video provides an overview of how to diagnose issues in Azure Private 5G Core:
Access the distributed tracing tool
The URL for accessing the distributed tracing tool is as follows:
https://<LocalMonitoringIP>/sas
Here <LocalMonitoringIP> is the IP address for accessing the local monitoring tools that you set up when you configure the management network during Azure Private 5G Core deployment.
Azure Private 5G Core provides two authentication methods for the distributed tracing tool:
- Microsoft Entra: The Microsoft Entra method allows users to sign in with their Azure accounts.
- Username and password: The username/password method allows users to sign in with a default account.
Whenever possible, use the Microsoft Entra method, as it's more secure. Only use the username and password method when you don't have a stable connection to Azure. You can choose your preferred authentication method when you deploy or modify a site. For detailed instructions on configuring and using these authentication methods, see Distributed tracing.
Access to the distributed tracing tool is secured by HTTPS. You can use a self-signed certificate or provide your own to authenticate access to the tool. The article Modify the local access configuration in a site provides detailed instructions on checking or modifying the access certificate.
Diagnostics details that you can check
To help you diagnose issues, the distributed tracing tool provides detailed information about signaling flows and errors through three views:
- The Summary view: The summary of each flow or error.
- The Detailed Timeline view: The sequence of operations and events that occurred during the flow or error.
- The Call Flow view: The sequence of messages flowing between components during the course of the flow or error.
Each entry in the Detailed Timeline view represents an event. The entry includes the date and time at which the event occurred and the name of the component on which it occurred. You can check the details about each event. Additionally, you can filter the events by different levels. For example, the detailed events level includes the network protocol messages and more fine-grained detail of events.
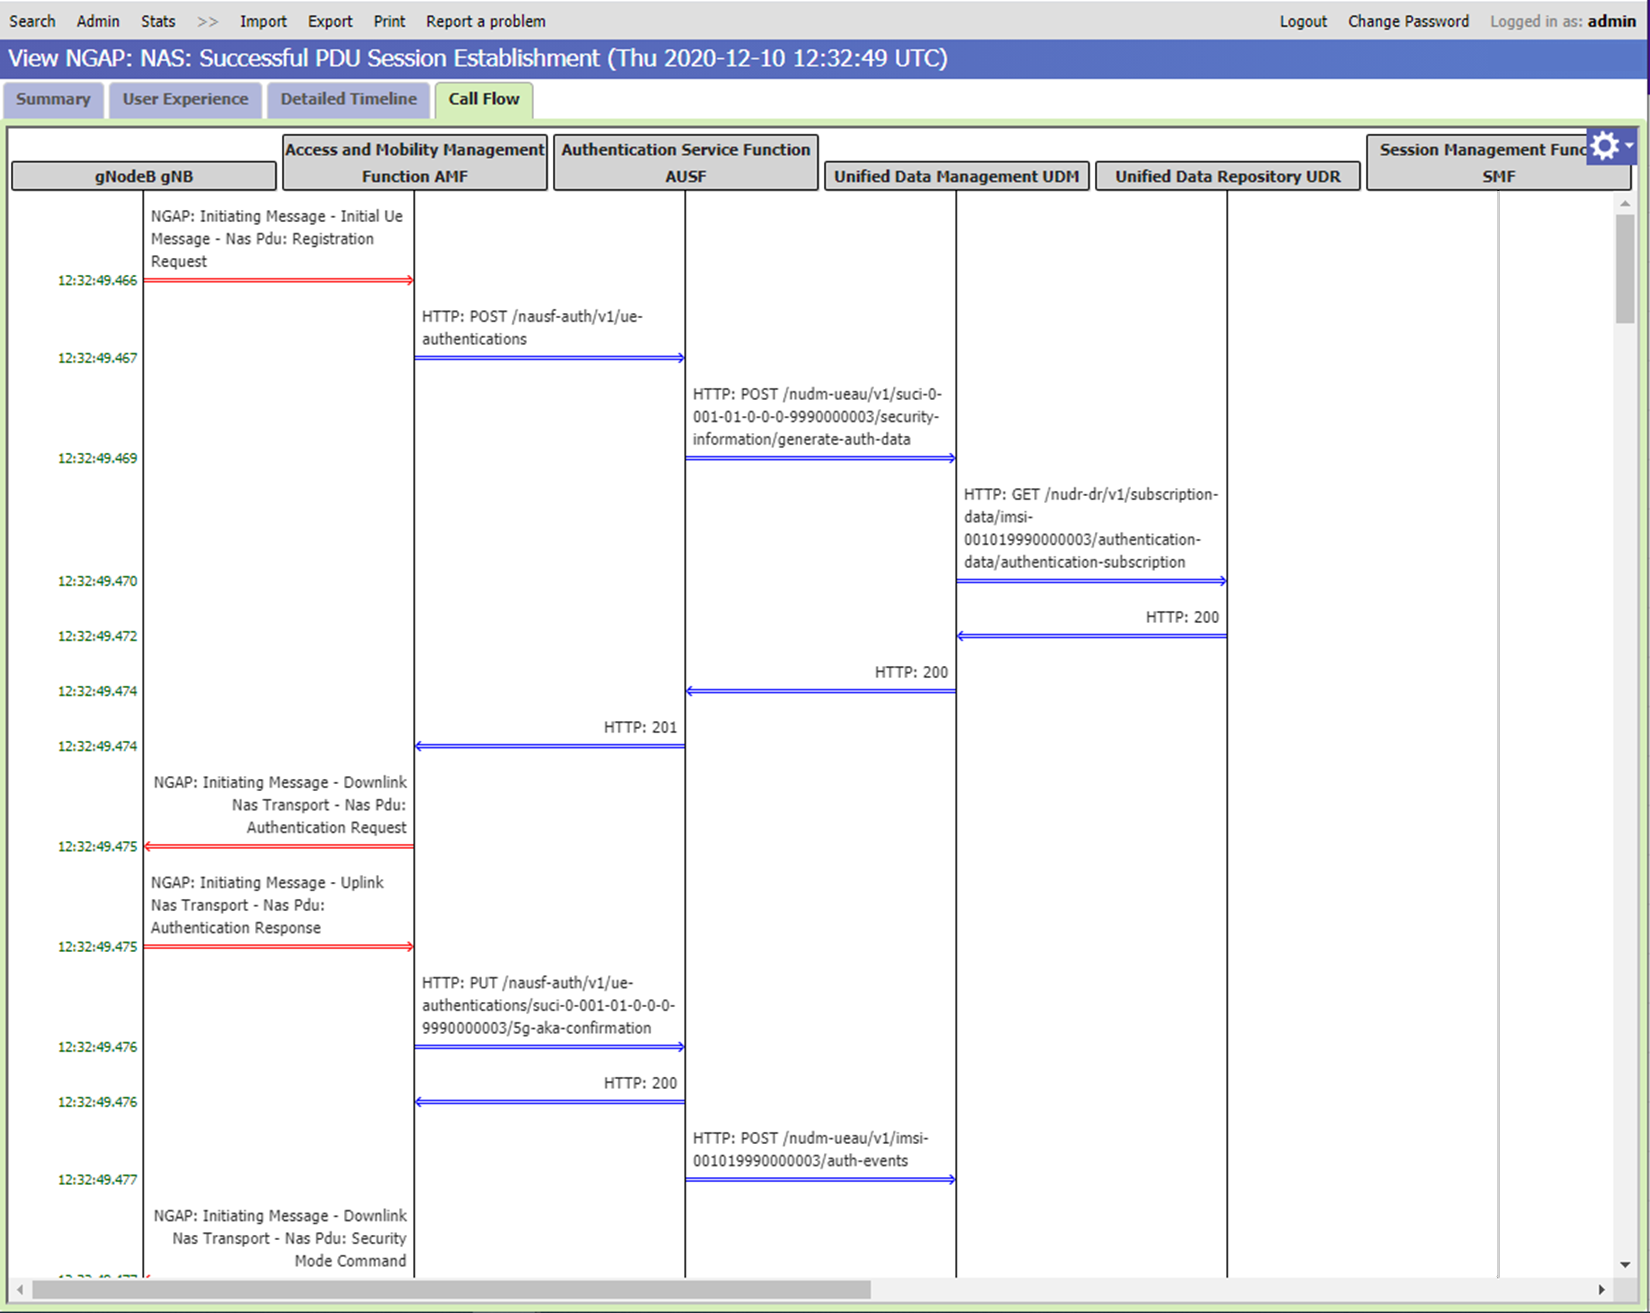
The Call Flow view uses a diagram to visually indicate the messages flowing between network functions. As shown in the following example view, the vertical lines show the network components involved in the flow. The black lines indicate packet core Network Functions that have logged sending or receiving messages for this flow. The gray lines indicate other components that don't log messages. A horizontal line shows each individual signaling message flowing between two network components. An arrow indicates the direction of flow from the sending component to the receiving component. The messages appear in the diagram in the order in which they occurred.
For detailed instructions on using these views, see Distributed tracing.
Search for specific information
To find the root cause of a network issue, you need to find signal flows or errors involving a particular subscriber. The distributed tracing tool allows you to search for activities involving a particular subscriber using their subscription permanent identifier (SUPI) or, in 4G networks, their international mobile subscriber identity (IMSI). For errors, the tool allows you to search for error condition occurrences across all subscribers.
In addition, the distributed tracing tool allows you to use a date/time range to specify a custom time window in which to search for diagnostics data.
Tip
Long search ranges result in slower searches. We recommend that you keep the search range to an hour or less if possible.
For detailed instructions in searching for information in the distributed tracing tool, see Distributed tracing.
An example of network issue diagnosis
Suppose a UE is provisioned for a site in your private mobile network. However, the UE can't communicate with the data network successfully.
To find the root cause of this communication issue, you can take the following steps to diagnose and resolve the issue:
Search for the SUPI of the UE in the distributed tracing tool.
In the search results page, you may see an event that indicates the authentication request of the UE has been rejected. This tells you that there are some authentication issues with the UE.
Select the event to open it.
On the Summary view, you may see the following message:
The authentication credentials were rejected.To further check the details of the error, go to the Call Flow view.
As the AUSF network function is responsible for authentication, you can check the messages to and from AUSF. For example, the message displayed in the following screen indicates the authentication failed because the authentication key from the UE doesn't match the authentication key in the provisioned UE.
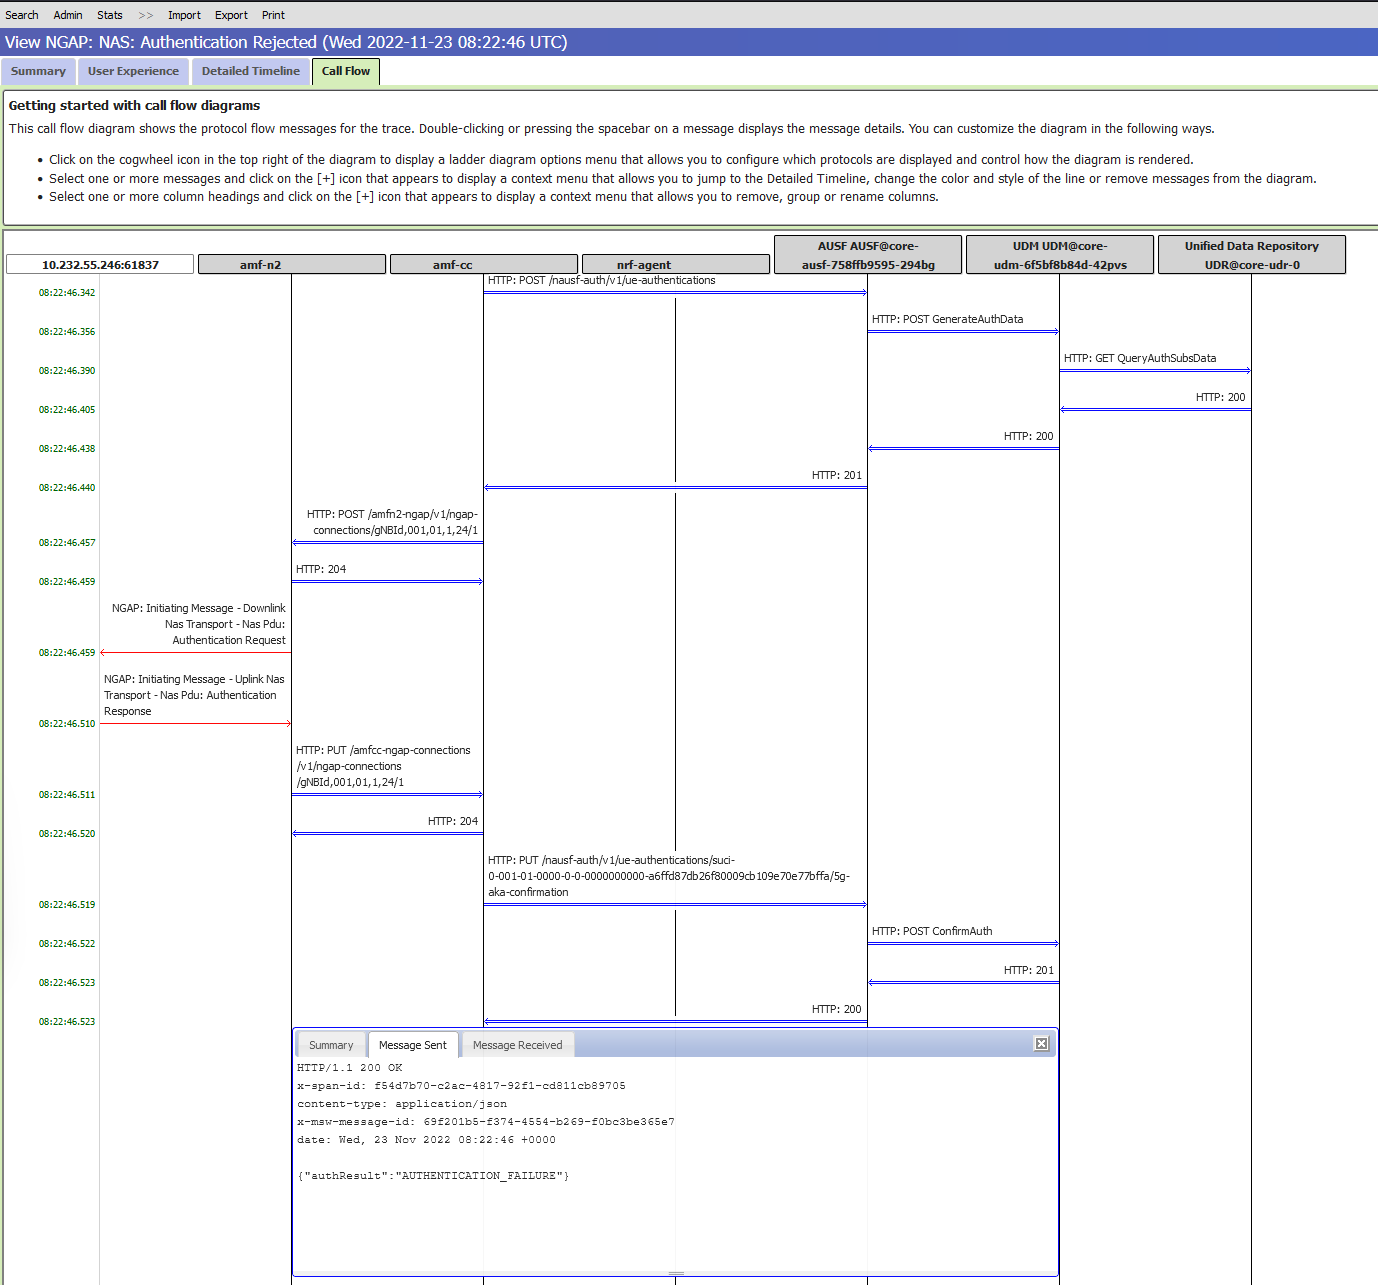
After figuring out that the root cause for the issue is the wrong authentication key in the provisioned UE, you can remove the UE through the Azure portal, and then provision it again with the correct authentication key.
Collect and share information for technical support
If you can't find the root cause of an issue, you may need Microsoft technical support to help you. In this case, you need to collect necessary diagnostics information and share it with Microsoft support personnel.
You can use one of the following methods to collect the diagnostics information:
Collect a trace for a specific signaling flow.
If you know with which signaling flow the issue is related, you can collect and share the trace for that flow.
Collect a diagnostics package for a site.
If you don't know with which signaling flows the issue is related, you can collect and share a diagnostics package for the whole site.
Note
- The trace file or the diagnostics package contains your system data, which may include personal data. If you choose to share the trace file or diagnostics package with Microsoft, you are required by law to have obtained the necessary consents or authorization to transfer any personal data to Microsoft.
- You can use a support ticket to share the trace file or the diagnostics package.
Export and share a trace
The distributed tracing tool allows you to export traces for signaling flows.
For example, if you notice that a UE doesn't work as expected during a certain time period, you can do a search with the SUPI of the UE and the time period. After that, you can select a trace in the search result and then export it as a file.
To share the file securely with Microsoft support personnel through Azure, you can use a storage account and a container resource.
For detailed instructions on exporting a trace and sharing the exported trace file, see Export, upload and share traces.
Collect and share a diagnostics package
Azure Private 5G Core allows you to use the Azure portal to collect a diagnostics package from a site. You can enable package collection either when you create a site or when you edit a site.
To enable diagnostics package collection, you need to specify the following information:
A storage account for storing your diagnostics package.
A managed identity that has the write access to the storage account.
Azure Private 5G Core uses this identity to upload the collected package to your specified storage account.
Once package collection is enabled, you can use the Diagnostics collection menu of the relevant Packet Core Control Plane resource to trigger package collection. After the collection is completed, share the package access Uniform Resource Identifier (URI) with Microsoft support personnel.
For details about diagnostics package collection, see Gather diagnostics using the Azure portal.
Perform data plane packet capture
Azure Private 5G Core provides a data plane packet capture tool, UPFT, which allows you to capture data plane packets for analysis purposes. You can use UPFT to capture packets on any user plane interface on the access network or data network.
UPFT works together with tcpdump, a data-network packet analyzer program, for packet capturing.
To perform packet capture, take these steps:
- Enter the UPF-PP troubleshooter pod in the Azure Arc-enabled Kubernetes cluster.
- Run
upftdumpto capture the packets. This command runstcpdumpautomatically. - Move the generated output file to a location where you want to do packet analysis.
For detailed instructions about packet capturing, see Perform data plane packet capture for a packet core instance.