Tutorial: Membuat, mengevaluasi, dan menilai sistem rekomendasi
Tutorial ini menyajikan contoh end-to-end dari alur kerja Ilmu Data Synapse di Microsoft Fabric. Skenario ini membangun model untuk rekomendasi buku online.
Tutorial ini mencakup langkah-langkah berikut:
- Mengunggah data ke lakehouse
- Melakukan analisis eksploratif pada data
- Melatih model, dan mencatatnya dengan MLflow
- Muat model dan buat prediksi
Kami memiliki banyak jenis algoritma rekomendasi yang tersedia. Tutorial ini menggunakan algoritma faktorisasi matriks Alternating Least Squares (ALS). ALS adalah algoritma pemfilteran kolaboratif berbasis model.

ALS mencoba memperkirakan matriks peringkat R sebagai produk dari dua matriks peringkat bawah, Anda dan V. Di sini, R = U * Vt. Biasanya, perkiraan ini disebut matriks faktor .
Algoritma ALS berulang. Setiap iterasi menyimpan salah satu konstanta matriks faktor, sementara itu memecahkan yang lain menggunakan metode kuadrat paling sedikit. Kemudian memegang konstanta matriks faktor yang baru dipecahkan saat memecahkan matriks faktor lainnya.

Prasyarat
Dapatkan langganan Microsoft Fabric. Atau, daftar untuk uji coba Microsoft Fabric gratis.
Masuk ke Microsoft Fabric.
Gunakan pengalih pengalaman di sisi kiri halaman beranda Anda untuk beralih ke pengalaman Ilmu Data Synapse.
- Jika perlu, buat Microsoft Fabric lakehouse seperti yang dijelaskan dalam Membuat lakehouse di Microsoft Fabric.
Ikuti di buku catatan
Anda bisa memilih salah satu opsi ini untuk diikuti dalam buku catatan:
- Buka dan jalankan notebook bawaan dalam pengalaman Ilmu Data Synapse
- Unggah buku catatan Anda dari GitHub ke pengalaman Ilmu Data Synapse
Buka buku catatan bawaan
Contoh buku catatan rekomendasi Buku menyertai tutorial ini.
Untuk membuka buku catatan sampel bawaan tutorial dalam pengalaman Ilmu Data Synapse:
Buka halaman beranda Synapse Ilmu Data.
Pilih Gunakan sampel.
Pilih sampel yang sesuai:
- Dari tab Alur kerja end-to-end (Python) default, jika sampelnya adalah untuk tutorial Python.
- Dari tab Alur kerja end-to-end (R), jika sampelnya adalah untuk tutorial R.
- Dari tab Tutorial cepat, jika sampel adalah untuk tutorial cepat.
Lampirkan lakehouse ke buku catatan sebelum Anda mulai menjalankan kode.
Mengimpor notebook dari GitHub
Buku catatan AIsample - Book Recommendation.ipynb menyertai tutorial ini.
Untuk membuka buku catatan yang menyertai tutorial ini, ikuti instruksi dalam Menyiapkan sistem Anda untuk tutorial ilmu data, untuk mengimpor buku catatan ke ruang kerja Anda.
Jika Anda lebih suka menyalin dan menempelkan kode dari halaman ini, Anda bisa membuat buku catatan baru.
Pastikan untuk melampirkan lakehouse ke buku catatan sebelum Anda mulai menjalankan kode.
Langkah 1: Muat data
Himpunan data rekomendasi buku dalam skenario ini terdiri dari tiga himpunan data terpisah:
Books.csv: Nomor Buku Standar Internasional (ISBN) mengidentifikasi setiap buku, dengan tanggal yang sudah dihapus tidak valid. Himpunan data juga menyertakan judul, penulis, dan penerbit. Untuk buku dengan beberapa penulis, file Books.csv hanya mencantumkan penulis pertama. URL mengarah ke sumber daya situs web Amazon untuk gambar sampul, dalam tiga ukuran.
ISBN Judul Buku Penulis Buku Tahun Publikasi Publisher URL-Gambar GAMBAR-URL-M Image-URL-l 0195153448 Mythology Klasik Mark P. O. Morford 2002 Pers Universitas Oxford http://images.amazon.com/images/P/0195153448.01.THUMBZZZ.jpg http://images.amazon.com/images/P/0195153448.01.MZZZZZZZ.jpg http://images.amazon.com/images/P/0195153448.01.LZZZZZZZ.jpg 0002005018 Clara Callan Richard Bruce Wright 2001 HarperFlamingo Kanada http://images.amazon.com/images/P/0002005018.01.THUMBZZZ.jpg http://images.amazon.com/images/P/0002005018.01.MZZZZZZZ.jpg http://images.amazon.com/images/P/0002005018.01.LZZZZZZZ.jpg Ratings.csv: Peringkat untuk setiap buku bersifat eksplisit (disediakan oleh pengguna, pada skala 1 hingga 10) atau implisit (diamati tanpa input pengguna, dan ditunjukkan oleh 0).
ID Pengguna ISBN Peringkat Buku 276725 034545104X 0 276726 0155061224 5 Users.csv: ID pengguna dianonimkan dan dipetakan ke bilangan bulat. Data demografis - misalnya, lokasi dan usia - disediakan, jika tersedia. Jika data ini tidak tersedia, nilai-nilai ini adalah
null.ID Pengguna Lokasi Usia 1 "nyc new york usa" 2 "stockton california usa" 18,0
Tentukan parameter ini, sehingga Anda dapat menggunakan notebook ini dengan himpunan data yang berbeda:
IS_CUSTOM_DATA = False  # If True, the dataset has to be uploaded manually

USER_ID_COL = "User-ID"  # Must not be '_user_id' for this notebook to run successfully
ITEM_ID_COL = "ISBN"  # Must not be '_item_id' for this notebook to run successfully
ITEM_INFO_COL = (
    "Book-Title"  # Must not be '_item_info' for this notebook to run successfully
)
RATING_COL = (
    "Book-Rating"  # Must not be '_rating' for this notebook to run successfully
)
IS_SAMPLE = True  # If True, use only <SAMPLE_ROWS> rows of data for training; otherwise, use all data
SAMPLE_ROWS = 5000  # If IS_SAMPLE is True, use only this number of rows for training

DATA_FOLDER = "Files/book-recommendation/"  # Folder that contains the datasets
ITEMS_FILE = "Books.csv"  # File that contains the item information
USERS_FILE = "Users.csv"  # File that contains the user information
RATINGS_FILE = "Ratings.csv"  # File that contains the rating information

EXPERIMENT_NAME = "aisample-recommendation"  # MLflow experiment name
Mengunduh dan menyimpan data di lakehouse
Kode ini mengunduh himpunan data, lalu menyimpannya di lakehouse.
Penting
Pastikan untuk menambahkan lakehouse ke buku catatan sebelum Anda menjalankannya. Jika tidak, Anda akan mendapatkan kesalahan.
if not IS_CUSTOM_DATA:
    # Download data files into a lakehouse if they don't exist
    import os, requests

    remote_url = "https://synapseaisolutionsa.blob.core.windows.net/public/Book-Recommendation-Dataset"
    file_list = ["Books.csv", "Ratings.csv", "Users.csv"]
    download_path = f"/lakehouse/default/{DATA_FOLDER}/raw"

    if not os.path.exists("/lakehouse/default"):
        raise FileNotFoundError(
            "Default lakehouse not found, please add a lakehouse and restart the session."
        )
    os.makedirs(download_path, exist_ok=True)
    for fname in file_list:
        if not os.path.exists(f"{download_path}/{fname}"):
            r = requests.get(f"{remote_url}/{fname}", timeout=30)
            with open(f"{download_path}/{fname}", "wb") as f:
                f.write(r.content)
    print("Downloaded demo data files into lakehouse.")
Menyiapkan pelacakan eksperimen MLflow
Gunakan kode ini untuk menyiapkan pelacakan eksperimen MLflow. Contoh ini menonaktifkan autologging. Untuk informasi selengkapnya, lihat artikel Autologging di Microsoft Fabric .
# Set up MLflow for experiment tracking
import mlflow

mlflow.set_experiment(EXPERIMENT_NAME)
mlflow.autolog(disable=True)  # Disable MLflow autologging
Membaca data dari lakehouse
Setelah data yang benar ditempatkan di lakehouse, baca tiga himpunan data ke dalam Spark DataFrames terpisah di notebook. Jalur file dalam kode ini menggunakan parameter yang ditentukan sebelumnya.
df_items = (
    spark.read.option("header", True)
    .option("inferSchema", True)
    .csv(f"{DATA_FOLDER}/raw/{ITEMS_FILE}")
    .cache()
)

df_ratings = (
    spark.read.option("header", True)
    .option("inferSchema", True)
    .csv(f"{DATA_FOLDER}/raw/{RATINGS_FILE}")
    .cache()
)

df_users = (
    spark.read.option("header", True)
    .option("inferSchema", True)
    .csv(f"{DATA_FOLDER}/raw/{USERS_FILE}")
    .cache()
)
Langkah 2: Lakukan analisis data eksploratif
Menampilkan data mentah
Jelajahi DataFrames dengan display perintah . Dengan perintah ini, Anda dapat melihat statistik DataFrame tingkat tinggi, dan memahami bagaimana kolom himpunan data yang berbeda berhubungan satu sama lain. Sebelum Anda menjelajahi himpunan data, gunakan kode ini untuk mengimpor pustaka yang diperlukan:
import pyspark.sql.functions as F
from pyspark.ml.feature import StringIndexer
import matplotlib.pyplot as plt
import seaborn as sns
color = sns.color_palette()  # Adjusting plotting style
import pandas as pd  # DataFrames
Gunakan kode ini untuk melihat DataFrame yang berisi data buku:
display(df_items, summary=True)
_item_id Tambahkan kolom untuk digunakan nanti. Nilai _item_id harus berupa bilangan bulat untuk model rekomendasi. Kode ini menggunakan StringIndexer untuk mengubah ITEM_ID_COL ke indeks:
df_items = (
    StringIndexer(inputCol=ITEM_ID_COL, outputCol="_item_id")
    .setHandleInvalid("skip")
    .fit(df_items)
    .transform(df_items)
    .withColumn("_item_id", F.col("_item_id").cast("int"))
)
Tampilkan DataFrame, dan periksa apakah _item_id nilai meningkat secara monoton dan berturut-turut, seperti yang diharapkan:
display(df_items.sort(F.col("_item_id").desc()))
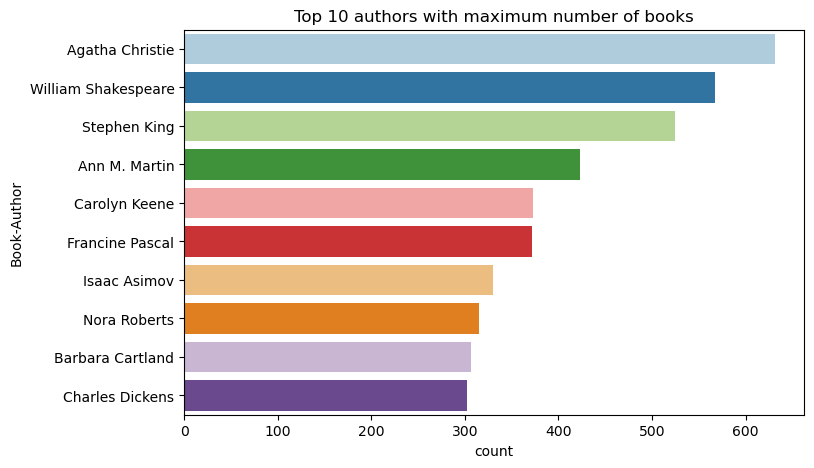
Gunakan kode ini untuk memplot 10 penulis teratas, berdasarkan jumlah buku yang ditulis, dalam urutan menurun. Agatha Christie adalah penulis terkemuka dengan lebih dari 600 buku, diikuti oleh William Shakespeare.
df_books = df_items.toPandas() # Create a pandas DataFrame from the Spark DataFrame for visualization
plt.figure(figsize=(8,5))
sns.countplot(y="Book-Author",palette = 'Paired', data=df_books,order=df_books['Book-Author'].value_counts().index[0:10])
plt.title("Top 10 authors with maximum number of books")
Selanjutnya, tampilkan DataFrame yang berisi data pengguna:
display(df_users, summary=True)
Jika baris memiliki nilai yang hilang User-ID , letakkan baris tersebut. Nilai yang hilang dalam himpunan data yang dikustomisasi tidak menyebabkan masalah.
df_users = df_users.dropna(subset=(USER_ID_COL))
display(df_users, summary=True)
_user_id Tambahkan kolom untuk digunakan nanti. Untuk model rekomendasi, nilainya _user_id harus berupa bilangan bulat. Sampel kode berikut menggunakan StringIndexer untuk mengubah USER_ID_COL ke indeks.
Himpunan data buku sudah memiliki kolom bilangan bulat User-ID . Namun, menambahkan _user_id kolom untuk kompatibilitas dengan himpunan data yang berbeda membuat contoh ini lebih kuat. Gunakan kode ini untuk menambahkan _user_id kolom:
df_users = (
    StringIndexer(inputCol=USER_ID_COL, outputCol="_user_id")
    .setHandleInvalid("skip")
    .fit(df_users)
    .transform(df_users)
    .withColumn("_user_id", F.col("_user_id").cast("int"))
)
display(df_users.sort(F.col("_user_id").desc()))
Gunakan kode ini untuk melihat data peringkat:
display(df_ratings, summary=True)
Dapatkan peringkat yang berbeda, dan simpan untuk digunakan nanti dalam daftar bernama ratings:
ratings = [i[0] for i in df_ratings.select(RATING_COL).distinct().collect()]
print(ratings)
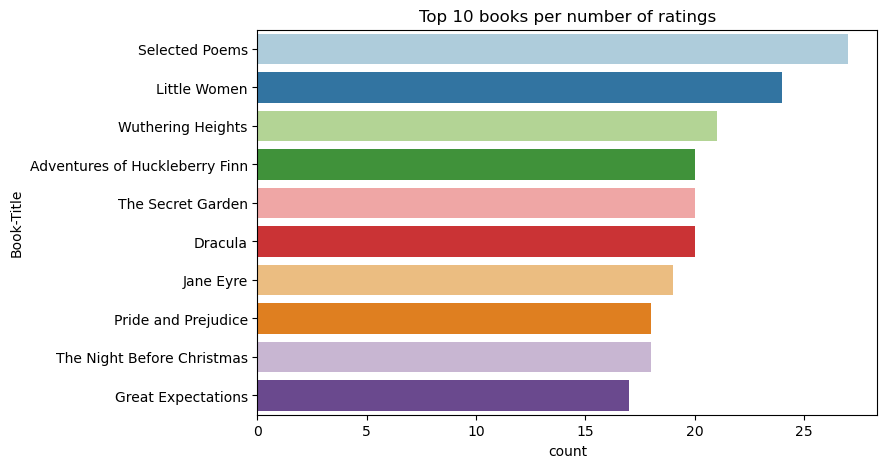
Gunakan kode ini untuk menampilkan 10 buku teratas dengan peringkat tertinggi:
plt.figure(figsize=(8,5))
sns.countplot(y="Book-Title",palette = 'Paired',data= df_books, order=df_books['Book-Title'].value_counts().index[0:10])
plt.title("Top 10 books per number of ratings")
Menurut peringkat, Selected Poems adalah buku paling populer. Adventures of Huckleberry Finn, The Secret Garden, dan Dracula memiliki peringkat yang sama.
Menggabungkan data
Gabungkan tiga DataFrame ke dalam satu DataFrame untuk analisis yang lebih komprehensif:
df_all = df_ratings.join(df_users, USER_ID_COL, "inner").join(
    df_items, ITEM_ID_COL, "inner"
)
df_all_columns = [
    c for c in df_all.columns if c not in ["_user_id", "_item_id", RATING_COL]
]

# Reorder the columns to ensure that _user_id, _item_id, and Book-Rating are the first three columns
df_all = (
    df_all.select(["_user_id", "_item_id", RATING_COL] + df_all_columns)
    .withColumn("id", F.monotonically_increasing_id())
    .cache()
)

display(df_all)
Gunakan kode ini untuk menampilkan hitungan pengguna, buku, dan interaksi yang berbeda:
print(f"Total Users: {df_users.select('_user_id').distinct().count()}")
print(f"Total Items: {df_items.select('_item_id').distinct().count()}")
print(f"Total User-Item Interactions: {df_all.count()}")
Komputasi dan plot item paling populer
Gunakan kode ini untuk menghitung dan menampilkan 10 buku paling populer:
# Compute top popular products
df_top_items = (
    df_all.groupby(["_item_id"])
    .count()
    .join(df_items, "_item_id", "inner")
    .sort(["count"], ascending=[0])
)

# Find top <topn> popular items
topn = 10
pd_top_items = df_top_items.limit(topn).toPandas()
pd_top_items.head(10)
Tip
<topn> Gunakan nilai untuk bagian rekomendasi populer atau teratas yang dibeli.
# Plot top <topn> items
f, ax = plt.subplots(figsize=(10, 5))
plt.xticks(rotation="vertical")
sns.barplot(y=ITEM_INFO_COL, x="count", data=pd_top_items)
ax.tick_params(axis='x', rotation=45)
plt.xlabel("Number of Ratings for the Item")
plt.show()

Menyiapkan himpunan data pelatihan dan pengujian
Matriks ALS memerlukan beberapa persiapan data sebelum pelatihan. Gunakan sampel kode ini untuk menyiapkan data. Kode melakukan tindakan ini:
- Transmisikan kolom peringkat ke jenis yang benar
- Sampel data pelatihan dengan peringkat pengguna
- Membagi data menjadi himpunan data pelatihan dan pengujian
if IS_SAMPLE:
    # Must sort by '_user_id' before performing limit to ensure that ALS works normally
    # If training and test datasets have no common _user_id, ALS will fail
    df_all = df_all.sort("_user_id").limit(SAMPLE_ROWS)

# Cast the column into the correct type
df_all = df_all.withColumn(RATING_COL, F.col(RATING_COL).cast("float"))

# Using a fraction between 0 and 1 returns the approximate size of the dataset; for example, 0.8 means 80% of the dataset
# Rating = 0 means the user didn't rate the item, so it can't be used for training
# We use the 80% of the dataset with rating > 0 as the training dataset
fractions_train = {0: 0}
fractions_test = {0: 0}
for i in ratings:
    if i == 0:
        continue
    fractions_train[i] = 0.8
    fractions_test[i] = 1
# Training dataset
train = df_all.sampleBy(RATING_COL, fractions=fractions_train)

# Join with leftanti will select all rows from df_all with rating > 0 and not in the training dataset; for example, the remaining 20% of the dataset
# test dataset
test = df_all.join(train, on="id", how="leftanti").sampleBy(
    RATING_COL, fractions=fractions_test
)
Sparsitas mengacu pada data umpan balik jarang, yang tidak dapat mengidentifikasi kesamaan minat pengguna. Untuk pemahaman yang lebih baik tentang data dan masalah saat ini, gunakan kode ini untuk menghitung sparitas himpunan data:
# Compute the sparsity of the dataset
def get_mat_sparsity(ratings):
    # Count the total number of ratings in the dataset - used as numerator
    count_nonzero = ratings.select(RATING_COL).count()
    print(f"Number of rows: {count_nonzero}")

    # Count the total number of distinct user_id and distinct product_id - used as denominator
    total_elements = (
        ratings.select("_user_id").distinct().count()
        * ratings.select("_item_id").distinct().count()
    )

    # Calculate the sparsity by dividing the numerator by the denominator
    sparsity = (1.0 - (count_nonzero * 1.0) / total_elements) * 100
    print("The ratings DataFrame is ", "%.4f" % sparsity + "% sparse.")

get_mat_sparsity(df_all)
# Check the ID range
# ALS supports only values in the integer range
print(f"max user_id: {df_all.agg({'_user_id': 'max'}).collect()[0][0]}")
print(f"max user_id: {df_all.agg({'_item_id': 'max'}).collect()[0][0]}")
Langkah 3: Mengembangkan dan melatih model
Latih model ALS untuk memberi pengguna rekomendasi yang dipersonalisasi.
Mendefinisikan model
Spark ML menyediakan API yang nyaman untuk membangun model ALS. Namun, model tidak menangani masalah dengan andal seperti sparitas data dan cold start (membuat rekomendasi ketika pengguna atau item baru). Untuk meningkatkan performa model, gabungkan validasi silang dan penyetelan hyperparameter otomatis.
Gunakan kode ini untuk mengimpor pustaka yang diperlukan untuk pelatihan dan evaluasi model:
# Import Spark required libraries
from pyspark.ml.evaluation import RegressionEvaluator
from pyspark.ml.recommendation import ALS
from pyspark.ml.tuning import ParamGridBuilder, CrossValidator, TrainValidationSplit

# Specify the training parameters
num_epochs = 1  # Number of epochs; here we use 1 to reduce the training time
rank_size_list = [64]  # The values of rank in ALS for tuning
reg_param_list = [0.01, 0.1]  # The values of regParam in ALS for tuning
model_tuning_method = "TrainValidationSplit"  # TrainValidationSplit or CrossValidator
# Build the recommendation model by using ALS on the training data
# We set the cold start strategy to 'drop' to ensure that we don't get NaN evaluation metrics
als = ALS(
    maxIter=num_epochs,
    userCol="_user_id",
    itemCol="_item_id",
    ratingCol=RATING_COL,
    coldStartStrategy="drop",
    implicitPrefs=False,
    nonnegative=True,
)
Menyetel hiperparameter model
Sampel kode berikutnya membangun kisi parameter, untuk membantu mencari hiperparameter. Kode ini juga membuat evaluator regresi yang menggunakan kesalahan root-mean-square (RMSE) sebagai metrik evaluasi:
#  Construct a grid search to select the best values for the training parameters
param_grid = (
    ParamGridBuilder()
    .addGrid(als.rank, rank_size_list)
    .addGrid(als.regParam, reg_param_list)
    .build()
)

print("Number of models to be tested: ", len(param_grid))

# Define the evaluator and set the loss function to the RMSE
evaluator = RegressionEvaluator(
    metricName="rmse", labelCol=RATING_COL, predictionCol="prediction"
)
Sampel kode berikutnya memulai metode penyetelan model yang berbeda berdasarkan parameter yang telah dikonfigurasi sebelumnya. Untuk informasi selengkapnya tentang penyetelan model, lihat Penyetelan ML: pemilihan model dan penyetelan hiperparameter di situs web Apache Spark.
# Build cross-validation by using CrossValidator and TrainValidationSplit
if model_tuning_method == "CrossValidator":
    tuner = CrossValidator(
        estimator=als,
        estimatorParamMaps=param_grid,
        evaluator=evaluator,
        numFolds=5,
        collectSubModels=True,
    )
elif model_tuning_method == "TrainValidationSplit":
    tuner = TrainValidationSplit(
        estimator=als,
        estimatorParamMaps=param_grid,
        evaluator=evaluator,
        # 80% of the training data will be used for training; 20% for validation
        trainRatio=0.8,
        collectSubModels=True,
    )
else:
    raise ValueError(f"Unknown model_tuning_method: {model_tuning_method}")
Evaluasi model
Anda harus mengevaluasi modul terhadap data pengujian. Model yang terlatih harus memiliki metrik tinggi pada himpunan data.
Model yang overfitted mungkin memerlukan peningkatan ukuran data pelatihan, atau pengurangan beberapa fitur redundan. Arsitektur model mungkin perlu diubah, atau parameternya mungkin memerlukan beberapa penyetelan halus.
Catatan
Nilai metrik R-kuadrat negatif menunjukkan bahwa model terlatih berkinerja lebih buruk daripada garis lurus horizontal. Temuan ini menunjukkan bahwa model terlatih tidak menjelaskan data.
Untuk menentukan fungsi evaluasi, gunakan kode ini:
def evaluate(model, data, verbose=0):
    """
    Evaluate the model by computing rmse, mae, r2, and variance over the data.
    """

    predictions = model.transform(data).withColumn(
        "prediction", F.col("prediction").cast("double")
    )

    if verbose > 1:
        # Show 10 predictions
        predictions.select("_user_id", "_item_id", RATING_COL, "prediction").limit(
            10
        ).show()

    # Initialize the regression evaluator
    evaluator = RegressionEvaluator(predictionCol="prediction", labelCol=RATING_COL)

    _evaluator = lambda metric: evaluator.setMetricName(metric).evaluate(predictions)
    rmse = _evaluator("rmse")
    mae = _evaluator("mae")
    r2 = _evaluator("r2")
    var = _evaluator("var")

    if verbose > 0:
        print(f"RMSE score = {rmse}")
        print(f"MAE score = {mae}")
        print(f"R2 score = {r2}")
        print(f"Explained variance = {var}")

    return predictions, (rmse, mae, r2, var)
Melacak eksperimen dengan menggunakan MLflow
Gunakan MLflow untuk melacak semua eksperimen dan untuk mencatat parameter, metrik, dan model. Untuk memulai pelatihan dan evaluasi model, gunakan kode ini:
from mlflow.models.signature import infer_signature

with mlflow.start_run(run_name="als"):
    # Train models
    models = tuner.fit(train)
    best_metrics = {"RMSE": 10e6, "MAE": 10e6, "R2": 0, "Explained variance": 0}
    best_index = 0
    # Evaluate models
    # Log models, metrics, and parameters
    for idx, model in enumerate(models.subModels):
        with mlflow.start_run(nested=True, run_name=f"als_{idx}") as run:
            print("\nEvaluating on test data:")
            print(f"subModel No. {idx + 1}")
            predictions, (rmse, mae, r2, var) = evaluate(model, test, verbose=1)

            signature = infer_signature(
                train.select(["_user_id", "_item_id"]),
                predictions.select(["_user_id", "_item_id", "prediction"]),
            )
            print("log model:")
            mlflow.spark.log_model(
                model,
                f"{EXPERIMENT_NAME}-alsmodel",
                signature=signature,
                registered_model_name=f"{EXPERIMENT_NAME}-alsmodel",
                dfs_tmpdir="Files/spark",
            )
            print("log metrics:")
            current_metric = {
                "RMSE": rmse,
                "MAE": mae,
                "R2": r2,
                "Explained variance": var,
            }
            mlflow.log_metrics(current_metric)
            if rmse < best_metrics["RMSE"]:
                best_metrics = current_metric
                best_index = idx

            print("log parameters:")
            mlflow.log_params(
                {
                    "subModel_idx": idx,
                    "num_epochs": num_epochs,
                    "rank_size_list": rank_size_list,
                    "reg_param_list": reg_param_list,
                    "model_tuning_method": model_tuning_method,
                    "DATA_FOLDER": DATA_FOLDER,
                }
            )
    # Log the best model and related metrics and parameters to the parent run
    mlflow.spark.log_model(
        models.subModels[best_index],
        f"{EXPERIMENT_NAME}-alsmodel",
        signature=signature,
        registered_model_name=f"{EXPERIMENT_NAME}-alsmodel",
        dfs_tmpdir="Files/spark",
    )
    mlflow.log_metrics(best_metrics)
    mlflow.log_params(
        {
            "subModel_idx": idx,
            "num_epochs": num_epochs,
            "rank_size_list": rank_size_list,
            "reg_param_list": reg_param_list,
            "model_tuning_method": model_tuning_method,
            "DATA_FOLDER": DATA_FOLDER,
        }
    )
Pilih eksperimen bernama aisample-recommendation dari ruang kerja Anda untuk melihat informasi yang dicatat untuk eksekusi pelatihan. Jika Anda mengubah nama eksperimen, pilih eksperimen yang memiliki nama baru. Informasi yang dicatat menyerupan gambar ini:

Langkah 4: Muat model akhir untuk penilaian dan buat prediksi
Setelah Anda menyelesaikan pelatihan model, lalu memilih model terbaik, muat model untuk penilaian (terkadang disebut inferensi). Kode ini memuat model dan menggunakan prediksi untuk merekomendasikan 10 buku teratas untuk setiap pengguna:
# Load the best model
# MLflow uses PipelineModel to wrap the original model, so we extract the original ALSModel from the stages
model_uri = f"models:/{EXPERIMENT_NAME}-alsmodel/1"
loaded_model = mlflow.spark.load_model(model_uri, dfs_tmpdir="Files/spark").stages[-1]

# Generate top 10 book recommendations for each user
userRecs = loaded_model.recommendForAllUsers(10)

# Represent the recommendations in an interpretable format
userRecs = (
    userRecs.withColumn("rec_exp", F.explode("recommendations"))
    .select("_user_id", F.col("rec_exp._item_id"), F.col("rec_exp.rating"))
    .join(df_items.select(["_item_id", "Book-Title"]), on="_item_id")
)
userRecs.limit(10).show()
Output menyerupan tabel ini:
| _item_id | _user_id | Rating | Judul Buku |
|---|---|---|---|
| 44865 | 7 | 7.9996786 | Lasher: Kehidupan ... |
| 786 | 7 | 6.2255826 | The Piano Man's D ... |
| 45330 | 7 | 4.980466 | Keadaan Pikiran |
| 38960 | 7 | 4.980466 | Semua yang dia inginkan |
| 125415 | 7 | 4.505084 | Harry Potter dan ... |
| 44939 | 7 | 4.3579073 | Taltos: Kehidupan ... |
| 175247 | 7 | 4.3579073 | Bonesetter itu ... |
| 170183 | 7 | 4.228735 | Hidup Sederhana... |
| 88503 | 7 | 4.221206 | Pulau Blu... |
| 32894 | 7 | 3.9031885 | Solstice Musim Dingin |
Simpan prediksi ke lakehouse
Gunakan kode ini untuk menulis rekomendasi kembali ke lakehouse:
# Code to save userRecs into the lakehouse
userRecs.write.format("delta").mode("overwrite").save(
    f"{DATA_FOLDER}/predictions/userRecs"
)