Bing Maps를 사용하는 웹앱은 Bing Maps V8 JavaScript SDK를 사용하는 경우가 많습니다. Azure Maps 웹 SDK는 마이그레이션에 적합한 Azure 기반 SDK입니다. Azure Maps 웹 SDK를 사용하면 웹 또는 모바일 애플리케이션에 표시할 자체 콘텐츠와 이미지를 통해 대화형 지도를 사용자 지정할 수 있습니다. 이 컨트롤을 통해 WebGL을 사용하여 성능이 높은 대형 데이터 집합을 렌더링할 수 있습니다. JavaScript 또는 TypeScript를 사용하여 이 SDK로 개발하세요. 이 문서에서는 다음을 수행하는 방법을 보여줍니다.
- 맵 로드
- 맵 지역화
- 압정, 폴리라인 및 다각형을 추가합니다.
- 팝업 또는 정보 상자에 정보 표시
- KML 및 GeoJSON 데이터 로드 및 표시
- 클러스터 압정
- 타일 레이어 겹쳐 놓기
- 트래픽 데이터 표시
- 그라운드 오버레이 추가
JavaScript 프레임워크를 사용하여 개발하는 경우 다음 오픈 소스 프로젝트 중 하나가 유용할 수 있습니다.
- ng-azure-maps - Azure 맵 주변의 Angular 10 래퍼.
- AzureMapsControl.Components - Azure Maps Blazor 구성 요소.
- Azure Maps React 구성 요소 - Azure Maps 컨트롤의 반응 래퍼.
- Vue Azure Maps - Vue 애플리케이션용 Azure Maps 구성 요소.
필수 조건
Azure 구독이 없는 경우 시작하기 전에 체험 계정을 만듭니다.
주요 기능 지원
다음 표에서는 Bing Maps V8 JavaScript SDK의 주요 API 기능과 Azure Maps 웹 SDK의 비슷한 API 지원을 보여줍니다.
| Bing Maps 기능 | Bing Maps 모듈 | Azure Maps 웹 SDK 지원 |
|---|---|---|
| 압정 | ✓ | |
| 압정 클러스터링 | Microsoft.Maps.클러스터링 | ✓ 압정 클러스터링 |
| 폴리라인 및 다각형 | ✓ | |
| 그라운드 오버레이 | ✓ | |
| 열 지도 | Microsoft.Maps.HeatMap | ✓ 열 지도 추가 |
| 타일 레이어 | ✓ | |
| KML 레이어 | Microsoft.Maps.GeoXml | ✓ 공간 IO 모듈 |
| 컨투어 레이어 | Microsoft.Maps.윤곽 | ✓ 윤곽 레이어 코드 샘플 |
| 데이터 범주화 레이어 | Microsoft.Maps.DataBinning | ✓ 오픈 소스 Azure Maps Gridded 데이터 원본 모듈에 포함됨 |
| 애니메이션 타일 레이어 | ✓ 오픈 소스 Azure Maps 애니메이션 모듈에 포함됨 | |
| 그리기 도구 | Microsoft.Maps.DrawingTools | ✓ 그리기 도구 추가 |
| Geocoder 서비스 | Microsoft.Maps.검색 | ✓ 검색 API 또는 REST SDK |
| 길안내 서비스 | Microsoft.Maps.방향 | ✓ 경로 API |
| 거리 매트릭스 서비스 | ✓ 경로 매트릭스 API | |
| 공간 데이터 서비스 | Microsoft.Maps.SpatialData서비스 | 해당 없음 |
| 위성/항공 이미지 | ✓ 맵 스타일 선택 | |
| 전경 이미지 | 해당 없음 | |
| Streetside 이미지 | 해당 없음 | |
| GeoJSON 지원 | Microsoft.Maps.GeoJson | ✓ |
| GeoXML 지원 | Microsoft.Maps.GeoXml | ✓ 공간 IO 모듈 |
| Well-Known Text 지원 | Microsoft.Maps.WellKnownText | ✓ 공간 IO 모듈 |
| 실내 지도 | Microsoft.Maps.VenueMaps | 작성자 |
| 교통 흐름 | Microsoft.Maps.트래픽 | 트래픽 제어 |
| 공간 수학 | Microsoft.Maps.SpatialMath | ✓ atlas.math 샘플 또는 turf.js |
| 사용자 지정 맵 스타일 | 부분적으로 지도 스타일을 선택하세요. |
Azure Maps는 기능을 확장하는 웹 SDK용 오픈 소스 모듈 을 더 많이 제공합니다.
웹 SDK의 주목할 만한 차이점
다음과 같은 Bing Maps와 Azure Maps 웹 SDK의 주요 차이점을 알고 있어야 합니다.
- Azure Maps 웹 SDK에 액세스하기 위한 호스트된 엔드포인트를 제공하는 것 외에도, 원하는 경우 npm 패키지를 사용하여 웹 SDK를 앱에 포함할 수 있습니다. 자세한 내용은 Azure Maps 지도 컨트롤 사용을 참조하세요. 이 패키지에는 TypeScript 정의도 포함됩니다.
- Bing Maps는 SDK의 두 가지 호스트된 분기를 제공하는데, 하나는 릴리스 분기이고 다른 하나는 실험 분기입니다. 새로운 개발이 진행되는 경우 실험 분기는 매일 여러 업데이트를 받을 수 있습니다. Azure Maps는 릴리스 분기만 호스트하지만, 실험적 기능은 오픈 소스 Azure Maps 코드 샘플 프로젝트에서 사용자 지정 모듈로 생성됩니다. Bing Maps는 이전에는 고정된 분기를 사용하여 업데이트 빈도가 낮았기 때문에 릴리스로 인한 호환성이 손상되는 변경의 위험이 낮았습니다. Azure Maps에서 npm 모듈을 사용하고 이전 부 버전 릴리스를 가리킬 수 있습니다.
팁
Azure Maps는 SDK의 축소된 버전과 축소되지 않은 버전을 모두 게시합니다. 파일 이름에서 .min을 제거하기만 하면 됩니다. 축소되지 않은 버전은 문제를 디버그할 때 유용하지만, 파일 크기가 더 작다는 장점을 활용하려면 프로덕션 환경에서 축소된 버전을 사용해야 합니다.
Azure Maps에서 Map 클래스의 인스턴스가 만들어지면 코드는 맵과 상호 작용하기 전에 맵
ready또는load이벤트가 실행될 때까지 기다려야 합니다. 이러한 이벤트는 모든 맵 리소스가 로드되고 액세스할 준비가 되었는지 확인합니다.두 플랫폼 모두 기본 맵에 유사한 타일링 시스템을 사용하지만 Bing Maps의 타일은 256픽셀이고 Azure Maps의 타일은 512픽셀입니다. Azure Maps에서 Bing Maps와 동일한 맵 보기를 얻으려면 Azure Maps에서 확대/축소 수준을 하나 줄이십시오.
Bing Maps의 좌표는
latitude, longitude라고 하며, Azure Maps는longitude, latitude를 사용합니다. 이 형식은 대부분의 GIS 플랫폼이 따르는 표준[x, y]와 일치합니다.Azure Maps 웹 SDK의 도형은 GeoJSON 스키마를 기반으로 합니다. 도우미 클래스는 atlas.data 네임스페이스를 통해 노출됩니다. GeoJSON 개체를 래핑하고 데이터 바인딩 가능한 방식으로 쉽게 업데이트하고 유지 관리하는 데 사용할 수 있는 atlas.Shape 클래스도 있습니다.
Azure Maps의 좌표는
[longitude, latitude]또는new atlas.data.Position(longitude, latitude)형식의 단순 숫자 배열로 지정할 수 있는 Position 개체로 정의됩니다.
팁
Position 클래스에는 latitude, longitude 형식의 좌표를 가져올 수 있는 정적 도우미 메서드가 있습니다.
atlas.data.Position.fromLatLng 함수는 Bing Maps 코드에서 new Microsoft.Maps.Location 함수로 대체할 수 있는 경우가 많습니다.
- 맵에 추가되는 각 도형에서 스타일 정보를 지정하는 대신, Azure Maps는 데이터에서 스타일을 분리합니다. 데이터는 데이터 원본에 저장되고, Azure Maps 코드가 데이터를 렌더링하는 데 사용하는 렌더링 레이어에 연결됩니다. 이 접근 방법은 향상된 성능 혜택을 제공합니다. 많은 계층이 속성에 따라 계층 내에서 개별 셰이프가 렌더링되는 방식을 변경하는 계층 스타일 옵션에 비즈니스 논리를 추가하여 수행되는 데이터 기반 스타일 지정을 지원합니다.
- Azure Maps는 Bing Maps 공간 수학 함수와 다른
atlas.math네임스페이스에서 공간 수학 함수를 제공합니다. 주요 차이점은 Azure Maps가union및intersection과 같은 이진 연산을 위한 기본 제공 함수를 제공하지 않는다는 것입니다. 그러나 Azure Maps는 개방형 GeoJSON 표준을 기반으로 하며 사용 가능한 오픈 소스 라이브러리가 있습니다. Azure Maps와 잘 작동하고 공간 수학 기능을 제공하는 자주 사용되는 옵션 중 하나는 turf js입니다.
Azure Maps와 관련된 용어에 대한 자세한 내용은 Azure Maps 용어집을 참조하세요.
웹 SDK 나란히 배치된 예제
다음 목록은 Bing Maps V8 JavaScript SDK에서 Azure Maps 웹 SDK로 웹 애플리케이션을 마이그레이션하는 데 도움이 되는 일반적인 사용 사례를 다루는 각 플랫폼의 코드 샘플 컬렉션입니다. 웹 애플리케이션과 관련된 코드 샘플은 JavaScript로 제공됩니다. 그러나 Azure Maps는 npm 모듈에서 TypeScript 정의도 제공합니다. TypeScript 정의에 대한 자세한 내용은 Azure Maps 지도 컨트롤 사용을 참조하세요.
토픽
- 맵 로드
- 맵 지역화
- 맵 보기 설정
- 핀 추가
- 사용자 지정 핀 추가
- 폴리라인 추가
- 다각형 추가
- 정보 상자 표시
- 압정 클러스터링
- 열 지도 추가
- 타일 레이어를 겹치기
- 트래픽 데이터 표시
- 그라운드 오버레이 추가
- 맵에 KML 데이터 추가
- 그리기 도구 추가
맵 로드
두 SDK에서 맵을 로드하는 작업은 동일한 단계를 따릅니다.
- 맵 SDK에 대한 참조 추가
- 맵의 자리 표시자 역할을 하는 페이지 본문에
div태그를 추가합니다. - 페이지가 로드되면 호출되는 JavaScript 함수를 만듭니다.
- 각 map 클래스의 인스턴스를 만듭니다.
주요 차이점
- Bing Maps에는 API의 스크립트 참조 또는 맵 옵션으로 지정된 계정 키가 필요합니다. Azure Maps에 대한 인증 자격 증명은 맵 클래스의 옵션으로 공유 키 인증 또는Microsoft Entra ID로 지정됩니다.
- Bing Maps는 API의 스크립트 참조에서 맵을 로드하는 초기화 함수를 호출하는 데 사용되는 콜백 함수를 가져옵니다. Azure Maps에서는 페이지의 onload 이벤트를 사용해야 합니다.
- 맵이 렌더링되는
div요소를 참조하기 위해 ID를 사용하는 경우 Bing Maps는 HTML 선택기(#myMap)를 사용하는 반면 Azure Maps는 ID 값(myMap)만 사용합니다. - Azure Maps의 좌표는
[longitude, latitude]형식의 단순 숫자 배열로 지정할 수 있는 Position 개체로 정의됩니다. - 두 플랫폼 간의 바둑판식 배열 시스템 크기 차이로 인해 Azure Maps의 확대/축소 수준은 Bing Maps 예제보다 한 수준 낮습니다.
- 기본적으로 Azure Maps는 확대/축소 단추 및 맵 스타일 단추와 같은 탐색 컨트롤을 맵 캔버스에 추가하지 않습니다. 그러나 맵 스타일 선택기, 확대/축소 단추, 나침반 또는 회전 컨트롤 및 피치 컨트롤을 추가할 수 있는 컨트롤이 있습니다.
- Azure Maps에는 map 인스턴스의
ready이벤트를 모니터링할 수 있는 이벤트 처리기가 추가되었습니다. 이는 맵이 WebGL 컨텍스트와 필요한 모든 리소스 로드를 완료하면 실행됩니다. 이 이벤트 처리기에서 사후 로드 코드를 추가할 수 있습니다.
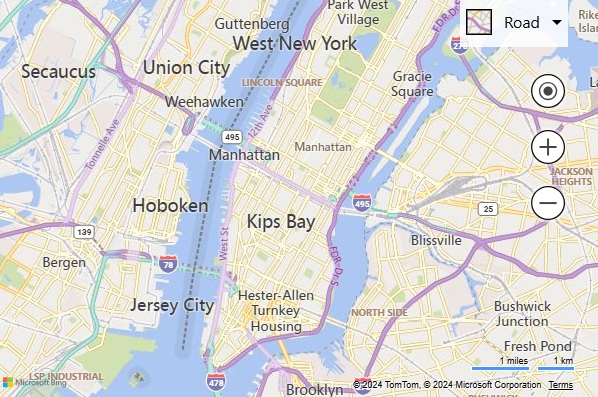
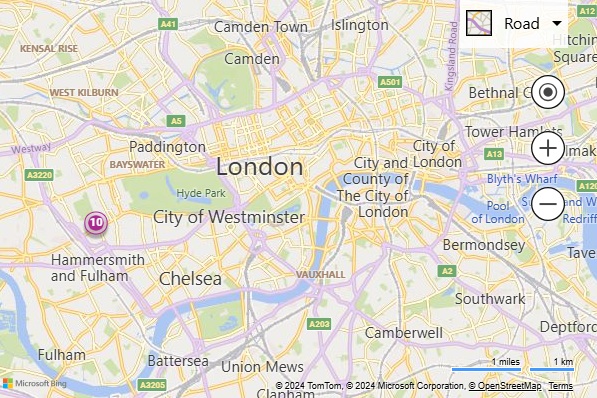
다음 예에서는 뉴욕 좌표(경도: -73.985, 위도: 40.747)를 중심으로 하고 Bing Maps에서 확대/축소 수준 12인 기본 맵을 로드하는 방법을 보여 줍니다.
이전: Bing Maps
다음 코드는 특정 위치를 중심으로 확대/축소되는 Bing 맵을 표시하는 방법의 예입니다.
<!DOCTYPE html>
<html>
<head>
    <title></title>
    <meta charset="utf-8" />
    <meta http-equiv="x-ua-compatible" content="IE=Edge" />
    <meta name="viewport" content="width=device-width, initial-scale=1, shrink-to-fit=no" />

    <script type='text/javascript'>
        var map;

        function initMap() {
            map = new Microsoft.Maps.Map('#myMap', {
                credentials: '<Your Bing Maps Key>',
                center: new Microsoft.Maps.Location(40.747, -73.985),
                zoom: 12
            });
        }
    </script>

    <!-- Bing Maps Script Reference -->
    <script src="https://www.bing.com/api/maps/mapcontrol?callback=initMap" async defer></script>
</head>
<body>
    <div id='myMap' style='position:relative;width:600px;height:400px;'></div>
</body>
</html>
브라우저에서 이 코드를 실행하면 다음 이미지와 같은 맵이 표시됩니다.
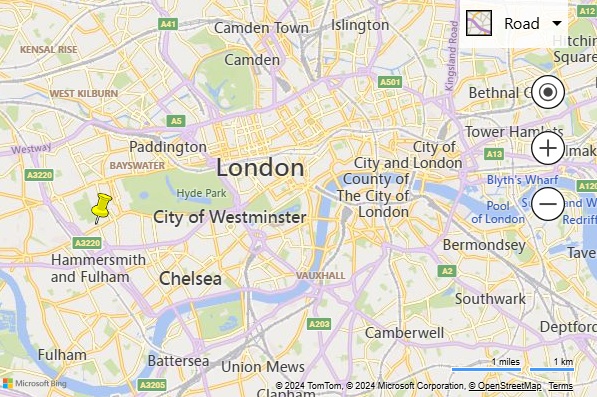
이후: Azure Maps
다음 코드는 맵 스타일 컨트롤 및 확대/축소 단추와 함께 Azure Maps에서 동일한 보기로 맵을 로드하는 방법을 보여줍니다.
<!DOCTYPE html>
<html>
<head>
    <title></title>
    <meta charset="utf-8" />
    <meta http-equiv="x-ua-compatible" content="IE=Edge" />
    <meta name="viewport" content="width=device-width, initial-scale=1, shrink-to-fit=no" />

    <!-- Add references to the Azure Maps Map control JavaScript and CSS files. -->
    <link rel="stylesheet" href="https://atlas.microsoft.com/sdk/javascript/mapcontrol/3/atlas.min.css" type="text/css" />
    <script src="https://atlas.microsoft.com/sdk/javascript/mapcontrol/3/atlas.min.js"></script>

    <script type='text/javascript'>
        var map;

        function initMap() {
            map = new atlas.Map('myMap', {
                center: [-73.985, 40.747],  //Format coordinates as longitude, latitude.
                zoom: 11,   //Subtract the zoom level by one.

                //Add your Azure Maps key to the map SDK. Get an Azure Maps key at https://azure.com/maps. NOTE: The primary key should be used as the key.
                authOptions: {
                    authType: 'subscriptionKey',
                    subscriptionKey: '<Your Azure Maps Key>'
                }
            });

            //Wait until the map resources are ready.
            map.events.add('ready', function () {
                //Add zoom and map style controls to top right of map.
                map.controls.add([
                        new atlas.control.StyleControl(),
                        new atlas.control.ZoomControl()
                    ], {
                        position: 'top-right'
                });
            });
        }
    </script>
</head>
<body onload="initMap()">
    <div id='myMap' style='position:relative;width:600px;height:400px;'></div>
</body>
</html>
브라우저에서 이 코드를 실행하면 다음 이미지와 같은 맵이 표시됩니다.

웹앱에서 Azure Maps 지도 컨트롤을 설정하고 사용하는 방법에 대한 자세한 내용은 Azure Maps 지도 컨트롤 사용을 참조하세요.
팁
Azure Maps는 SDK의 축소된 버전과 축소되지 않은 버전을 모두 게시합니다. 파일 이름에서 .min을 제거하세요. 축소되지 않은 버전은 문제를 디버그할 때 유용하지만, 파일 크기가 더 작다는 장점을 활용하려면 프로덕션 환경에서 축소된 버전을 사용해야 합니다.
추가 리소스
- 맵 회전 및 피칭을 위한 Azure Maps 탐색 컨트롤에 대한 자세한 내용은 맵에 컨트롤 추가를 참조하세요.
맵 지역화
대상 그룹이 여러 국가/지역에 분산되어 있거나 다른 언어를 사용하는 경우 지역화가 중요합니다.
이전: Bing Maps
Bing Maps를 지역화하기 위해 setLang 매개 변수를 사용하여 언어 및 지역이 지정되고 UR 매개 변수가 API에 대한 <script> 태그 참조에 추가됩니다.
setMkt 매개 변수를 사용하여 사용자 시장을 지정하므로, Bing Maps의 특정 기능은 특정 시장에서만 사용할 수 있습니다.
<script type="text/javascript" src="https://www.bing.com/api/maps/mapcontrol?callback=initMap&setLang={language-code}&setMkt={market}&UR={region-code}" async defer></script>
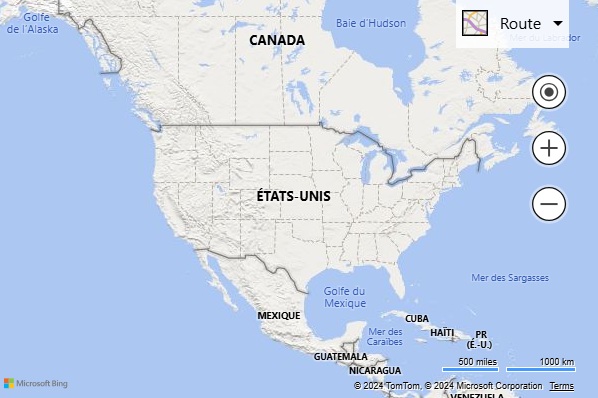
다음은 언어가 fr-FR로 설정된 Bing Maps의 예입니다.
이후: Azure Maps
Azure Maps는 맵의 언어 및 지역 보기를 설정하는 옵션만 제공합니다. 시장 매개 변수는 기능을 제한하는 데 사용되지 않습니다. 맵의 언어 및 지역 보기를 설정하는 두 가지 방법이 있습니다. 첫 번째 옵션은 이 정보를 글로벌 atlas 네임스페이스에 추가하는 것입니다. 그러면 앱의 모든 지도 컨트롤 인스턴스가 기본적으로 이 설정으로 지정됩니다. 다음은 언어를 프랑스어(fr-FR)로 설정하고 지역 보기를 "Auto"로 설정합니다.
atlas.setLanguage('fr-FR');
atlas.setView('auto');
두 번째 옵션은 다음과 같이 맵을 로드할 때 맵 옵션에 이 정보를 전달하는 것입니다.
map = new atlas.Map('myMap', {
    language: 'fr-FR',
    view: 'auto',

    authOptions: {
        authType: 'subscriptionKey',
        subscriptionKey: '<Your Azure Maps Key>'
    }
});
참고
Azure Maps는 언어 및 지역 설정이 다른 여러 맵 인스턴스를 동일한 페이지에 로드할 수 있습니다. 로드된 후에도 맵에서 이러한 설정을 업데이트할 수 있습니다. Azure Maps에서 지원되는 언어 목록은 Azure Maps의 지역화 지원을 참조하세요.
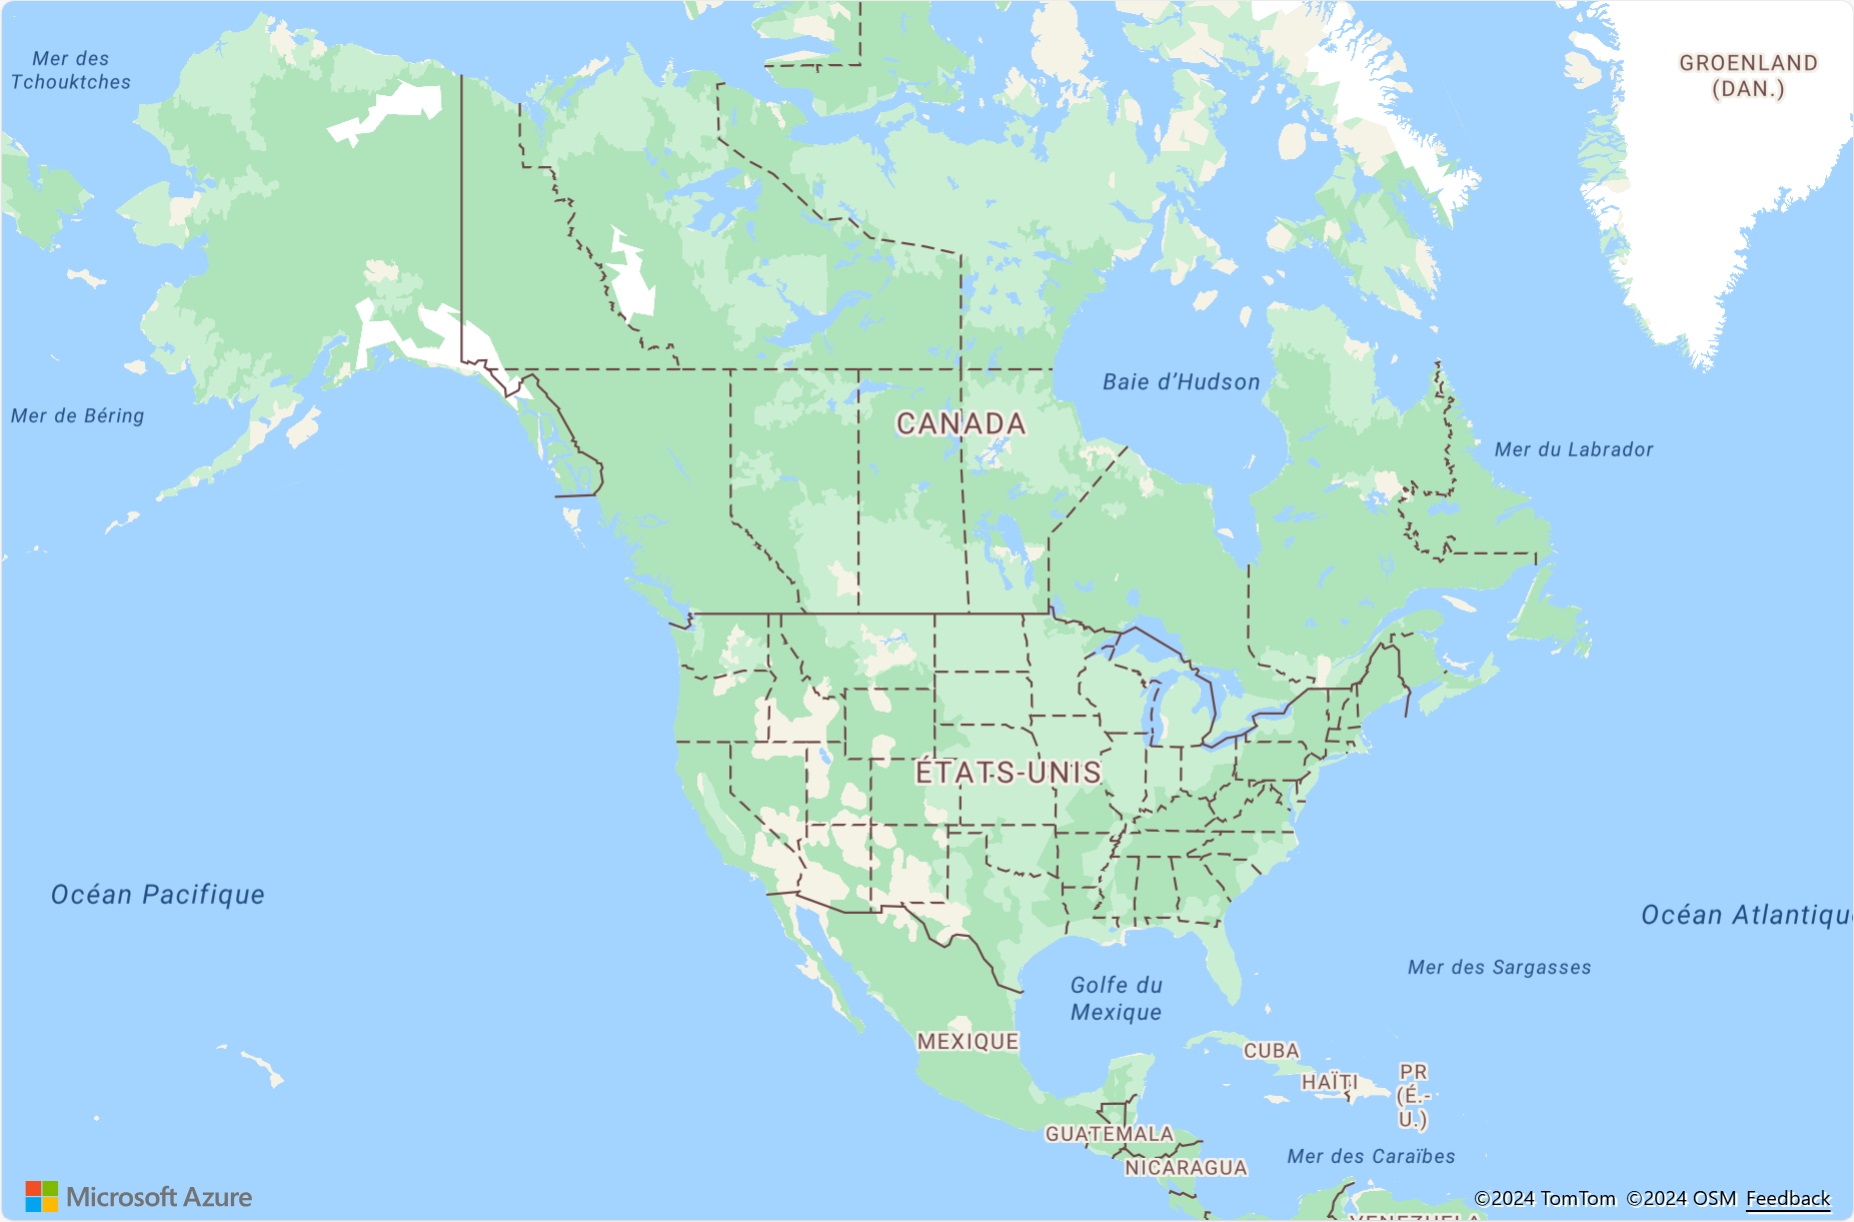
다음은 언어가 "fr"로 설정되고 사용자 지역이 fr-FR로 설정된 Azure Maps의 예입니다.
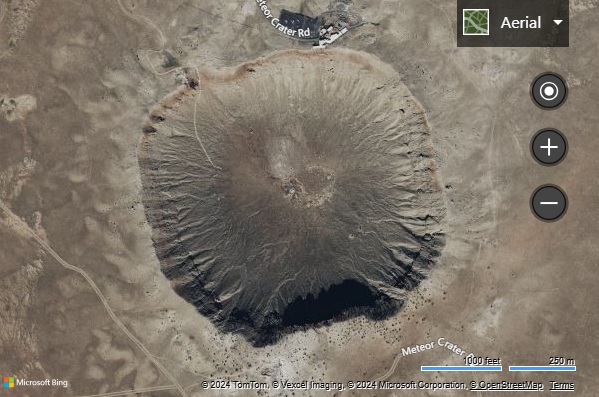
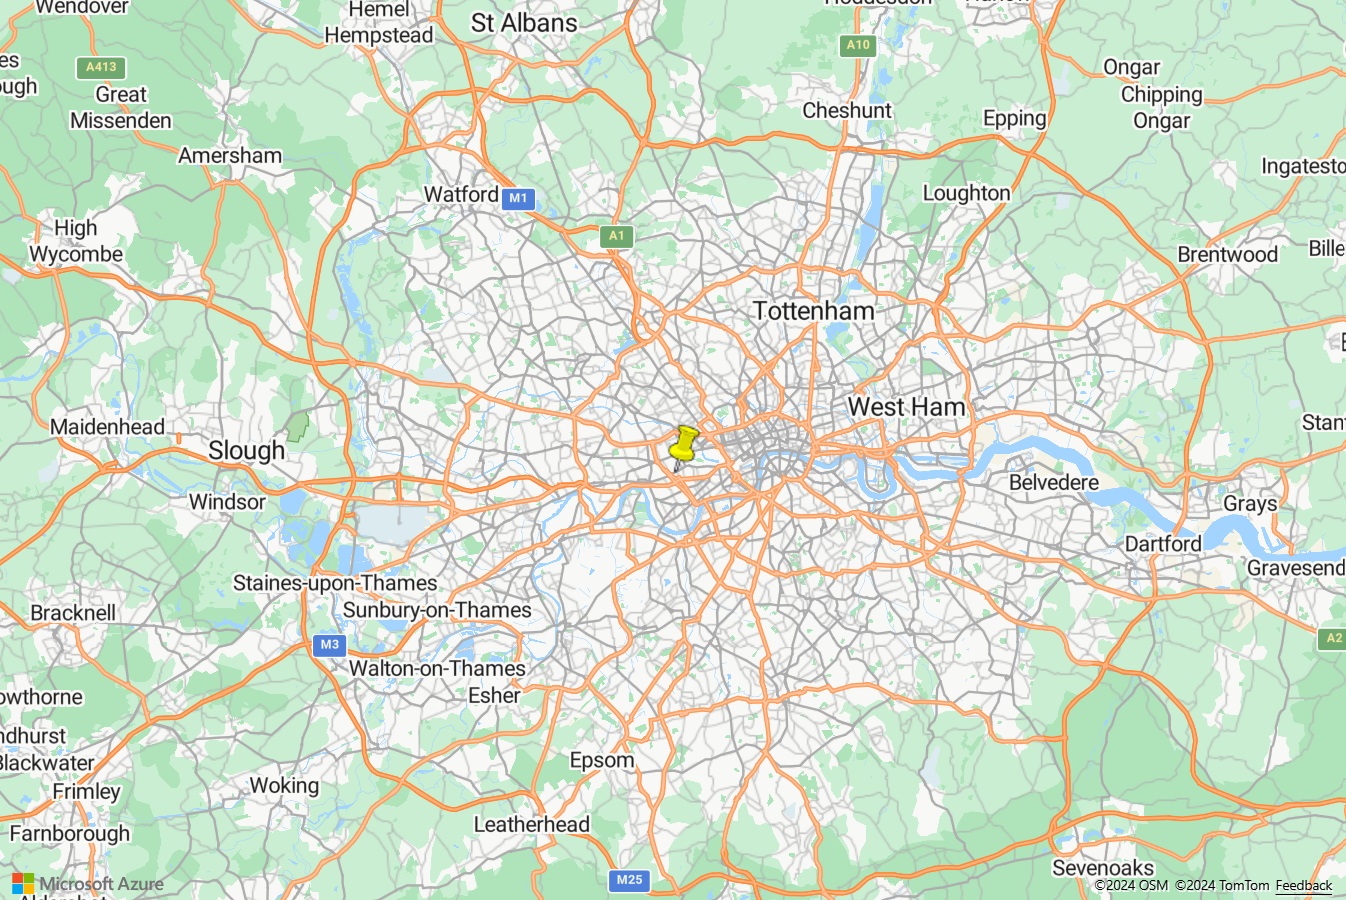
맵 보기 설정
Bing 및 Azure Maps의 동적 맵은 JavaScript의 적절한 함수를 호출하여 프로그래밍 방식으로 새 지리적 위치로 이동할 수 있습니다. 다음 예에서는 좌표(경도: -111.0225, 위도: 35.0272)가 있는 위치를 중심으로 위성 항공 이미지를 표시하고 Bing Maps에서 확대/축소 수준을 15로 변경하는 맵을 보여 줍니다.
참고
Bing Maps는 크기가 256픽셀인 타일을 사용하지만, Azure Maps는 이보다 큰 512픽셀 타일을 사용합니다. 따라서 Azure Maps에서 Bing Maps와 동일한 맵 영역을 로드하는 데 필요한 네트워크 요청 수가 줄어듭니다. 그러나 지도 컨트롤에서 타일 피라미드가 작동하는 방식 때문에, 타일이 더 큰 Azure Maps에서는 Bing Maps의 맵과 동일한 가시 영역을 얻으려면 Azure Maps를 사용할 때 Bing Maps에 사용되는 확대/축소 수준에서 1을 빼야 합니다.
이전: Bing Maps
Bing Maps 지도 컨트롤은 맵의 중심 및 확대/축소 수준을 지정할 수 있는 setView 함수를 사용하여 프로그래밍 방식으로 이동할 수 있습니다.
map.setView({
    mapTypeId: Microsoft.Maps.MapTypeId.aerial,
    center: new Microsoft.Maps.Location(35.0272, -111.0225),
    zoom: 15
});
이후: Azure Maps
Azure Maps에서는 맵의 setCamera 함수를 사용하여 맵 위치를 프로그래밍 방식으로 변경하고, setStyle 함수를 사용하여 맵 스타일을 변경할 수 있습니다. Azure Maps의 좌표는 "경도, 위도" 형식이고, 확대/축소 수준은 1을 뺀 값입니다.
map.setCamera({
    center: [-111.0225, 35.0272],
    zoom: 14
});

map.setStyle({
    style: 'satellite_road_labels'
});

추가 리소스
푸시핀 추가
Azure Maps에는 지점 데이터를 맵에 렌더링할 수 있는 여러 가지 방법이 있습니다.
- HTML 표식 – 기존 DOM 요소를 사용하여 지점을 렌더링합니다. HTML 표식은 끌기를 지원합니다.
- 기호 계층 – WebGL 컨텍스트 내에서 아이콘 및/또는 텍스트를 사용하여 지점을 렌더링합니다.
- 거품형 계층 – 지점을 맵에 원으로 렌더링합니다. 원의 반지름은 데이터의 속성에 따라 조정할 수 있습니다.
기호 및 거품형 계층은 둘 다 WebGL 컨텍스트 내에서 렌더링되며, 맵에 큰 지점 세트를 렌더링할 수 있습니다. 이러한 레이어를 사용하려면 데이터 원본에 데이터를 저장해야 합니다.
ready 이벤트가 발생한 후 데이터 원본과 렌더링 계층을 맵에 추가해야 합니다. HTML 표식은 페이지 내에서 DOM 요소로 렌더링되며 데이터 원본을 사용하지 않습니다. 페이지의 DOM 요소가 많을수록 페이지 속도가 느려집니다. 맵에 수백 개가 넘는 지점을 렌더링하는 경우 렌더링 계층 중 하나를 대신 사용해 보세요.
다음 예에서는 맵(경도: -0.2, 위도: 51.5)에 마커를 추가하고 레이블로 오버레이된 숫자 10을 사용합니다.
이전: Bing Maps
Bing Maps에서는 Microsoft.Maps.Pushpin 클래스*를 사용하여 맵에 표식이 추가됩니다. 그 후 다음 두 가지 함수 중 하나를 사용하여 압정이 맵에 추가됩니다.
첫 번째 함수는 레이어를 만들고 해당 레이어에 압정을 삽입한 다음, 맵의 layers 속성에 레이어를 추가합니다.
var pushpin = new Microsoft.Maps.Pushpin(new Microsoft.Maps.Location(51.5, -0.2), {
    text: '10'
});

var layer = new Microsoft.Maps.Layer();
layer.add(pushpin);
map.layers.insert(layer);
두 번째 함수는 맵의 entities 속성을 사용하여 압정을 추가합니다. 이 기능은 Bing Maps V8 설명서에서 더 이상 사용되지 않는 것으로 표시되어 있지만 기본 시나리오에서는 부분적으로 작동합니다.
var pushpin = new Microsoft.Maps.Pushpin(new Microsoft.Maps.Location(51.5, -0.2), {
    text: '10'
});

map.entities.add(pushpin);
이후: HTML 표식을 사용하는 Azure Maps
Azure Maps에서 HTML 표식을 사용하여 맵에 한 지점을 쉽게 표시할 수 있으며 맵에 몇 개의 지점만 표시하면 되는 간단한 앱에 권장됩니다. HTML 표식을 사용하려면 atlas.HtmlMarker 클래스의 인스턴스를 만들고, 텍스트 및 위치 옵션을 설정하고, map.markers.add 함수를 사용하여 표식을 맵에 추가합니다.
//Create a HTML marker and add it to the map.
map.markers.add(new atlas.HtmlMarker({
    text: '10',
    position: [-0.2, 51.5]
}));

이후: 기호 레이어를 사용하는 Azure Maps
기호 레이어를 사용하는 경우 데이터를 데이터 원본에 추가하고, 데이터 원본을 레이어에 연결해야 합니다. 또한 ready 이벤트가 발생한 후 데이터 원본과 계층을 맵에 추가해야 합니다. 기호 위에 고유한 텍스트 값을 렌더링하려면 텍스트 정보를 데이터 요소의 속성으로 저장하고 해당 속성을 레이어의 textField 옵션에서 참조해야 합니다. 이는 HTML 표식을 사용하는 것보다 약간 더 많은 작업이지만 성능 이점을 제공합니다.
<!DOCTYPE html>
<html>
<head>
    <title></title>
    <meta charset="utf-8" />
    <meta http-equiv="x-ua-compatible" content="IE=Edge" />
    <meta name="viewport" content="width=device-width, initial-scale=1, shrink-to-fit=no" />

    <!-- Add references to the Azure Maps Map control JavaScript and CSS files. -->
    <link rel="stylesheet" href="https://atlas.microsoft.com/sdk/javascript/mapcontrol/3/atlas.min.css" type="text/css" />
    <script src="https://atlas.microsoft.com/sdk/javascript/mapcontrol/3/atlas.min.js"></script>

    <script type='text/javascript'>
        var map, datasource;

        function initMap() {
            map = new atlas.Map('myMap', {
                center: [-0.2, 51.5],
                zoom: 9,

                authOptions: {
                    authType: 'subscriptionKey',
                    subscriptionKey: '<Your Azure Maps Key>'
                }
            });

            //Wait until the map resources are ready.
            map.events.add('ready', function () {

                //Create a data source and add it to the map.
                datasource = new atlas.source.DataSource();
                map.sources.add(datasource);

                //Create a point feature, add a property to store a label for it, and add it to the data source.
                datasource.add(new atlas.data.Feature(new atlas.data.Point([-0.2, 51.5]), {
                    label: '10'
                }));

                //Add a layer for rendering point data as symbols.
                map.layers.add(new atlas.layer.SymbolLayer(datasource, null, {
                    textOptions: {
                        //Use the label property to populate the text for the symbols.
                        textField: ['get', 'label'],
                        color: 'white',
                        offset: [0, -1]
                    }
                }));
            });
        }
    </script>
</head>
<body onload="initMap()">
    <div id='myMap' style='position:relative;width:600px;height:400px;'></div>
</body>
</html>
추가 리소스
- 데이터 원본 만들기
- 기호 레이어 추가
- 거품형 레이어 추가
- 클러스터 지점 데이터
- HTML 표식 추가
- 데이터 기반 스타일 식 사용
- 기호 레이어 아이콘 옵션
- 기호 레이어 텍스트 옵션
- HTML 표식 클래스
- HTML 표식 옵션
사용자 정의 핀 추가
사용자 지정 이미지를 사용하여 맵에 지점을 나타낼 수 있습니다. 다음 이미지는 아래 예제에 사용되며 사용자 지정 이미지를 사용하여 맵에 지점(위도:51.5, 경도: -0.2)을 표시하고, 압정 아이콘의 지점이 맵의 올바른 위치와 일치하도록 표식의 위치를 오프셋합니다.

|
|---|
| yellow-pushpin.png |
이전: Bing Maps
Bing Maps에서는 이미지 URL을 압정의 icon 옵션에 전달하여 사용자 지정 표식을 만듭니다. 압정 이미지의 지점을 맵의 좌표와 일치시키기 위해 anchor 옵션을 사용합니다. Bing Maps의 앵커 값은 이미지의 왼쪽 위 모서리를 기준으로 합니다.
var pushpin = new Microsoft.Maps.Pushpin(new Microsoft.Maps.Location(51.5, -0.2), {
    icon: 'ylw-pushpin.png',
    anchor: new Microsoft.Maps.Point(5, 30)
});

var layer = new Microsoft.Maps.Layer();
layer.add(pushpin);
map.layers.insert(layer);
이후: HTML 표식을 사용하는 Azure Maps
Azure Maps에서 HTML 표식을 사용자 지정하려면 HTML string 또는 HTMLElement를 표식의 htmlContent 옵션에 전달하면 됩니다. Azure Maps에서 anchor 옵션은 9개의 정의된 참조 지점 "가운데", "위쪽", "아래쪽", "왼쪽", "오른쪽", "왼쪽 위", "오른쪽 위", "왼쪽 끝", "오른쪽 아래" 중 하나를 사용하여 위치 좌표를 기준으로 표식의 상대 위치를 지정하는 데 사용됩니다. 콘텐츠는 고정되고 기본적으로 "하단" 중앙에 위치합니다. Bing Maps의 코드를 보다 쉽게 마이그레이션하려면 앵커를 "왼쪽 위"로 설정한 다음, offset 옵션을 Bing Maps와 동일한 오프셋으로 사용합니다. Azure Maps의 오프셋은 Bing Maps와 반대 방향으로 이동하므로 -1을 곱합니다.
팁
MS Edge에서 원치 않는 아이콘을 표시하는 기본 끌기 동작을 해제하려면 pointer-events:none을 HTML 콘텐츠의 스타일로 추가하세요.
map.markers.add(new atlas.HtmlMarker({
    htmlContent: '<img src="ylw-pushpin.png" style="pointer-events: none;" />',
    anchor: 'top-left',
    pixelOffset: [-5, -30],
    position: [-0.2, 51.5]
}));

이후: 기호 레이어를 사용하는 Azure Maps
Azure Maps의 기호 레이어는 사용자 지정 이미지도 지원하지만, 먼저 이미지를 맵 리소스에 로드하고 고유한 ID를 할당해야 합니다. 그러면 기호 레이어에서 이 ID를 참조할 수 있습니다. 기호는 아이콘 offset 옵션을 사용하여 이미지의 올바른 지점과 일치하도록 오프셋할 수 있습니다. Azure Maps에서 anchor 옵션은 9개의 정의된 참조 지점 "가운데", "위쪽", "아래쪽", "왼쪽", "오른쪽", "왼쪽 위", "오른쪽 위", "왼쪽 끝", "오른쪽 아래" 중 하나를 사용하여 위치 좌표를 기준으로 기호의 상대 위치를 지정하는 데 사용됩니다. 콘텐츠는 기본적으로 "아래쪽", 즉, HTML 콘텐츠의 하단 가운데에 고정 및 설정됩니다. Bing Maps의 코드를 보다 쉽게 마이그레이션하려면 앵커를 "왼쪽 위"로 설정한 다음, offset 옵션을 Bing Maps와 동일한 오프셋으로 사용합니다. Azure Maps의 오프셋은 Bing Maps와 반대 방향으로 이동하므로 -1을 곱합니다.
<!DOCTYPE html>
<html>
<head>
    <title></title>
    <meta charset="utf-8" />
    <meta http-equiv="x-ua-compatible" content="IE=Edge" />
    <meta name="viewport" content="width=device-width, initial-scale=1, shrink-to-fit=no" />

    <!-- Add references to the Azure Maps Map control JavaScript and CSS files. -->
    <link rel="stylesheet" href="https://atlas.microsoft.com/sdk/javascript/mapcontrol/3/atlas.min.css" type="text/css" />
    <script src="https://atlas.microsoft.com/sdk/javascript/mapcontrol/3/atlas.min.js"></script>

    <script type='text/javascript'>
        var map, datasource;

        function initMap() {
            map = new atlas.Map('myMap', {
                center: [-0.2, 51.5],
                zoom: 9,
                authOptions: {
                    authType: 'subscriptionKey',
                    subscriptionKey: '<Your Azure Maps Key>'
                }
            });

            //Wait until the map resources are ready.
            map.events.add('ready', function () {

                //Load the custom image icon into the map resources.
                map.imageSprite.add('my-yellow-pin', 'ylw-pushpin.png').then(function () {

                    //Create a data source and add it to the map.
                    datasource = new atlas.source.DataSource();
                    map.sources.add(datasource);

                    //Create a point and add it to the data source.
                    datasource.add(new atlas.data.Point([-0.2, 51.5]));

                    //Add a layer for rendering point data as symbols.
                    map.layers.add(new atlas.layer.SymbolLayer(datasource, null, {
                        iconOptions: {
                            //Set the image option to the id of the custom icon that was loaded into the map resources.
                            image: 'my-yellow-pin',
                            anchor: 'top-left',
                            offset: [-5, -30]
                        }
                    }));
                });
            });
        }
    </script>
</head>
<body onload="initMap()">
    <div id='myMap' style='position:relative;width:600px;height:400px;'></div>
</body>
</html>
팁
지점의 고급 사용자 지정 렌더링을 만들려면 여러 렌더링 레이어를 함께 사용합니다. 예를 들어, 서로 다른 색상의 원 위에 동일한 아이콘을 가진 여러 핀을 만들고자 할 때, 색상마다 각기 다른 이미지를 생성하는 대신, 버블 레이어 위에 기호 레이어를 오버레이하여 동일한 데이터 소스를 참조하도록 하세요. 이렇게 하면 맵을 만들고 맵에 여러 이미지를 유지하는 것보다 훨씬 효율적입니다.
추가 리소스
폴리라인 추가
폴리라인은 맵에 선 또는 경로를 나타내는 데 사용됩니다. 다음 예에서는 맵에 점선 폴리라인을 만드는 방법을 보여 줍니다.
이전: Bing Maps
Bing Maps에서 Polyline 클래스는 위치 배열과 옵션 세트를 사용합니다.
//Get the center of the map.
var center = map.getCenter();

//Create the polyline.
var polyline = new Microsoft.Maps.Polyline([
        center,
        new Microsoft.Maps.Location(center.latitude - 0.5, center.longitude - 1),
        new Microsoft.Maps.Location(center.latitude - 0.5, center.longitude + 1)
    ], {
        strokeColor: 'red',
        strokeThickness: 4,
        strokeDashArray: [3, 3]
    });

//Add the polyline to the map using a layer.
var layer = new Microsoft.Maps.Layer();
layer.add(polyline);
map.layers.insert(layer);
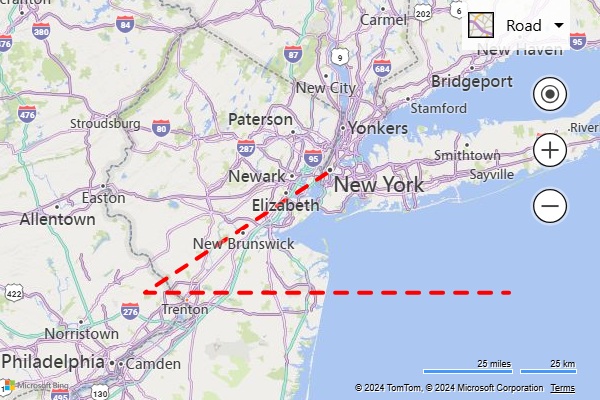
이후: Azure Maps
Azure Maps에서는 폴리라인을 보다 일반적인 지리 공간적 용어인 LineString 또는 MultiLineString 개체라고 합니다. 이러한 개체는 선 계층을 사용하여 데이터 원본에 추가하고 렌더링할 수 있습니다. 스트로크 색, 너비 및 대시 배열 옵션은 플랫폼 간에 거의 동일합니다.
//Get the center of the map.
var center = map.getCamera().center;

//Create a data source and add it to the map.
var datasource = new atlas.source.DataSource();
map.sources.add(datasource);

//Create a line and add it to the data source.
datasource.add(new atlas.data.LineString([
    center,
    [center[0] - 1, center[1] - 0.5],
    [center[0] + 1, center[1] - 0.5]
]));

//Add a layer for rendering line data.
map.layers.add(new atlas.layer.LineLayer(datasource, null, {
    strokeColor: 'red',
    strokeWidth: 4,
    strokeDashArray: [3, 3]
}));

추가 리소스
다각형 추가
다각형은 맵의 영역을 나타내는 데 사용됩니다. Azure Maps 및 Bing Maps는 다각형에 대해 유사한 지원을 제공합니다. 다음 예에서는 맵의 중심 좌표를 기준으로 삼각형을 형성하는 다각형을 만드는 방법을 보여 줍니다.
이전: Bing Maps
Bing Maps에서 Polygon 클래스는 좌표 또는 좌표 링의 배열과 옵션 세트를 사용합니다.
//Get the center of the map.
var center = map.getCenter();

//Create the polygon.
var polygon = new Microsoft.Maps.Polygon([
        center,
        new Microsoft.Maps.Location(center.latitude - 0.5, center.longitude - 1),
        new Microsoft.Maps.Location(center.latitude - 0.5, center.longitude + 1),
        center
    ], {
        fillColor: 'rgba(0, 255, 0, 0.5)',
        strokeColor: 'red',
        strokeThickness: 2
    });

//Add the polygon to the map using a layer.
var layer = new Microsoft.Maps.Layer();
layer.add(polygon);
map.layers.insert(layer);
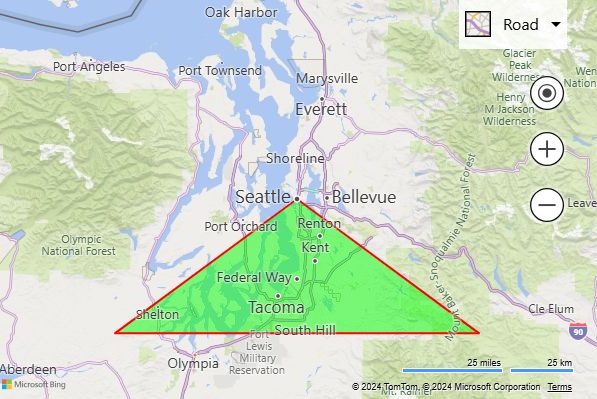
이후: Azure Maps
Azure Maps에서는 레이어를 사용하여 Polygon 및 MultiPolygon 개체를 데이터 원본에 추가하고 맵에 렌더링할 수 있습니다. 다각형 영역은 다각형 계층에 렌더링할 수 있습니다. 다각형 윤곽선은 선 계층을 사용하여 렌더링할 수 있습니다.
//Get the center of the map.
var center = map.getCamera().center;

//Create a data source and add it to the map.
datasource = new atlas.source.DataSource();
map.sources.add(datasource);

//Create a polygon and add it to the data source.
datasource.add(new atlas.data.Polygon([
    center,
    [center[0] - 1, center[1] - 0.5],
    [center[0] + 1, center[1] - 0.5],
    center
]));

//Add a polygon layer for rendering the polygon area.
map.layers.add(new atlas.layer.PolygonLayer(datasource, null, {
    fillColor: 'rgba(0, 255, 0, 0.5)'
}));

//Add a line layer for rendering the polygon outline.
map.layers.add(new atlas.layer.LineLayer(datasource, null, {
    strokeColor: 'red',
    strokeWidth: 2
}));

추가 리소스
정보 상자 표시
엔터티에 대한 자세한 내용은 Bing Maps의 Microsoft.Maps.Infobox 클래스로 맵에 표시될 수 있으며 Azure Maps에서는 atlas.Popup 클래스를 사용하여 수행됩니다. 다음 예에서는 선택 시 정보 상자/팝업을 표시하는 고정핀/마커를 맵에 추가합니다.
이전: Bing Maps
Bing Maps에서는 Microsoft.Maps.Infobox 생성자를 사용하여 정보 상자를 만듭니다.
//Add a pushpin where we want to display an infobox.
var pushpin = new Microsoft.Maps.Pushpin(new Microsoft.Maps.Location(47.6, -122.33));

//Add the pushpin to the map using a layer.
var layer = new Microsoft.Maps.Layer();
layer.add(pushpin);
map.layers.insert(layer);

//Create an infobox and bind it to the map.
var infobox = new Microsoft.Maps.Infobox(new Microsoft.Maps.Location(47.6, -122.33), {
    description: '<div style="padding:5px"><b>Hello World!</b></div>',
    visible: false
});
infobox.setMap(map);

//Add a click event to the pushpin to open the infobox.
Microsoft.Maps.Events.addHandler(pushpin, 'click', function () {
    infobox.setOptions({ visible: true });
});
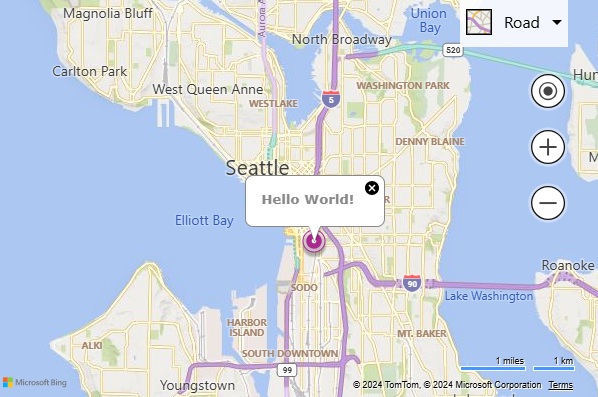
이후: Azure Maps
Azure Maps에서 팝업을 사용하여 위치에 대한 자세한 정보를 표시할 수 있습니다. HTML string 또는 HTMLElement 개체를 팝업의 content 옵션에 전달할 수 있습니다. 원한다면 도형에 관계없이 팝업을 표시할 수 있으며, 따라서 position 값을 지정해야 합니다. 팝업을 표시하려면 open 함수를 호출하고, 팝업이 표시될 맵을 전달합니다.
//Add a marker to the map that to display a popup for.
var marker = new atlas.HtmlMarker({
    position: [-122.33, 47.6]
});

//Add the marker to the map.
map.markers.add(marker);

//Create a popup.
var popup = new atlas.Popup({
    content: '<div style="padding:10px"><b>Hello World!</b></div>',
    position: [-122.33, 47.6],
    pixelOffset: [0, -35]
});

//Add a click event to the marker to open the popup.
map.events.add('click', marker, function () {
    //Open the popup
    popup.open(map);
});

참고
기호, 거품형, 선 또는 다각형 계층을 사용하여 동일한 작업을 수행하려면 표식 대신 맵 이벤트 코드에 레이어를 전달하면 됩니다.
추가 리소스
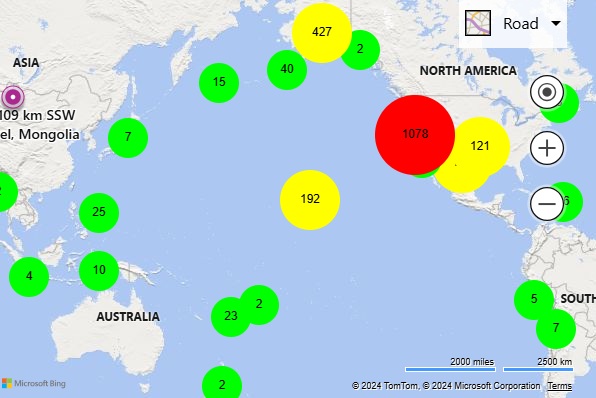
압정 클러스터링
맵에 여러 데이터 요소를 시각화할 때 지점이 서로 겹치면 맵이 복잡해지고 읽고 사용하기 불편해집니다. 이때 지점 데이터를 클러스터링하면 이러한 사용자 환경을 개선하고 성능을 향상할 수 있습니다. 지점 데이터 클러스터링은 서로 가까이 있는 지점 데이터를 결합하여 맵에 단일 클러스터형 데이터 요소로 표시하는 프로세스입니다. 사용자가 맵을 확대하면 클러스터는 개별 데이터 요소로 분리됩니다.
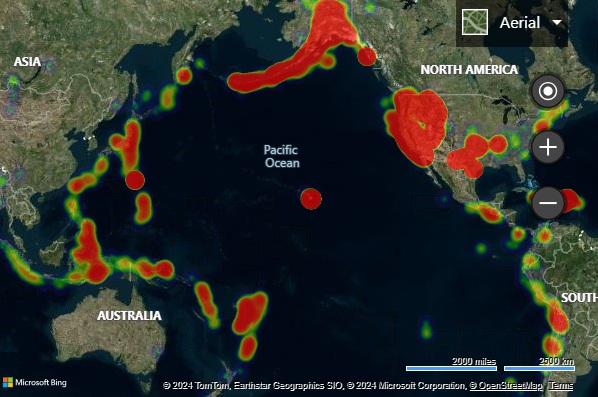
다음 예에서는 지난 주 지진 데이터의 GeoJSON 피드를 로드하고 지도에 추가합니다. 클러스터는 포함하고 있는 지점 수에 따라 크기가 조정되고 색이 있는 원으로 렌더링됩니다.
참고
압정 클러스터링에 사용되는 여러 가지 알고리즘이 있습니다. Bing Maps는 간단한 그리드 기반 함수를 사용하지만, Azure Maps는 보다 발전되고 시각적으로 매력적인 지점 기반 클러스터링 방법을 사용합니다.
이전: Bing Maps
Bing Maps에서는 GeoJSON 모듈을 사용하여 GeoJSON 데이터를 로드할 수 있습니다. 클러스터링 모듈에서 압정을 로드하고 압정이 들어 있는 클러스터링 계층을 사용하여 압정을 클러스터링합니다.
<!DOCTYPE html>
<html>
<head>
    <title></title>
    <meta charset="utf-8" />
    <meta http-equiv="x-ua-compatible" content="IE=Edge" />
    <meta name="viewport" content="width=device-width, initial-scale=1, shrink-to-fit=no" />

    <script type='text/javascript'>
        var map;
        var earthquakeFeed = 'https://earthquake.usgs.gov/earthquakes/feed/v1.0/summary/all_week.geojson';

        function initMap() {
            map = new Microsoft.Maps.Map(document.getElementById('myMap'), {
                credentials: '<Your Bing Maps Key>',
                center: new Microsoft.Maps.Location(20, -160),
                zoom: 2
            });

            //Load the GeoJSON and Clustering modules.
            Microsoft.Maps.loadModule(['Microsoft.Maps.GeoJson', 'Microsoft.Maps.Clustering'], function () {

                //Load the GeoJSON data from a URL.
                Microsoft.Maps.GeoJson.readFromUrl(earthquakeFeed, function (pins) {

                    //Create a ClusterLayer with options and add it to the map.
                    clusterLayer = new Microsoft.Maps.ClusterLayer(pins, {
                        clusteredPinCallback: createCustomClusteredPin,
                        gridSize: 100
                    });

                    map.layers.insert(clusterLayer);
                });
            });
        }

        //A function that defines how clustered pins are rendered.
        function createCustomClusteredPin(cluster) {
            //Get the number of pushpins in the cluster
            var clusterSize = cluster.containedPushpins.length;

            var radius = 20;    //Default radius to 20 pixels.
            var fillColor = 'lime'; 	//Default to lime green.

            if (clusterSize >= 750) {
                radius = 40;   //If point_count >= 750, radius is 40 pixels.
                fillColor = 'red';    //If the point_count >= 750, color is red.
            } else if (clusterSize >= 100) {
                radius = 30;    //If point_count >= 100, radius is 30 pixels.
                fillColor = 'yellow';    //If the point_count >= 100, color is yellow.
            }

            //Create an SVG string of a circle with the specified radius and color.
            var svg = ['<svg xmlns="http://www.w3.org/2000/svg" width="', (radius * 2), '" height="', (radius * 2), '">',
                '<circle cx="', radius, '" cy="', radius, '" r="', radius, '" fill="', fillColor, '"/>',
                '<text x="50%" y="50%" dominant-baseline="middle" text-anchor="middle" style="font-size:12px;font-family:arial;fill:black;" >{text}</text>',
                '</svg>'];

            //Customize the clustered pushpin using the generated SVG and anchor on its center.
            cluster.setOptions({
                icon: svg.join(''),
                anchor: new Microsoft.Maps.Point(radius, radius),
                textOffset: new Microsoft.Maps.Point(0, radius - 8) //Subtract 8 to compensate for height of text.
            });
        }
    </script>

    <!-- Bing Maps Script Reference -->
    <script src="https://www.bing.com/api/maps/mapcontrol?callback=initMap" async defer></script>
</head>
<body>
    <div id='myMap' style='position:relative;width:600px;height:400px;'></div>
</body>
</html>
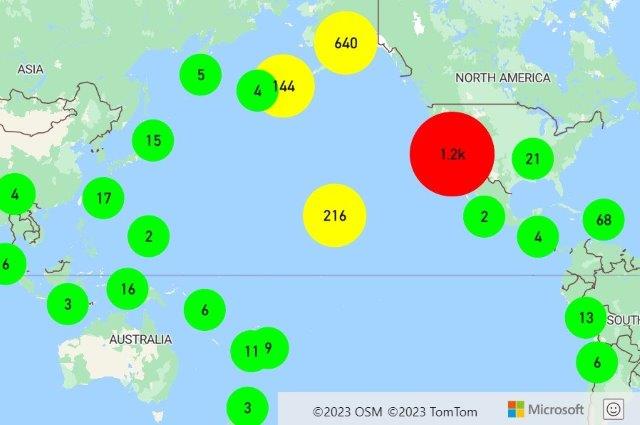
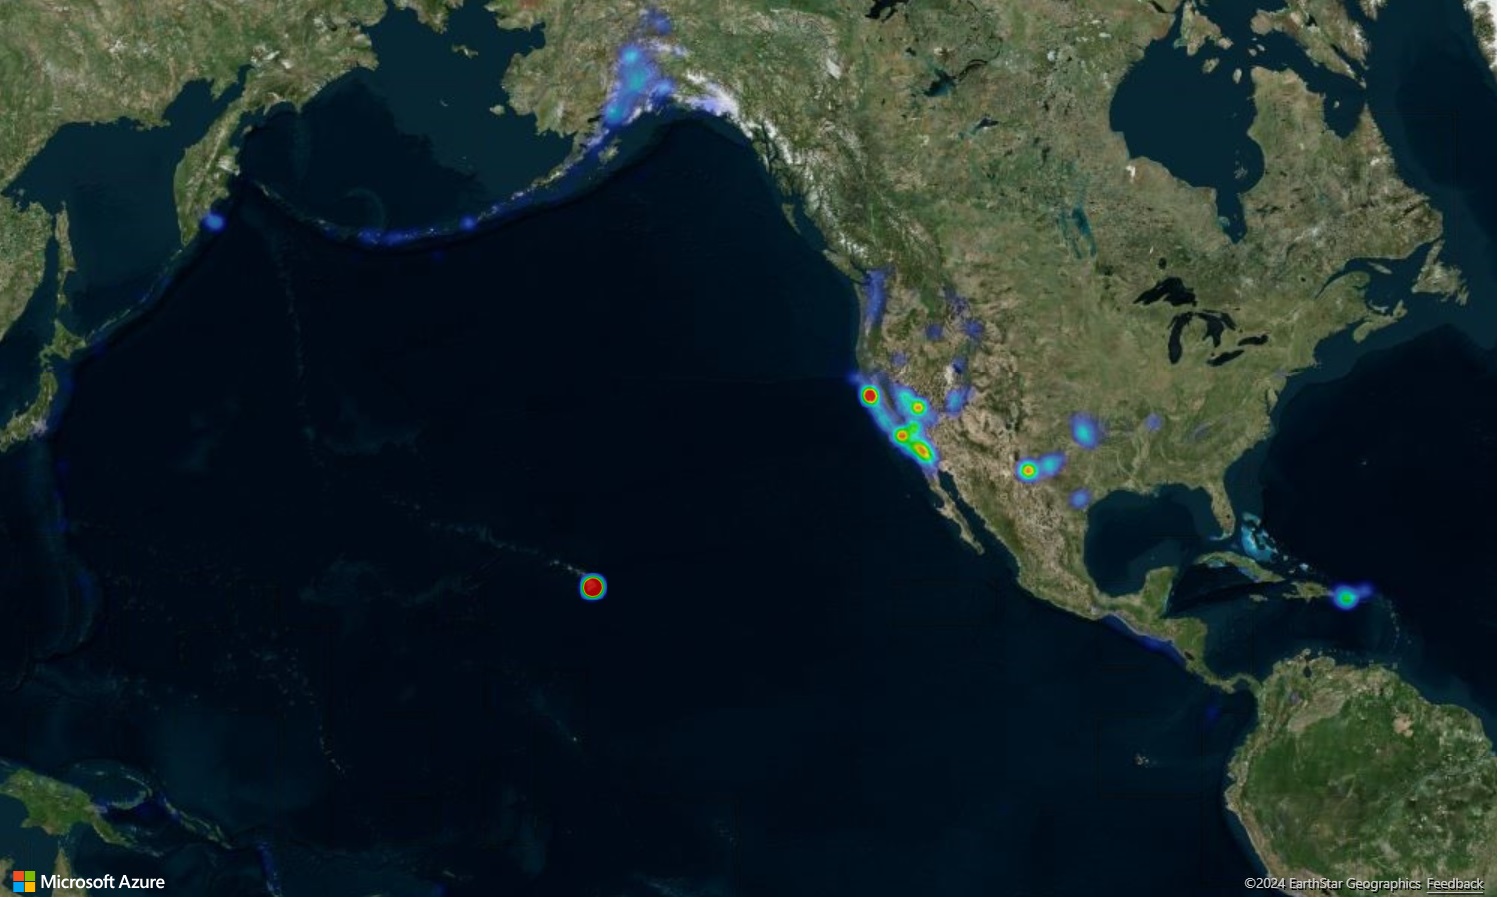
이후: Azure Maps
Azure Maps에서 데이터는 데이터 원본을 통해 추가 및 관리됩니다. 레이어는 데이터 원본에 연결하여 그 안에서 데이터를 렌더링합니다. Azure Maps의 DataSource 클래스는 여러 가지 클러스터링 옵션을 제공합니다.
-
cluster– 데이터 원본에 지점 데이터를 클러스터링하라고 알려줍니다. -
clusterRadius- 지점을 함께 클러스터링하는 데 적용되는 반지름(픽셀)입니다. -
clusterMaxZoom- 클러스터링이 발생하는 최대 확대/축소 수준입니다. 다른 확대/축소를 수행하면 모든 점이 기호로 렌더링됩니다. -
clusterProperties- 식을 사용하여 각 클러스터 내의 모든 지점에 대해 계산하여 각 클러스터 지점의 속성에 추가되는 사용자 지정 속성을 정의합니다.
클러스터링이 사용하도록 설정되면 데이터 원본은 렌더링을 위해 클러스터링된 데이터 포인트와 클러스터링되지 않은 데이터 포인트를 계층으로 보냅니다. 데이터 원본은 수십만 개의 데이터 요소를 클러스터링할 수 있습니다. 클러스터링된 데이터 요소에는 다음과 같은 속성이 포함되어 있습니다.
| 속성 이름 | 유형 | 설명 |
|---|---|---|
cluster |
불리언 | 기능이 클러스터를 표시하는지 여부를 나타냅니다. |
cluster_id |
문자열 |
DataSource 클래스 getClusterExpansionZoom, getClusterChildren 및 getClusterLeaves 함수에 사용할 수 있는 클러스터의 고유 ID입니다. |
point_count |
숫자 | 클러스터에 포함된 지점의 수입니다. |
point_count_abbreviated |
문자열 | 길이가 긴 경우 point_count 값을 줄여서 표시하는 문자열입니다. (예: 4,000은 4K) |
DataSource 클래스에는 cluster_id를 사용하여 클러스터에 대한 추가 정보에 액세스하는 다음과 같은 도우미 함수가 있습니다.
| 함수 | 반환 형식 | 설명 |
|---|---|---|
getClusterChildren(clusterId: number) |
Promise<Feature<Geometry, any> | Shape> |
다음 확대/축소 수준에서 지정된 클러스터의 자식 요소를 검색합니다. 이러한 자식 요소는 도형과 하위 클러스터의 조합일 수 있습니다. 하위 클러스터는 클러스터 속성과 일치하는 속성이 있는 기능입니다. |
getClusterExpansionZoom(clusterId: number) |
Promise<number> |
클러스터가 확장되거나 분리되기 시작하는 확대/축소 수준을 계산합니다. |
getClusterLeaves(clusterId: number, limit: number, offset: number) |
Promise<Feature<Geometry, any> | Shape> |
클러스터의 모든 지점을 검색합니다.
limit를 설정하여 지점의 하위 세트를 반환하고, offset을 사용하여 지점을 통해 페이지를 이동합니다. |
클러스터형 데이터를 맵에 렌더링할 때 둘 이상의 계층을 사용하는 것이 가장 쉬운 경우가 많습니다. 다음 예제에서는 클러스터의 크기에 따라 크기가 조정되고 색이 지정된 원을 그리기 위한 거품형 계층, 클러스터 크기를 텍스트로 렌더링하기 위한 기호 계층, 비클러스터형 요소를 렌더링하기 위한 두 번째 기호 계층 등 세 가지 레이어를 사용합니다. Azure Maps에서 클러스터링된 데이터 렌더링에 대한 자세한 내용은 웹 SDK에서 포인트 데이터 클러스터링을 참조하세요.
GeoJSON 데이터는 Azure Maps에서 importDataFromUrl 클래스의 DataSource 함수를 사용하여 직접 가져올 수 있습니다.
<!DOCTYPE html>
<html>
<head>
    <title></title>
    <meta charset="utf-8" />
    <meta http-equiv="x-ua-compatible" content="IE=Edge" />
    <meta name="viewport" content="width=device-width, initial-scale=1, shrink-to-fit=no" />

    <!-- Add references to the Azure Maps Map control JavaScript and CSS files. -->
    <link rel="stylesheet" href="https://atlas.microsoft.com/sdk/javascript/mapcontrol/3/atlas.min.css" type="text/css" />
    <script src="https://atlas.microsoft.com/sdk/javascript/mapcontrol/3/atlas.min.js"></script>

    <script type='text/javascript'>
        var map, datasource;
        var earthquakeFeed = 'https://earthquake.usgs.gov/earthquakes/feed/v1.0/summary/all_week.geojson';

        function initMap() {
            //Initialize a map instance.
            map = new atlas.Map('myMap', {
                center: [-160, 20],
                zoom: 1,

                //Add your Azure Maps key to the map SDK. Get an Azure Maps key at https://azure.com/maps. NOTE: The primary key should be used as the key.
                authOptions: {
                    authType: 'subscriptionKey',
                    subscriptionKey: '<Your Azure Maps Key>'
                }
            });

            //Wait until the map resources are ready.
            map.events.add('ready', function () {

                //Create a data source and add it to the map.
                datasource = new atlas.source.DataSource(null, {
                    //Tell the data source to cluster point data.
                    cluster: true
                });
                map.sources.add(datasource);

                //Create layers for rendering clusters, their counts and unclustered points and add the layers to the map.
                map.layers.add([
                    //Create a bubble layer for rendering clustered data points.
                    new atlas.layer.BubbleLayer(datasource, null, {
                        //Scale the size of the clustered bubble based on the number of points in the cluster.
                        radius: [
                            'step',
                            ['get', 'point_count'],
                            20,         //Default of 20 pixel radius.
                            100, 30,    //If point_count >= 100, radius is 30 pixels.
                            750, 40     //If point_count >= 750, radius is 40 pixels.
                        ],

                        //Change the color of the cluster based on the value on the point_cluster property of the cluster.
                        color: [
                            'step',
                            ['get', 'point_count'],
                            'lime',            //Default to lime green.
                            100, 'yellow',     //If the point_count >= 100, color is yellow.
                            750, 'red'         //If the point_count >= 750, color is red.
                        ],
                        strokeWidth: 0,
                        filter: ['has', 'point_count'] //Only rendered data points that have a point_count property, which clusters do.
                    }),

                    //Create a symbol layer to render the count of locations in a cluster.
                    new atlas.layer.SymbolLayer(datasource, null, {
                        iconOptions: {
                            image: 'none' //Hide the icon image.
                        },
                        textOptions: {
                            textField: ['get', 'point_count_abbreviated'],
                            offset: [0, 0.4]
                        }
                    }),

                    //Create a layer to render the individual locations.
                    new atlas.layer.SymbolLayer(datasource, null, {
                        filter: ['!', ['has', 'point_count']] //Filter out clustered points from this layer.
                    })
                ]);

                //Retrieve a GeoJSON data set and add it to the data source.
                datasource.importDataFromUrl(earthquakeFeed);
            });
        }
    </script>
</head>
<body onload="initMap()">
    <div id='myMap' style='position:relative;width:600px;height:400px;'></div>
</body>
</html>
추가 리소스
열 지도 추가
열 지도(또는 요소 밀도 맵)는 여러 색을 사용하여 데이터 밀도를 나타내기 위해 사용하는 일종의 데이터 시각화입니다. 맵에 데이터 “핫 스폿”을 표시하기 위해 사용되는 경우가 많으며 큰 요소 데이터 세트를 렌더링하는 좋은 방법입니다.
다음 예는 열 지도로 렌더링된 지난 달 USGS의 모든 지진에 대한 GeoJSON 피드를 로드합니다.
이전: Bing Maps
Bing Maps에서 열 지도를 만들려면 열 지도 모듈을 로드합니다. 마찬가지로 GeoJSON 데이터에 대한 지원을 추가하기 위해 GeoJSON 모듈이 로드됩니다.
<!DOCTYPE html>
<html>
<head>
    <title></title>
    <meta charset="utf-8" />
    <meta http-equiv="x-ua-compatible" content="IE=Edge" />
    <meta name="viewport" content="width=device-width, initial-scale=1, shrink-to-fit=no" />

    <script type='text/javascript'>
        var map;
        var earthquakeFeed = 'https://earthquake.usgs.gov/earthquakes/feed/v1.0/summary/all_month.geojson';

        function initMap() {
            map = new Microsoft.Maps.Map(document.getElementById('myMap'), {
                credentials: '<Your Bing Maps Key>',
                center: new Microsoft.Maps.Location(20, -160),
                zoom: 2,
                mapTypeId: Microsoft.Maps.MapTypeId.aerial
            });

            //Load the GeoJSON and HeatMap modules.
            Microsoft.Maps.loadModule(['Microsoft.Maps.GeoJson', 'Microsoft.Maps.HeatMap'], function () {

                //Load the GeoJSON data from a URL.
                Microsoft.Maps.GeoJson.readFromUrl(earthquakeFeed, function (shapes) {

                    //Create a heat map and add it to the map.
                    var heatMap = new Microsoft.Maps.HeatMapLayer(shapes, {
                        opacity: 0.65,
                        radius: 10
                    });
                    map.layers.insert(heatMap);
                });
            });
        }
    </script>

    <!-- Bing Maps Script Reference -->
    <script src="https://www.bing.com/api/maps/mapcontrol?callback=initMap" async defer></script>
</head>
<body>
    <div id='myMap' style='position:relative;width:600px;height:400px;'></div>
</body>
</html>
이후: Azure Maps
Azure Maps에서 GeoJSON 데이터를 데이터 원본에 로드하고 데이터 원본을 열 지도 계층에 연결합니다. GeoJSON 데이터는 Azure Maps에서 importDataFromUrl 클래스의 DataSource 함수를 사용하여 직접 가져올 수 있습니다.
<!DOCTYPE html>
<html>
<head>
    <title></title>
    <meta charset="utf-8" />
    <meta http-equiv="x-ua-compatible" content="IE=Edge" />
    <meta name="viewport" content="width=device-width, initial-scale=1, shrink-to-fit=no" />

    <!-- Add references to the Azure Maps Map control JavaScript and CSS files. -->
    <link rel="stylesheet" href="https://atlas.microsoft.com/sdk/javascript/mapcontrol/3/atlas.min.css" type="text/css" />
    <script src="https://atlas.microsoft.com/sdk/javascript/mapcontrol/3/atlas.min.js"></script>

    <script type='text/javascript'>
        var map;
        var earthquakeFeed = 'https://earthquake.usgs.gov/earthquakes/feed/v1.0/summary/all_month.geojson';

        function initMap() {
            //Initialize a map instance.
            map = new atlas.Map('myMap', {
                center: [-160, 20],
                zoom: 1,
                style: 'satellite_road_labels',

                //Add your Azure Maps key to the map SDK. Get an Azure Maps key at https://azure.com/maps. NOTE: The primary key should be used as the key.
                authOptions: {
                    authType: 'subscriptionKey',
                    subscriptionKey: '<Your Azure Maps Key>'
                }
            });

            //Wait until the map resources are ready.
            map.events.add('ready', function () {

                //Create a data source and add it to the map.
                datasource = new atlas.source.DataSource();
                map.sources.add(datasource);

                //Load the earthquake data.
                datasource.importDataFromUrl(earthquakeFeed);

                //Create a layer to render the data points as a heat map.
                map.layers.add(new atlas.layer.HeatMapLayer(datasource, null, {
                    opacity: 0.65,
                    radius: 10
                }));
            });
        }
    </script>
</head>
<body onload="initMap()">
    <div id='myMap' style='position:relative;width:600px;height:400px;'></div>
</body>
</html>
추가 리소스
타일 레이어 겹쳐 놓기
타일 레이어를 사용하면 지도 타일링 시스템에 맞춰 더 작은 타일 이미지로 나뉜 큰 이미지를 겹쳐놓을 수 있습니다. 이는 큰 이미지나 큰 데이터 세트를 오버레이하는 일반적인 방법입니다.
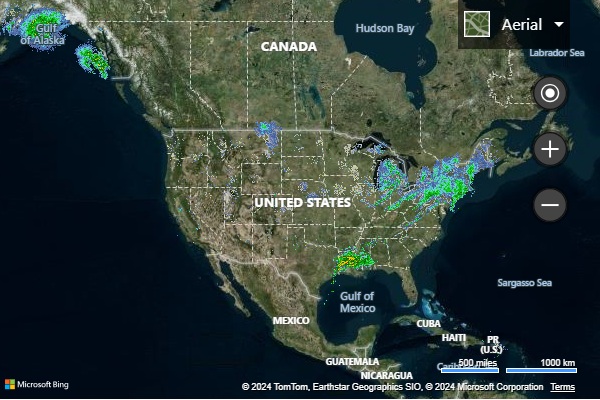
다음 예제에서는 아이오와 주립 대학교의 Iowa Environmental Mesonet에서 X, Y, 줌 타일 명명 스키마를 사용하는 날씨 레이더 타일 레이어를 겹쳐 표시합니다.
이전: Bing Maps
Bing Maps에서 타일 레이어는 Microsoft.Maps.TileLayer 클래스를 사용하여 만들 수 있습니다.
var weatherTileLayer = new Microsoft.Maps.TileLayer({
    mercator: new Microsoft.Maps.TileSource({
        uriConstructor: 'https://mesonet.agron.iastate.edu/cache/tile.py/1.0.0/nexrad-n0q-900913/{zoom}/{x}/{y}.png'
    })
});
map.layers.insert(weatherTileLayer);
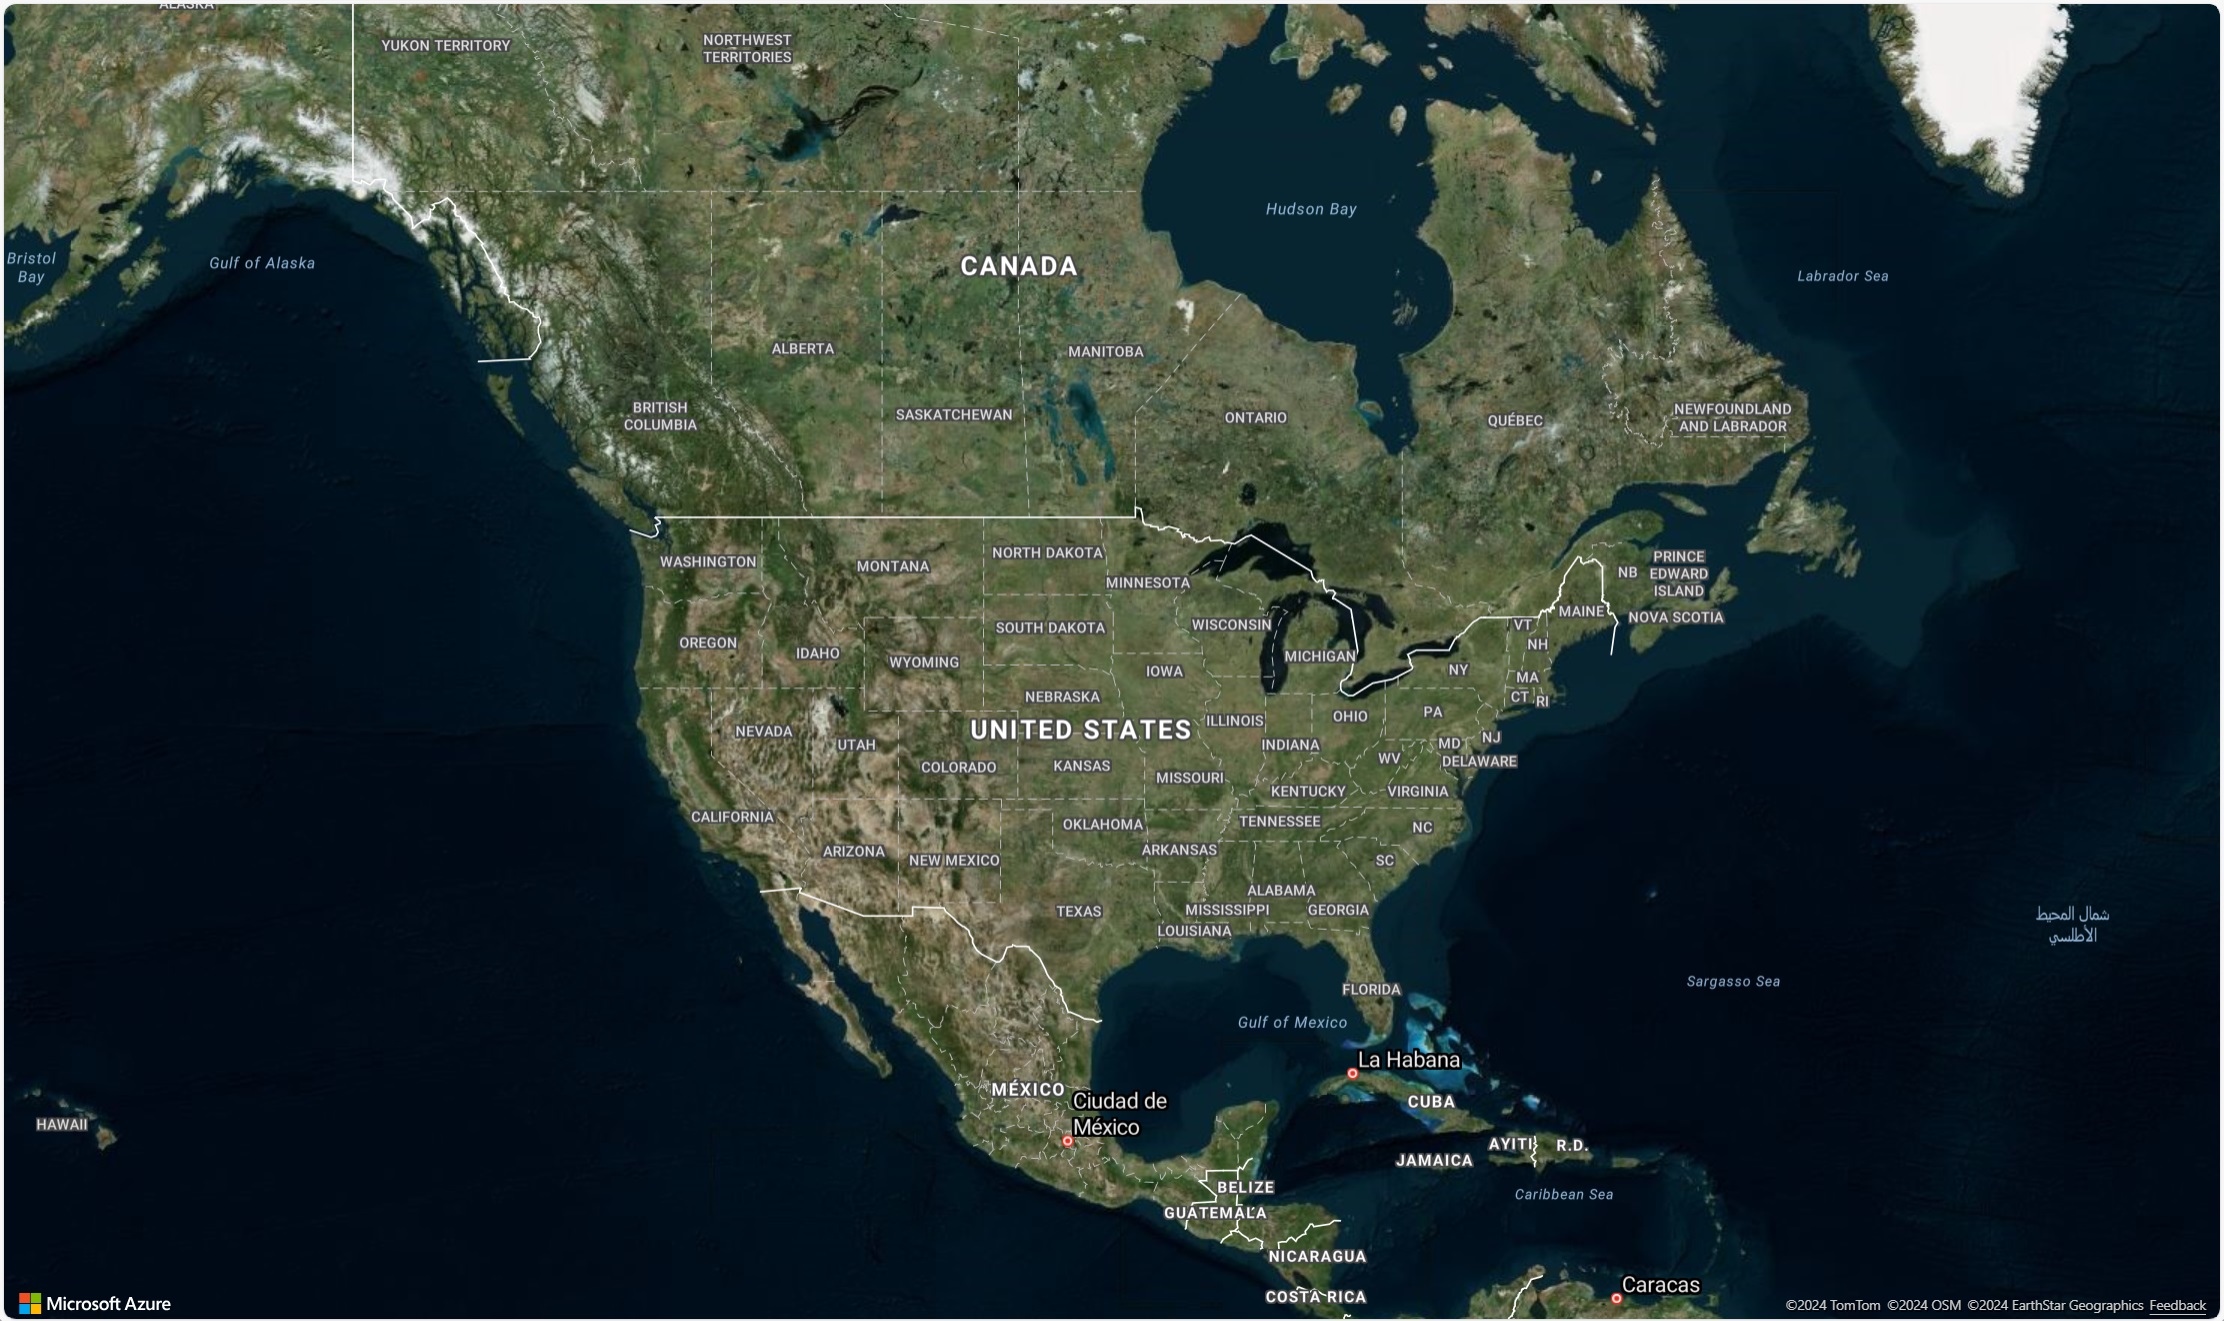
이후: Azure Maps
Azure Maps에서는 다른 레이어와 거의 같은 방식으로 타일 레이어를 맵에 추가할 수 있습니다. x, y, 확대/축소 자리 표시자가 있는 형식이 지정된 URL {x}, {y}, {z}는 각각 타일에 액세스할 위치를 레이어에 알리는 데 사용됩니다. Azure Maps 타일 레이어는 {quadkey}, {bbox-epsg-3857} 및 {subdomain} 자리 표시자도 지원합니다.
팁
Azure Maps에서 계층은 기본 맵 계층을 포함하여 다른 계층 아래에 렌더링될 수 있습니다. 쉽게 읽을 수 있도록 맵 레이블 아래에 타일 레이어를 렌더링하는 것이 좋은 경우가 많습니다.
map.layers.add 함수는 아래에 새 레이어를 삽입할 두 번째 레이어의 ID인 두 번째 매개 변수를 사용합니다. 타일 레이어를 맵 레이블 아래에 삽입하려면 다음 코드를 사용하면 됩니다.
map.layers.add(myTileLayer, "labels");
//Create a tile layer and add it to the map below the label layer.
map.layers.add(new atlas.layer.TileLayer({
    tileUrl: 'https://mesonet.agron.iastate.edu/cache/tile.py/1.0.0/nexrad-n0q-900913/{z}/{x}/{y}.png',
    opacity: 0.8,
    tileSize: 256
}), 'labels');
팁
타일 요청은 맵의 transformRequest 옵션을 사용하여 캡처할 수 있습니다. 이렇게 하면 필요한 경우 헤더를 수정하거나 요청에 추가할 수 있습니다.
추가 리소스
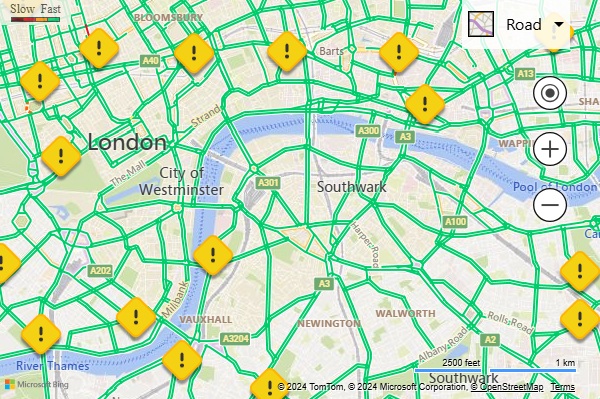
트래픽 데이터 표시
트래픽 데이터는 Bing 및 Azure Maps 둘 다에 중첩될 수 있습니다.
이전: Bing Maps
Bing Maps에서는 트래픽 모듈을 사용하여 맵에 트래픽 데이터를 오버레이할 수 있습니다.
Microsoft.Maps.loadModule('Microsoft.Maps.Traffic', function () {
    var manager = new Microsoft.Maps.Traffic.TrafficManager(map);
    manager.show();
});
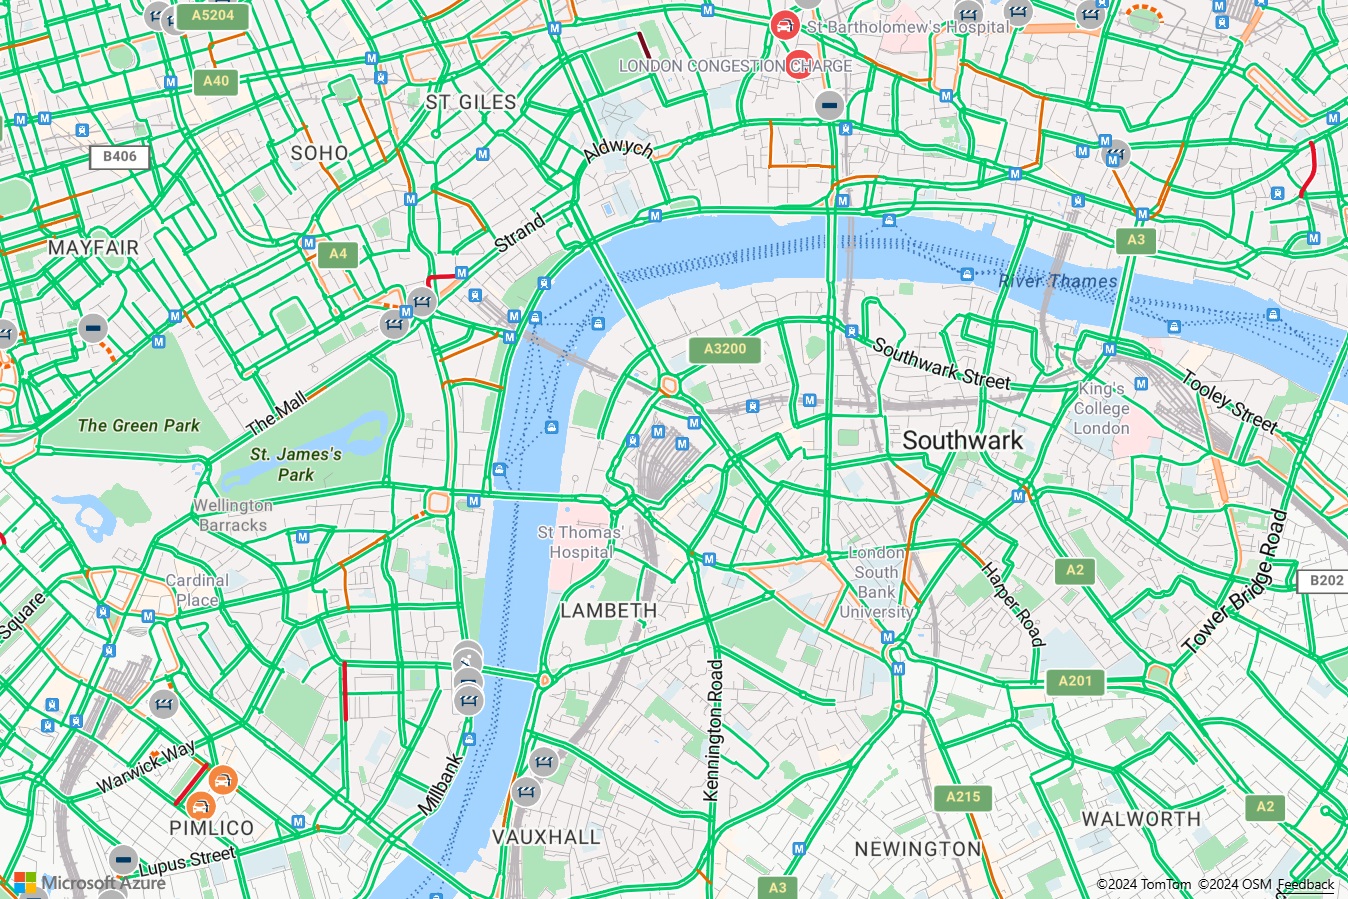
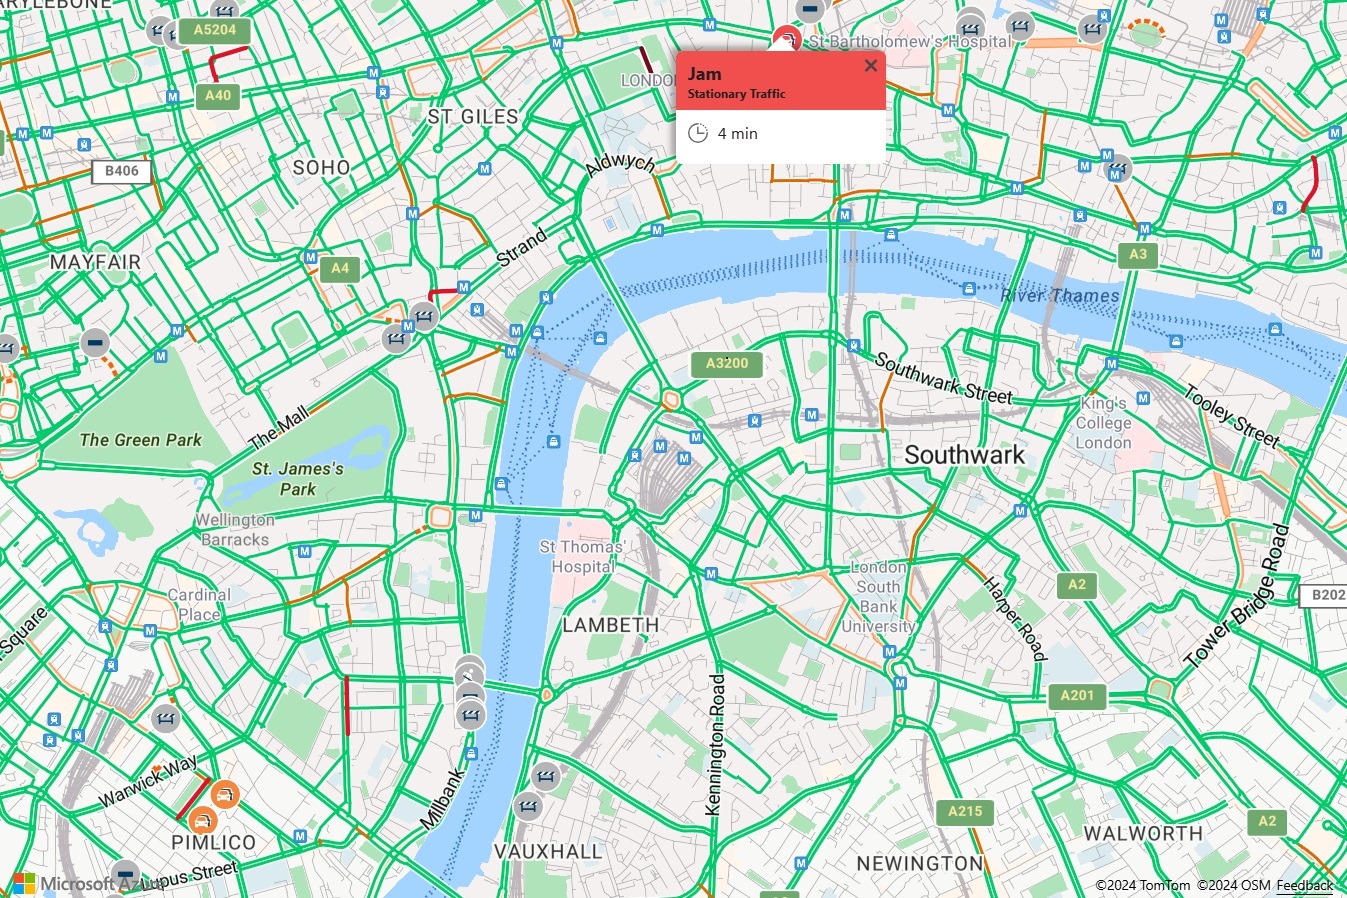
이후: Azure Maps
Azure Maps는 트래픽을 표시하는 여러 가지 옵션을 제공합니다. 도로 폐쇄나 사고 같은 트래픽 인시던트를 맵에 아이콘으로 표시할 수 있습니다. 트래픽 흐름, 색으로 구분된 도로를 맵에 오버레이할 수 있으며 게시된 속도 제한, 일반적인 예상 지연 시간 또는 절대 지연 시간을 기준으로 색을 수정할 수 있습니다. Azure Maps의 인시던트 데이터는 1분마다 업데이트되고 흐름 데이터는 2분마다 업데이트됩니다.
map.setTraffic({
    incidents: true,
    flow: 'relative'
});
Azure Maps에서 트래픽 아이콘 중 하나를 선택하면 팝업에 자세한 정보가 표시됩니다.
추가 리소스
그라운드 오버레이 추가
Bing 및 Azure Maps는 지도를 이동하고 확대/축소할 때 지리 참조 이미지를 맵에 오버레이하여 이동 및 크기를 조정할 수 있도록 지원합니다. Bing Maps에서는 이를 지상 오버레이라고 하고 Azure Maps에서는 이미지 계층이라고 합니다. 이미지 계층은 건축 평면도 작성, 옛 지도 오버레이 또는 드론 이미지 활용에 적합합니다.
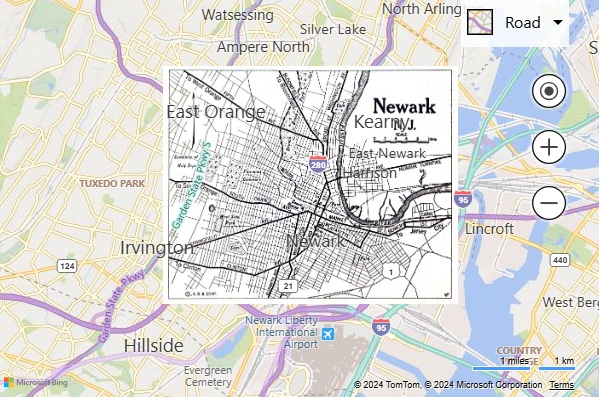
이전: Bing Maps
Bing Maps에서 지상 오버레이를 만들려면 오버레이 이미지에 대한 URL과 이미지를 맵에 바인딩하는 경계 상자를 지정해야 합니다. 이 예제에서는 뉴저지주 뉴어크의 1922년 맵 이미지를 맵에 오버레이합니다.
<!DOCTYPE html>
<html>
<head>
    <title></title>
    <meta charset="utf-8" />
    <meta http-equiv="x-ua-compatible" content="IE=Edge" />
    <meta name="viewport" content="width=device-width, initial-scale=1, shrink-to-fit=no" />

    <script type='text/javascript'>
        var map;

        function initMap() {
            map = new Microsoft.Maps.Map(document.getElementById('myMap'), {
                credentials: '<Your Bing Maps Key>',
                center: new Microsoft.Maps.Location(40.740, -74.18),
                zoom: 12
            });

            var overlay = new Microsoft.Maps.GroundOverlay({
                //Create a LocationRect from the edges of the bounding box; north, west, south, east.
                bounds: Microsoft.Maps.LocationRect.fromEdges(40.773941, -74.22655, 40.712216, -74.12544),
                imageUrl: 'newark_nj_1922.jpg'
            });
            map.layers.insert(overlay);
        }
    </script>

    <!-- Bing Maps Script Reference -->
    <script src="https://www.bing.com/api/maps/mapcontrol?callback=initMap" async defer></script>
</head>
<body>
    <div id='myMap' style='position:relative;width:600px;height:400px;'></div>
</body>
</html>
브라우저에서 이 코드를 실행하면 다음 이미지와 같은 맵이 표시됩니다.
이후: Azure Maps
Azure Maps에서는 atlas.layer.ImageLayer 클래스를 사용하여 지리 참조된 이미지를 오버레이할 수 있습니다. 이 클래스에는 이미지 URL과 이미지의 네 모퉁이 좌표 세트가 필요합니다. 동일한 도메인에 이미지를 호스팅하거나 COR을 사용하도록 설정해야 합니다.
팁
이미지의 각 모서리 좌표가 아닌 북쪽, 남쪽, 동쪽, 서쪽 및 회전 정보만 있는 경우 정적 atlas.layer.ImageLayer.getCoordinatesFromEdges 함수를 사용하면 됩니다.
<!DOCTYPE html>
<html>
<head>
    <title></title>
    <meta charset="utf-8" />
    <meta http-equiv="x-ua-compatible" content="IE=Edge" />
    <meta name="viewport" content="width=device-width, initial-scale=1, shrink-to-fit=no" />

    <!-- Add references to the Azure Maps Map control JavaScript and CSS files. -->
    <link rel="stylesheet" href="https://atlas.microsoft.com/sdk/javascript/mapcontrol/3/atlas.min.css" type="text/css" />
    <script src="https://atlas.microsoft.com/sdk/javascript/mapcontrol/3/atlas.min.js"></script>

    <script type='text/javascript'>
        var map;

        function initMap() {
            //Initialize a map instance.
            map = new atlas.Map('myMap', {
                center: [-74.18, 40.740],
                zoom: 12,

                //Add your Azure Maps key to the map SDK. Get an Azure Maps key at https://azure.com/maps. NOTE: The primary key should be used as the key.
                authOptions: {
                    authType: 'subscriptionKey',
                    subscriptionKey: '<Your Azure Maps Key>'
                }
            });

            //Wait until the map resources are ready.
            map.events.add('ready', function () {

                //Create an image layer and add it to the map.
                map.layers.add(new atlas.layer.ImageLayer({
                    url: 'newark_nj_1922.jpg',
                    coordinates: [
                        [-74.22655, 40.773941], //Top Left Corner
                        [-74.12544, 40.773941], //Top Right Corner
                        [-74.12544, 40.712216], //Bottom Right Corner
                        [-74.22655, 40.712216]  //Bottom Left Corner
                    ]
                }));
            });
        }
    </script>
</head>
<body onload="initMap()">
    <div id='myMap' style='position:relative;width:600px;height:400px;'></div>
</body>
</html>

추가 리소스
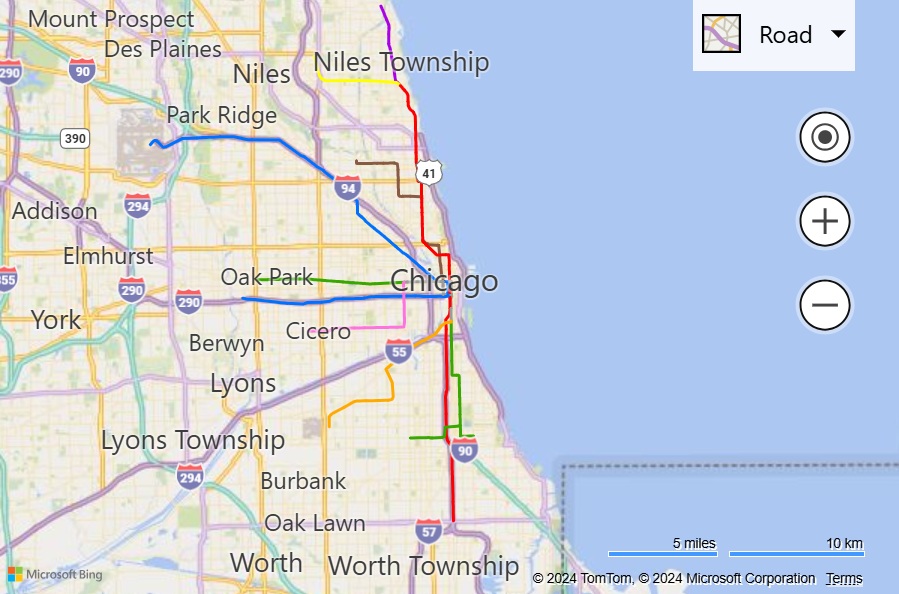
맵에 KML 데이터 추가
Azure 맵과 Bing 맵 모두 KML, KMZ, GeoRSS, GeoJSON 및 WKT(Well-Known Text) 데이터를 가져와서 맵에 렌더링할 수 있습니다. Azure Maps는 GPX, GML, 공간 CSV 파일, WMS(Web Mapping Services), WMTS(Web Mapping Tile Services) 및 WFS(Web Feature Services)도 지원합니다.
이전: Bing Maps
브라우저에서 이 코드를 실행하면 다음 이미지와 같은 맵이 표시됩니다.
<!DOCTYPE html>
<html>
<head>
    <title></title>
    <meta charset="utf-8" />
    <meta http-equiv="x-ua-compatible" content="IE=Edge" />
    <meta name="viewport" content="width=device-width, initial-scale=1, shrink-to-fit=no" />

    <script type='text/javascript'>
        var map;

        function initMap() {
            map = new Microsoft.Maps.Map('#myMap', {
                credentials: '<Your Bing Maps Key>',
                center: new Microsoft.Maps.Location(41.875825, -87.627515),
                zoom: 10
            });

            Microsoft.Maps.loadModule('Microsoft.Maps.GeoXml', function () {
                var callback = function (dataset) {
                    if (dataset.shapes) {
                        var l = new Microsoft.Maps.Layer();
                        l.add(dataset.shapes);
                        map.layers.insert(l);
                    }
                    if (dataset.layers) {
                        for (var i = 0, len = dataset.layers.length; i < len; i++) {
                            map.layers.insert(dataset.layers[i]);
                        }
                    }
                };
                Microsoft.Maps.GeoXml.readFromUrl('myKMLFile.kml', { error: function (msg) { alert(msg); } }, callback);
            });
        }
    </script>

    <!-- Bing Maps Script Reference -->
    <script src="https://www.bing.com/api/maps/mapcontrol?callback=initMap" async defer></script>
</head>
<body>
    <div id='myMap' style='position:relative;width:600px;height:400px;'></div>
</body>
</html>
이후: Azure Maps
Azure Maps에서 GeoJSON은 웹 SDK에서 사용되는 기본 데이터 형식으로, 공간 IO 모듈을 사용하여 더 많은 공간 데이터 형식을 쉽게 통합할 수 있습니다. 이 모듈에는 공간 데이터를 읽고 쓰는 기능이 있으며 이러한 공간 데이터 형식의 데이터를 쉽게 렌더링할 수 있는 간단한 데이터 계층도 포함되어 있습니다. 공간 데이터 파일의 데이터를 읽으려면 URL 또는 원시 데이터를 문자열 또는 Blob으로 atlas.io.read 함수에 전달합니다. 이렇게 하면 맵에 추가할 수 있는 파일에서 구문 분석된 모든 데이터가 반환됩니다. KML은 대부분의 공간 데이터 형식보다 약간 더 복잡합니다. 스타일링 정보를 훨씬 더 많이 포함하기 때문입니다.
SpatialDataLayer 클래스는 이러한 스타일 대부분의 렌더링을 지원하지만, 기능 데이터를 로드하기 전에 아이콘 이미지를 맵에 로드해야 하며, 지면 오버레이를 맵에 계층으로 별도로 추가해야 합니다. URL을 통해 데이터를 로드하는 경우 COR 지원 엔드포인트에 호스팅되거나 프록시 서비스가 읽기 함수에 옵션으로 전달되어야 합니다.
<!DOCTYPE html>
<html>
<head>
    <title></title>
    <meta charset="utf-8" />
    <meta http-equiv="x-ua-compatible" content="IE=Edge" />
    <meta name="viewport" content="width=device-width, initial-scale=1, shrink-to-fit=no" />

    <!-- Add references to the Azure Maps Map control JavaScript and CSS files. -->
    <link rel="stylesheet" href="https://atlas.microsoft.com/sdk/javascript/mapcontrol/3/atlas.min.css" type="text/css" />
    <script src="https://atlas.microsoft.com/sdk/javascript/mapcontrol/3/atlas.min.js"></script>

    <!-- Add reference to the Azure Maps Spatial IO module. -->
    <script src="https://atlas.microsoft.com/sdk/javascript/spatial/0/atlas-spatial.js"></script>

    <script type='text/javascript'>
        var map, datasource, layer;

        function initMap() {
            //Initialize a map instance.
            map = new atlas.Map('myMap', {
                view: 'Auto',

                //Add your Azure Maps key to the map SDK. Get an Azure Maps key at https://azure.com/maps. NOTE: The primary key should be used as the key.
                authOptions: {
                    authType: 'subscriptionKey',
                    subscriptionKey: '<Your Azure Maps Key>'
                }
            });

            //Wait until the map resources are ready.
            map.events.add('ready', function () {

                //Create a data source and add it to the map.
                datasource = new atlas.source.DataSource();
                map.sources.add(datasource);

                //Add a simple data layer for rendering the data.
                layer = new atlas.layer.SimpleDataLayer(datasource);
                map.layers.add(layer);

                //Read a KML file from a URL or pass in a raw KML string.
                atlas.io.read('myKMLFile.kml').then(async r => {
                    if (r) {

                        //Check to see if there are any icons in the data set that need to be loaded into the map resources.
                        if (r.icons) {
                            //For each icon image, create a promise to add it to the map, then run the promises in parallel.
                            var imagePromises = [];

                            //The keys are the names of each icon image.
                            var keys = Object.keys(r.icons);

                            if (keys.length !== 0) {
                                keys.forEach(function (key) {
                                    imagePromises.push(map.imageSprite.add(key, r.icons[key]));
                                });

                                await Promise.all(imagePromises);
                            }
                        }

                        //Load all features.
                        if (r.features && r.features.length > 0) {
                            datasource.add(r.features);
                        }

                        //Load all ground overlays.
                        if (r.groundOverlays && r.groundOverlays.length > 0) {
                            map.layers.add(r.groundOverlays);
                        }

                        //If bounding box information is known for data, set the map view to it.
                        if (r.bbox) {
                            map.setCamera({ bounds: r.bbox, padding: 50 });
                        }
                    }
                });
            });
        }
    </script>
</head>
<body onload="initMap()">
    <div id='myMap' style='position:relative;width:600px;height:400px;'></div>
</body>
</html>

추가 리소스
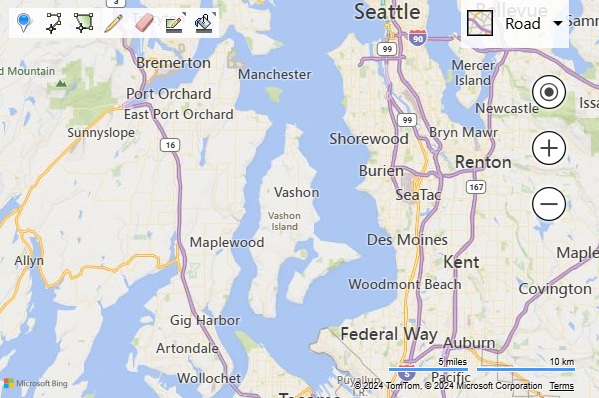
그리기 도구 추가
Bing 및 Azure Maps는 모두 사용자가 마우스 또는 기타 입력 디바이스를 사용하여 맵에서 셰이프를 그리고 편집할 수 있는 모듈을 제공합니다. 둘 다 핀, 선 및 다각형 그리기를 지원합니다. Azure Maps는 원과 사각형을 그리는 옵션도 제공합니다.
이전: Bing Maps
Bing Maps에서 DrawingTools 모듈은 Microsoft.Maps.loadModule 함수를 사용하여 로드됩니다. 모듈이 로드되면 DrawingTools 클래스의 인스턴스를 만들 수 있으며 맵에 도구 모음을 추가하기 위해 showDrawingManager 함수가 호출됩니다.
<!DOCTYPE html>
<html>
<head>
    <title></title>
    <meta charset="utf-8" />
    <meta http-equiv="x-ua-compatible" content="IE=Edge" />
    <meta name="viewport" content="width=device-width, initial-scale=1, shrink-to-fit=no" />

    <script type='text/javascript'>
    var map, drawingManager;

    function initMap() {
        map = new Microsoft.Maps.Map('#myMap', {
            credentials: '<Your Bing Maps Key>'
        });

        //Load the DrawingTools module
        Microsoft.Maps.loadModule('Microsoft.Maps.DrawingTools', function () {
            //Create an instance of the DrawingTools class and bind it to the map.
            var tools = new Microsoft.Maps.DrawingTools(map);

            //Show the drawing toolbar and enable editing on the map.
            tools.showDrawingManager(function (manager) {
                //Store a reference to the drawing manager as it will be useful later.
                drawingManager = manager;
            });
        });
    }
    </script>

    <!-- Bing Maps Script Reference -->
    <script src="https://www.bing.com/api/maps/mapcontrol?callback=initMap" async defer></script>
</head>
<body>
    <div id='myMap' style='position:relative;width:600px;height:400px;'></div>
</body>
</html>
이후: Azure Maps
Azure Maps에서 앱에 렌더링할 JavaScript 및 CSS 파일을 로드하여 그리기 도구 모듈을 로드해야 합니다. 맵이 로드되면 DrawingManager 클래스의 인스턴스를 만들고 DrawingToolbar 인스턴스를 연결할 수 있습니다.
<!DOCTYPE html>
<html>
<head>
    <title></title>
    <meta charset="utf-8" />
    <meta http-equiv="x-ua-compatible" content="IE=Edge" />
    <meta name="viewport" content="width=device-width, initial-scale=1, shrink-to-fit=no" />

    <!-- Add references to the Azure Maps Map control JavaScript and CSS files. -->
    <link rel="stylesheet" href="https://atlas.microsoft.com/sdk/javascript/mapcontrol/3/atlas.min.css" type="text/css" />
    <script src="https://atlas.microsoft.com/sdk/javascript/mapcontrol/3/atlas.min.js"></script>

    <!-- Add references to the Azure Maps Map Drawing Tools JavaScript and CSS files. -->
    <link rel="stylesheet" href="https://atlas.microsoft.com/sdk/javascript/drawing/0/atlas-drawing.min.css" type="text/css" />
    <script src="https://atlas.microsoft.com/sdk/javascript/drawing/0/atlas-drawing.min.js"></script>

    <script type='text/javascript'>
        var map, drawingManager;

        function initMap() {
            //Initialize a map instance.
            map = new atlas.Map('myMap', {
                view: 'Auto',

                //Add your Azure Maps key to the map SDK. Get an Azure Maps key at https://azure.com/maps. NOTE: The primary key should be used as the key.
                authOptions: {
                    authType: 'subscriptionKey',
                    subscriptionKey: '<Your Azure Maps Key>'
                }
            });

            //Wait until the map resources are ready.
            map.events.add('ready', function () {

                //Create an instance of the drawing manager and display the drawing toolbar.
                drawingManager = new atlas.drawing.DrawingManager(map, {
                    toolbar: new atlas.control.DrawingToolbar({ position: 'top-left' })
                });
            });
        }
    </script>
</head>
<body onload="initMap()">
    <div id="myMap" style="position:relative;width:600px;height:400px;"></div>
</body>
</html>

팁
Azure Maps 레이어에서 그리기 도구는 사용자가 도형을 그릴 수 있는 여러 가지 방법을 제공합니다. 예를 들어 다각형을 그릴 때 사용자는 클릭하여 각 포인트를 추가하거나 마우스 왼쪽 단추를 누른 채 마우스를 끌어 경로를 그릴 수 있습니다. 이는 interactionType의 DrawingManager 옵션을 사용하여 수정할 수 있습니다.
추가 리소스
추가 리소스
오픈 소스 Azure Maps 웹 SDK 모듈을 살펴봅니다. 이러한 모듈은 더 많은 기능을 제공하며 완벽하게 사용자 지정할 수 있습니다.
다른 Bing Maps 기능 마이그레이션과 관련된 코드 샘플을 검토합니다.
데이터 시각화
서비스
Azure Maps 웹 SDK에 대해 자세히 알아보세요.
다음 단계
Bing Maps에서 Azure Maps로 마이그레이션하는 방법에 대해 자세히 알아보세요.