本教學課程示範如何使用 Jupyter 筆記本與 Power BI 互動,以及偵測資料表與 SemPy 程式庫之間的關聯性。
在本教學課程中,您會了解如何:
- 使用語意連結的 Python 程式庫 (SemPy) 探索語意模型 (Power BI 資料集) 中的關聯性。
- 使用與 Power BI 整合的 SemPy 元件,並自動化資料品質分析。 這些元件包括:
-
FabricDataFrame- 透過語義資訊增強的類似 PANDAS 的結構 - 將語意模型從 Fabric 工作區提取至筆記本的函式
- 測試功能相依性並識別語意模型中關係違規的函數
-
必要條件
取得 Microsoft Fabric 訂用帳戶。 或註冊免費的 Microsoft Fabric 試用版。
登入 Microsoft Fabric。
使用首頁左下方的體驗切換器,切換至 Fabric。
![體驗切換器功能表的螢幕擷取畫面,顯示選取 [資料科學] 的位置。](media/tutorial-data-science-prepare-system/switch-to-data-science.png)
移至導覽窗格中的 工作區 ,然後選取您的工作區以將其設定為目前的工作區。
從 fabric-samples GitHub 存放庫下載 Customer Profitability Sample.pbix 和 Customer Profitability Sample (auto).pbix 語意模型,然後將它們上傳至您的工作區。
在筆記本裡跟著操作
使用 powerbi_relationships_tutorial.ipynb 筆記本進行操作。
若要開啟本教學課程隨附的筆記本,請遵循在「準備系統以進行數據科學教學」及的指示,將筆記本匯入您的工作區。
如果您想要複製並貼上此頁面中的程式碼,則可以建立新的筆記本。
開始執行程式碼之前,請務必將 Lakehouse 連結至筆記本。
設定筆記本
使用您需要的模組和資料設定筆記本環境。
使用筆記本中的內嵌命令,
%pip從 PyPI 安裝semantic-link套件。%pip install semantic-link匯入
sempy您稍後要使用的模組。import sempy.fabric as fabric from sempy.relationships import plot_relationship_metadata from sempy.relationships import find_relationships from sempy.fabric import list_relationship_violations匯入
pandas資源庫並設定輸出格式的顯示選項。import pandas as pd pd.set_option('display.max_colwidth', None)
## Explore semantic models

This tutorial uses the Customer Profitability Sample semantic model [_Customer Profitability Sample.pbix_](https://github.com/microsoft/fabric-samples/blob/main/docs-samples/data-science/datasets/Customer%20Profitability%20Sample.pbix). Learn about the semantic model in [Customer Profitability sample for Power BI](/power-bi/create-reports/sample-customer-profitability).

- Use SemPy's `list_datasets` function to explore semantic models in your current workspace:

  ```python
  fabric.list_datasets()
針對本筆記本的其餘部分,請使用兩個版本的客戶獲利能力範例語意模型:
- 客戶獲利能力範例:Power BI 範例中提供的語意模型,具有預先定義的資料表關聯性
- 客戶獲利能力範例 (自動):相同的資料,但關聯性僅限於 Power BI 自動偵測的關聯性
從範例語意模型擷取預先定義的關聯性
使用 Sempy 的
list_relationships函式,在客戶獲利能力範例語意模型中載入預先定義的關聯性。 函式會列出表格式物件模型 (TOM) 中的關聯性。dataset = "Customer Profitability Sample" relationships = fabric.list_relationships(dataset) relationships使用 Sempy 的
plot_relationship_metadata函數將 DataFrame 視覺化relationships為圖表。plot_relationship_metadata(relationships)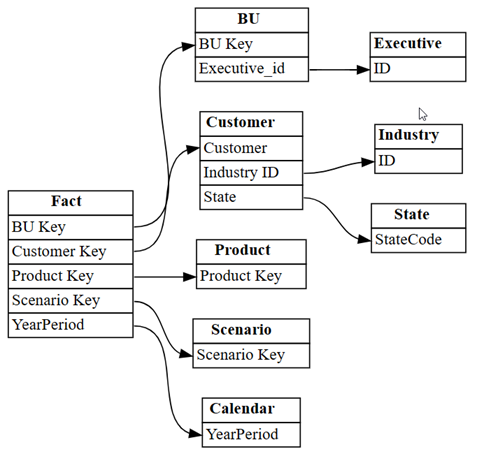
此圖表顯示此語意模型中資料表之間的關聯性,如主題專家在 Power BI 中定義。

探索其他關係
如果您從 Power BI 自動偵測的關聯性開始,則會有較小的集合。
將 Power BI 在語意模型中自動偵測到的關聯性視覺化:
dataset = "Customer Profitability Sample (auto)"
autodetected = fabric.list_relationships(dataset)
plot_relationship_metadata(autodetected)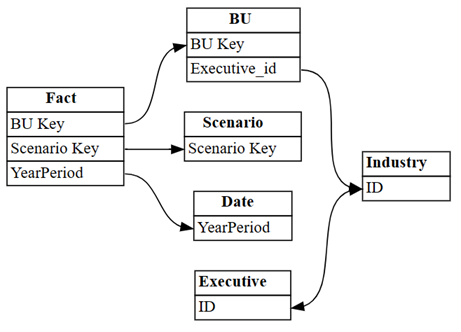
Power BI 的自動偵測會遺漏許多關聯性。 此外,其中兩個自動偵測的關聯性在語意上不正確:
-
Executive[ID]->Industry[ID] -
BU[Executive_id]->Industry[ID]
-
將關聯性列印為資料表:
autodetected第 3 列和第 4 列顯示與表格的
Industry不正確關係。 移除這些資料列。捨棄未能正確識別的關聯性。
# Remove rows 3 and 4 which point incorrectly to Industry[ID]
autodetected = autodetected[~autodetected.index.isin([3, 4])]
現在你有正確但不完整的關係。 使用視覺
plot_relationship_metadata化這些不完整的關係:plot_relationship_metadata(autodetected)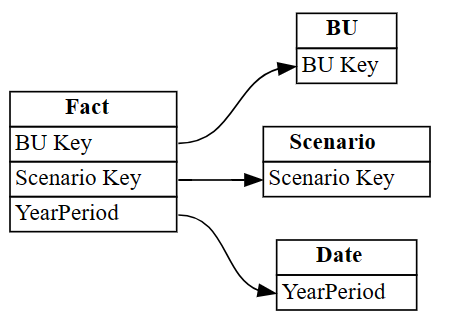
使用 SemPy 和
list_tablesread_table函數從語義模型加載所有表,然後使用find_relationships查找表之間的關係。 檢閱記錄輸出,以深入瞭解此函式的運作方式:suggested_relationships_all = find_relationships( tables, name_similarity_threshold=0.7, coverage_threshold=0.7, verbose=2 )將新探索到的關聯性視覺化:
plot_relationship_metadata(suggested_relationships_all)
SemPy 會偵測所有關係。
使用
exclude參數,將搜尋限制為先前未識別的其他關聯性:additional_relationships = find_relationships( tables, exclude=autodetected, name_similarity_threshold=0.7, coverage_threshold=0.7 ) additional_relationships


驗證關聯性
首先,從 客戶獲利能力範例 語意模型載入資料。
dataset = "Customer Profitability Sample"
tables = {table: fabric.read_table(dataset, table) for table in fabric.list_tables(dataset)['Name']}

tables.keys()
檢查主索引鍵和外部索引鍵是否與函數重
list_relationship_violations疊。 將函數的list_relationships輸出傳遞給list_relationship_violations。list_relationship_violations(tables, fabric.list_relationships(dataset))結果揭示了有用的見解。 例如,中的
Fact[Product Key]七個值之一不存在Product[Product Key]於 中,而遺漏的索引鍵是50。探索性資料分析和資料清洗是迭代的。 您學到的內容取決於您的問題以及您探索資料的方式。 語意連結新增工具,可協助您處理資料執行更多動作。
相關內容
探索語義連結和 SemPy 的其他教學:
\n\n