Note
Access to this page requires authorization. You can try signing in or changing directories.
Access to this page requires authorization. You can try changing directories.
This article explains how to monitor, diagnose, and troubleshoot Azure network resources by using Network Watcher tools, flow logs, Traffic Analytics, and Azure Monitor Network Insights. Use this guidance to plan a network observability strategy that gives you visibility into traffic patterns, connectivity health, and security events.
What this article covers
Network monitoring in Azure spans diagnostics, flow visibility, connectivity testing, and operational dashboards. Azure provides purpose-built tools at different layers of the monitoring stack:
- Diagnostics and troubleshooting: Identify why a specific packet is allowed or denied, trace the route a packet takes, and capture traffic for deep analysis.
- Flow visibility: Record metadata about every network flow across your virtual networks for security investigation, compliance, and capacity planning.
- Connectivity monitoring: Continuously test reachability between endpoints (Azure, on-premises, and external) and alert when connectivity degrades.
- Operational dashboards: Visualize network topology, health, and metrics across subscriptions without deploying agents.
This article covers the tools that address each layer and helps you choose the right combination for your environment.
Who needs this article
Read this article if one or more of these conditions apply:
- You need visibility into network traffic, connectivity health, routing decisions, or security events in Azure.
- You need tools to troubleshoot packet filtering, next hops, tunnel health, or unexpected connectivity failures.
- You need flow logs, traffic analytics, or dashboards for security investigations, capacity planning, or operations.
- You need continuous monitoring for Azure, on-premises, or cross-cloud network paths.
Tip
Following a scenario path? Select your scenario at the top of the page for tailored guidance. The core guidance that follows applies to all readers.
Lift-and-shift focus: Set up monitoring after you establish your migration baseline. You need network observability to validate that connectivity works as expected, performance meets your requirements, and traffic patterns match your pre-migration documentation. Network Watcher provides immediate visibility into whether your migrated workloads can reach their dependencies.
Modernization focus: Monitoring is part of your target design, not an afterthought. Production readiness requires network observability from day one. Your AKS and App Service Environment (ASE) workloads generate complex traffic patterns across multiple spokes, regions, and private endpoints that you must monitor proactively.
Cross-cloud focus: Monitoring is essential because cross-cloud estates are operationally harder to troubleshoot. When traffic crosses encrypted VPN tunnels between Azure and AWS or Google Cloud, you lose visibility at the tunnel boundary. You need monitoring tools on the Azure side to detect latency increases, packet loss, and connectivity failures across cloud boundaries.
Azure services and features
The following table describes the core monitoring and diagnostics tools available in Azure networking.
| Tool | What it provides | When to use it |
|---|---|---|
| Network Watcher | Platform service that provides diagnostics, monitoring, and logging capabilities for Azure virtual networks. Automatically enabled per region when you create a virtual network. | Starting point for any network troubleshooting. Use IP flow verify, next hop, and packet capture for real-time diagnostics. |
| VNet flow logs | Record metadata (source, destination, port, protocol, action) for all traffic flowing through a virtual network. Evaluates both NSG rules and Azure Virtual Network Manager security admin rules. | Enable on all production virtual networks for security investigation, compliance auditing, and capacity planning. Replaces NSG flow logs. |
| NSG flow logs (retiring) | Record traffic decisions made by network security groups at the subnet or NIC level. | Legacy deployments only. Migrate to VNet flow logs before September 30, 2027. No new NSG flow logs can be created after June 30, 2025. |
| Traffic Analytics | Aggregates and visualizes flow log data in a Log Analytics workspace. Shows traffic patterns, top talkers, open ports, and geographic flow distribution. | Gain operational visibility from flow log data without writing custom queries. Identify anomalies and security risks across your network. |
| Connection Monitor | Continuously tests connectivity between source and destination endpoints using TCP, ICMP, or HTTP probes. Supports Azure VMs, on-premises hosts (via Azure Arc), and external URLs. | Monitor SLA compliance for hybrid connections, detect connectivity regressions, and validate that firewall rules permit expected traffic. |
| Packet Capture | Captures packets to and from a virtual machine without requiring access to the VM. Stores captures in a storage account or locally on the VM. | Deep-packet analysis during security investigations or when diagnosing application-layer connectivity problems. |
| IP Flow Verify | Tests whether a specific packet is allowed or denied by evaluating NSG rules and AVNM security admin rules for a five-tuple (source IP, destination IP, source port, destination port, protocol). | Troubleshoot why a VM can't reach a destination or why traffic is unexpectedly blocked. Get immediate results without packet capture. |
| Next Hop | Shows the next hop type and IP address for traffic leaving a specific network interface. Evaluates effective routes including user-defined routes, BGP routes, and system routes. | Diagnose asymmetric routing, verify that traffic flows through an expected network virtual appliance, or identify why traffic is being dropped. |
| Azure Monitor Network Insights | Provides a complete topology view and health metrics for all deployed network resources without requiring agent installation or additional configuration. | Operational dashboards that show resource health, metrics, and dependencies across subscriptions, resource groups, and regions. |
How to choose
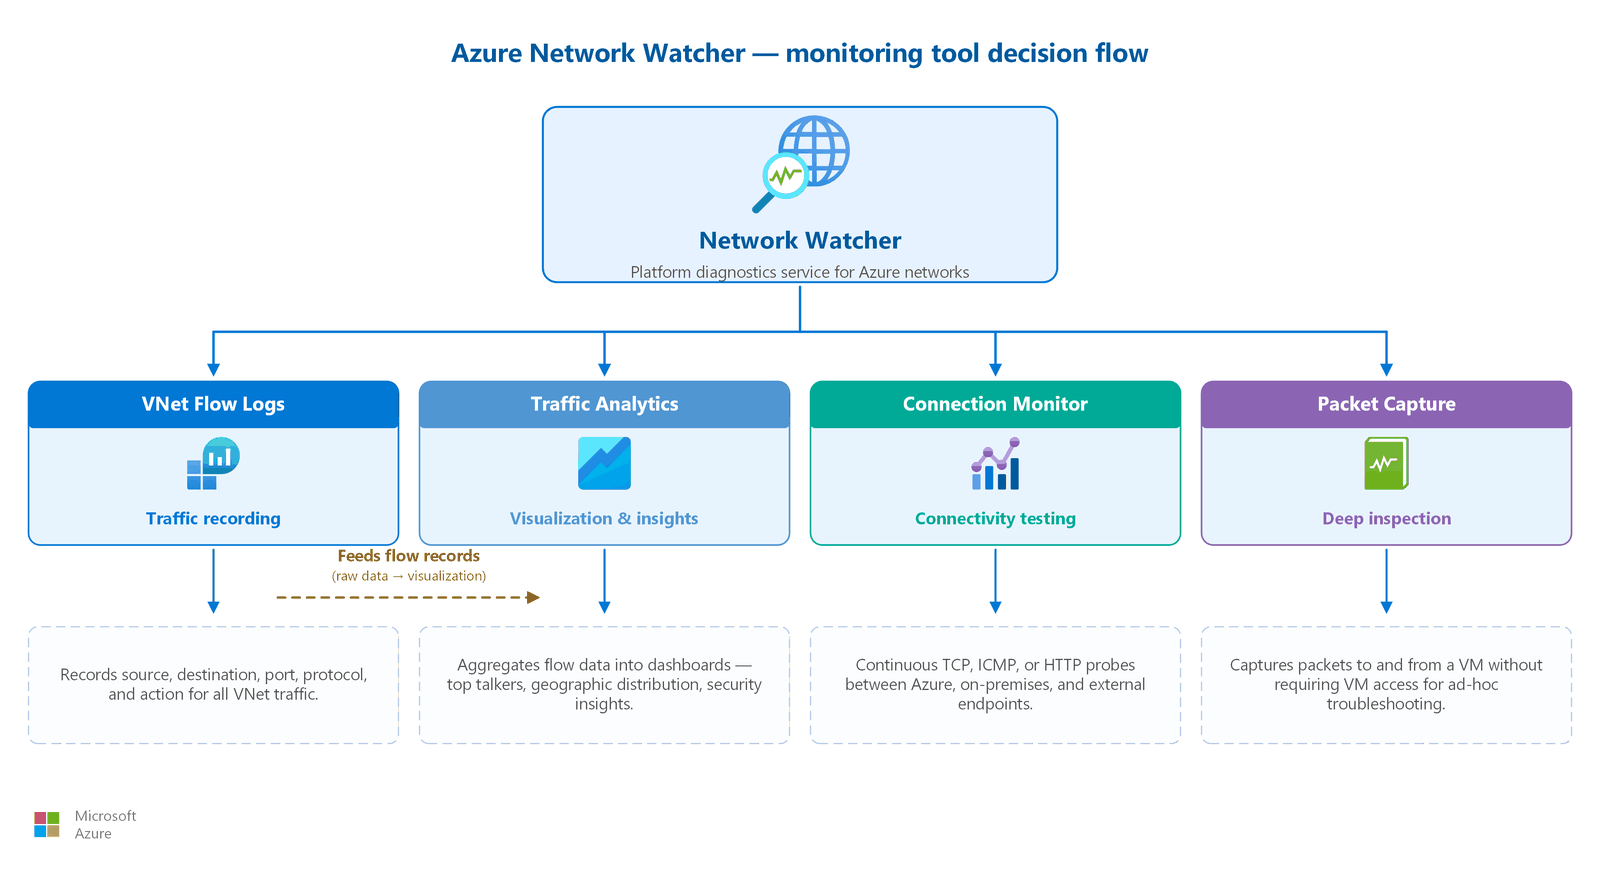
Start with Network Watcher for troubleshooting
Network Watcher is your first stop for diagnosing connectivity problems. It's automatically enabled in every region where you have a virtual network. There's no additional setup required.
Use the following approach when troubleshooting:
- IP Flow Verify: Check whether traffic is allowed or denied and find the rule responsible for that decision. This tool tests against NSG rules and Azure Virtual Network Manager (AVNM) security admin rules.
- Next Hop: Confirm the routing path and identify whether traffic reaches the intended next hop (internet, virtual network gateway, NVA, or none).
- Packet Capture: If IP Flow Verify and Next Hop don't reveal the problem, capture packets for protocol-level analysis.
Build visibility with flow logs
After you establish diagnostic capabilities, turn on flow logging for ongoing visibility:
- Enable VNet flow logs on all production virtual networks. VNet flow logs record traffic for the entire virtual network, so you don't need to configure logging at multiple NSG levels. This approach also avoids duplicate records.
- Enable Traffic Analytics to aggregate flow data into dashboards you can act on. Traffic Analytics requires a Log Analytics workspace. Use a workspace in any supported region without incurring extra data transfer charges.
- Set retention policies based on your compliance requirements. Flow log records stored in Azure Storage follow the storage account's lifecycle management policies.
Add continuous monitoring for SLA-critical paths
For connections where downtime has business impact:
- Deploy Connection Monitor tests between Azure VMs, on-premises endpoints, and external URLs.
- Configure alerts to trigger when latency, packet loss, or reachability thresholds are exceeded.
- Use Network Insights for a topology view that correlates health metrics across your entire network without deploying extra agents.
Decision summary
| Monitoring need | Primary tool | Supports hybrid | Requires agent |
|---|---|---|---|
| "Why is this packet blocked?" | IP Flow Verify | No | No |
| "Where does this traffic go?" | Next Hop | No | No |
| "What happened in the last hour?" | Packet Capture | No | No |
| "What's the traffic pattern across my VNet?" | VNet flow logs + Traffic Analytics | No | No |
| "Is my hybrid connection healthy?" | Connection Monitor | Yes (Azure Arc) | Yes (source only) |
| "What's the overall health of my network?" | Network Insights | Partial | No |
Design considerations
Your monitoring priority is baseline validation after migration. Focus on confirming that migrated workloads can reach their dependencies and that performance meets expectations.
- Network Watcher for connectivity validation: Use IP Flow Verify and Next Hop to confirm that NSG rules and route tables permit the traffic your migrated applications need. Run these checks systematically for each migrated workload.
- VNet flow logs for baseline traffic patterns: Enable VNet flow logs on production virtual networks to capture the actual traffic patterns of your migrated workloads. Compare flow data against your pre-migration documentation to verify that all expected communication paths are working.
- Connection Monitor for hybrid paths: Deploy Connection Monitor tests between Azure VMs and on-premises endpoints to continuously validate that VPN or ExpressRoute connections keep acceptable latency and availability.
- Deferred advanced monitoring: Configure Traffic Analytics and advanced alerting after the initial migration stabilizes. Start with the diagnostics tools to validate connectivity before investing in long-term operational dashboards.
Your monitoring strategy supports production workloads from the first deployment. AKS clusters, App Service Environments, and multiregion active-active architectures require full observability.
- VNet flow logs across all spokes: Enable VNet flow logs across all spoke virtual networks. Your containerized workloads generate traffic patterns that span multiple subnets and private endpoints within each spoke.
- Traffic Analytics for operational visibility: Deploy Traffic Analytics with a Log Analytics workspace to aggregate flow data across all spokes. Network operators use Traffic Analytics dashboards to identify top talkers, anomalous flows, and capacity trends across the estate.
- App team monitoring responsibility: Application teams monitor their own workloads (AKS metrics, ASE diagnostics). Central network operations monitors the shared infrastructure: hub firewalls, VPN gateways, peering links, and cross-region connectivity.
- Connection Monitor for multiregion: Deploy Connection Monitor tests between regions to continuously validate that inter-hub connectivity meets your active-active SLA requirements. Configure alerts for latency increases that might indicate backbone congestion or routing changes.
- Connection Monitor for end-to-end performance: Use Connection Monitor to track end-to-end performance across your hub-spoke topology, including traffic that traverses Azure Firewall in each regional hub. Connection Monitor replaces the deprecated Network Performance Monitor and provides unified topology views across Azure, on-premises, and internet hops.
Cross-cloud environments present unique monitoring challenges because you lose visibility at the VPN tunnel boundary. Traffic that enters an IPsec tunnel to AWS or Google Cloud disappears from Azure-side monitoring until a response returns.
- Cross-cloud traffic monitoring: Enable VNet flow logs on the virtual network that hosts your VPN Gateway or Virtual WAN hub. These logs capture traffic entering and leaving the cross-cloud tunnels, giving you volumetric data and protocol distribution for cross-cloud communication.
- Latency measurement: Deploy Connection Monitor tests from Azure VMs to endpoints in AWS or Google Cloud. Use ICMP or TCP probes to measure round-trip latency across the encrypted tunnels. Set alert thresholds based on your application requirements.
- Troubleshooting encrypted tunnels: When cross-cloud connectivity fails, use Network Watcher's Next Hop and IP Flow Verify to confirm that Azure-side routing and NSG rules still direct traffic toward the VPN Gateway. VPN Gateway diagnostics logs show IKE negotiation status and tunnel health.
- Monitoring both sides: Azure monitoring covers the Azure side of cross-cloud connectivity. Coordinate with your AWS CloudWatch or Google Cloud Monitoring configuration to get end-to-end visibility. Alert on tunnel state changes from both providers.
- Network Watcher as the starting point: Use Network Watcher diagnostics to isolate whether connectivity failures originate on the Azure side (NSG rules, route tables, gateway configuration) or the remote side (AWS or Google Cloud firewall rules, VPN configuration).
Monitor network costs
Networking is a recurring cost that monitoring should make visible. Use Microsoft Cost Management to identify which resources drive your network spend. Data processed by Azure Firewall, gateway scale units, public IP addresses, inter-region and global-peering data transfer, and Log Analytics ingestion are common contributors. Filter cost analysis by the Microsoft.Network resource provider, group by resource, and set budget alerts so unexpected increases (for example, a surge in cross-region replication traffic) surface early. Correlate cost spikes with flow logs and Traffic Analytics to find the traffic patterns behind them.
Prerequisites
Before you implement network monitoring, verify that you meet the following requirements:
- Network Watcher enabled: Network Watcher is automatically enabled per region when you create or update a virtual network. If your organization opted out of automatic enablement, enable Network Watcher manually for each required region. Opting out requires an Azure Support request to reverse.
- Log Analytics workspace: Required for Traffic Analytics and Connection Monitor. The workspace can be in any supported region. No extra cross-region data transfer charges apply.
- Storage account: Required for flow log storage and packet capture output. Use lifecycle management rules to control retention and cost.
- Azure Arc agent (hybrid only): Required on on-premises machines that serve as Connection Monitor source endpoints. Destination endpoints don't require an agent. Monitor any URL, FQDN, or IP address.
- VNet flow logs replacing NSG flow logs: If you currently use NSG flow logs, plan your migration to VNet flow logs before the retirement date.
NSG flow logs to VNet flow logs migration
Important
NSG flow logs retire on September 30, 2027. You can't create new NSG flow logs after June 30, 2025. Migrate to VNet flow logs to keep traffic visibility.
VNet flow logs provide the same capabilities as NSG flow logs, plus:
- Coverage of all traffic within a virtual network, including traffic that NSGs don't process
- Evaluation of Azure Virtual Network Manager security admin rules
- Evaluation of VNet encryption status
- Simplified scope: no need to configure logging at both subnet and network interface card (NIC) levels
- No duplicate log records
Migration steps:
- Identify all virtual networks with active NSG flow logs.
- Enable VNet flow logs on each virtual network with the same destination storage account and Traffic Analytics configuration.
- Verify that VNet flow log data appears in Traffic Analytics.
- Turn off NSG flow logs to avoid duplicate recording and unnecessary storage costs.
Tip
Turn off NSG flow logs after confirming that VNet flow logs are recording correctly. Running both simultaneously creates duplicate records and doubles storage costs.
Azure provides both a migration script and an Azure Policy path for automated migration at scale.
Security considerations
Protect monitoring data and control access to diagnostic tools. The following subsections cover data sensitivity, retention, probe security, and role-based access.
Flow log data sensitivity
Flow log records contain metadata about all network traffic, including source and destination IP addresses, ports, protocols, and actions. Treat flow log data as sensitive:
- Store flow logs in a storage account with appropriate access controls and encryption.
- Limit access to the Log Analytics workspace that receives Traffic Analytics data by using Azure RBAC.
- Apply the principle of least privilege: network operators might need Traffic Analytics dashboards but not raw flow log access.
Diagnostic data retention
- Define retention policies based on your organization's compliance requirements, such as PCI DSS, HIPAA, or SOC 2.
- Use Azure Storage lifecycle management to automatically archive or delete flow log data after the required retention period.
- Monitor storage account costs. High-throughput networks generate large volumes of flow log data.
Connection Monitor security
- Connection Monitor probe traffic originates from Azure infrastructure. Make sure that NSG rules allow the probe source ranges (use the
AzureMonitorservice tag for simplicity). - For on-premises sources, the Azure Arc agent keeps a secure connection to Azure. Follow your organization's agent security policies.
Network Watcher access control
Network Watcher operations require specific Azure RBAC roles. Follow the principle of least privilege:
| Role | Capabilities |
|---|---|
| Network Contributor | Full Network Watcher access, including packet capture and flow log configuration |
| Reader | View Network Watcher resources and topology |
| Custom role | Scope to specific operations (IP Flow Verify, Next Hop) without full contributor access |
Related articles
- Network security groups and application security groups: NSG rules that flow logs evaluate.
- Azure Firewall and network segmentation: Firewall diagnostic logging and metrics.
- Hub-spoke network topology: Hub-level visibility and centralized monitoring.
- Azure Virtual Network Manager and centralized management: AVNM security admin rules evaluated by VNet flow logs.
Learn more
- Network Watcher overview
- VNet flow logs overview
- NSG flow logs migration
- Traffic Analytics
- Connection Monitor overview
- Azure Monitor Network Insights
- IP flow verify
- Next hop
Next steps
Tip
Finished exploring? You've reached the end of the main Azure networking design guide. Return to the overview navigator to revisit any capability area, or continue to Azure Virtual Network Manager for centralized network management across many virtual networks.
You've completed the lift-and-shift networking path. You now have a hub-and-spoke topology with VPN/ExpressRoute hybrid connectivity, centralized Azure Firewall for east-west and outbound traffic, Bastion for secure admin access, and Network Watcher monitoring your migration baseline.
If your requirements have expanded, revisit the conditional articles in your scenario guide for internet ingress, WAF, DDoS, and multiregion options.
Centralized network management. Optional: If your migration created a multi-VNet estate, use Azure Virtual Network Manager for centralized governance.
Return to the overview: Explore other capabilities or review your architecture.
You've completed the modernization networking path. You now have a dual-hub, multiregion architecture with Front Door or Traffic Manager for global ingress, Private Link for secure PaaS connectivity, layered security through Azure Firewall and WAF, and end-to-end monitoring across your application tiers.
If your requirements have expanded beyond the essential stack, revisit the supplemental articles in your scenario guide for advanced networking features like cross-region failover and additional security layers.
Centralized network management. Optional: If your estate spans multiple subscriptions and teams, use Azure Virtual Network Manager for centralized policy management.
Return to the overview: Explore other capabilities or review your architecture.
You've completed the cross-cloud networking path. You now have Transit Gateway equivalence through Azure Virtual WAN, VPN tunnels connecting your AWS VPCs and Google Cloud VPCs to Azure, DNS cutover with Private DNS Resolver for cross-cloud name resolution, and secure virtual hub inspection for all inter-cloud traffic.
If your requirements have expanded, revisit the conditional articles in your scenario guide for internet ingress, WAF, DDoS, and multiregion options.
Centralized network management. Optional: If the Azure side grows into a governed multisubscription estate, use Azure Virtual Network Manager for centralized management.
Return to the overview: Explore other capabilities or review your architecture.