Note
Access to this page requires authorization. You can try signing in or changing directories.
Access to this page requires authorization. You can try changing directories.
Microsoft industry clouds consist of elements distributed across Microsoft Cloud including Azure, Microsoft 365, Power Platform, and Dynamics 365. These solutions can incorporate data from both internal and external sources, and implementers might introduce customizations or use solutions from independent software vendors (ISVs) to extend functionalities.
Given the complexity of this architecture, it becomes crucial to track customer usage and monitor the system's health and performance effectively. Centralized monitoring is essential to optimize resource performance and availability while proactively identifying and addressing potential issues.
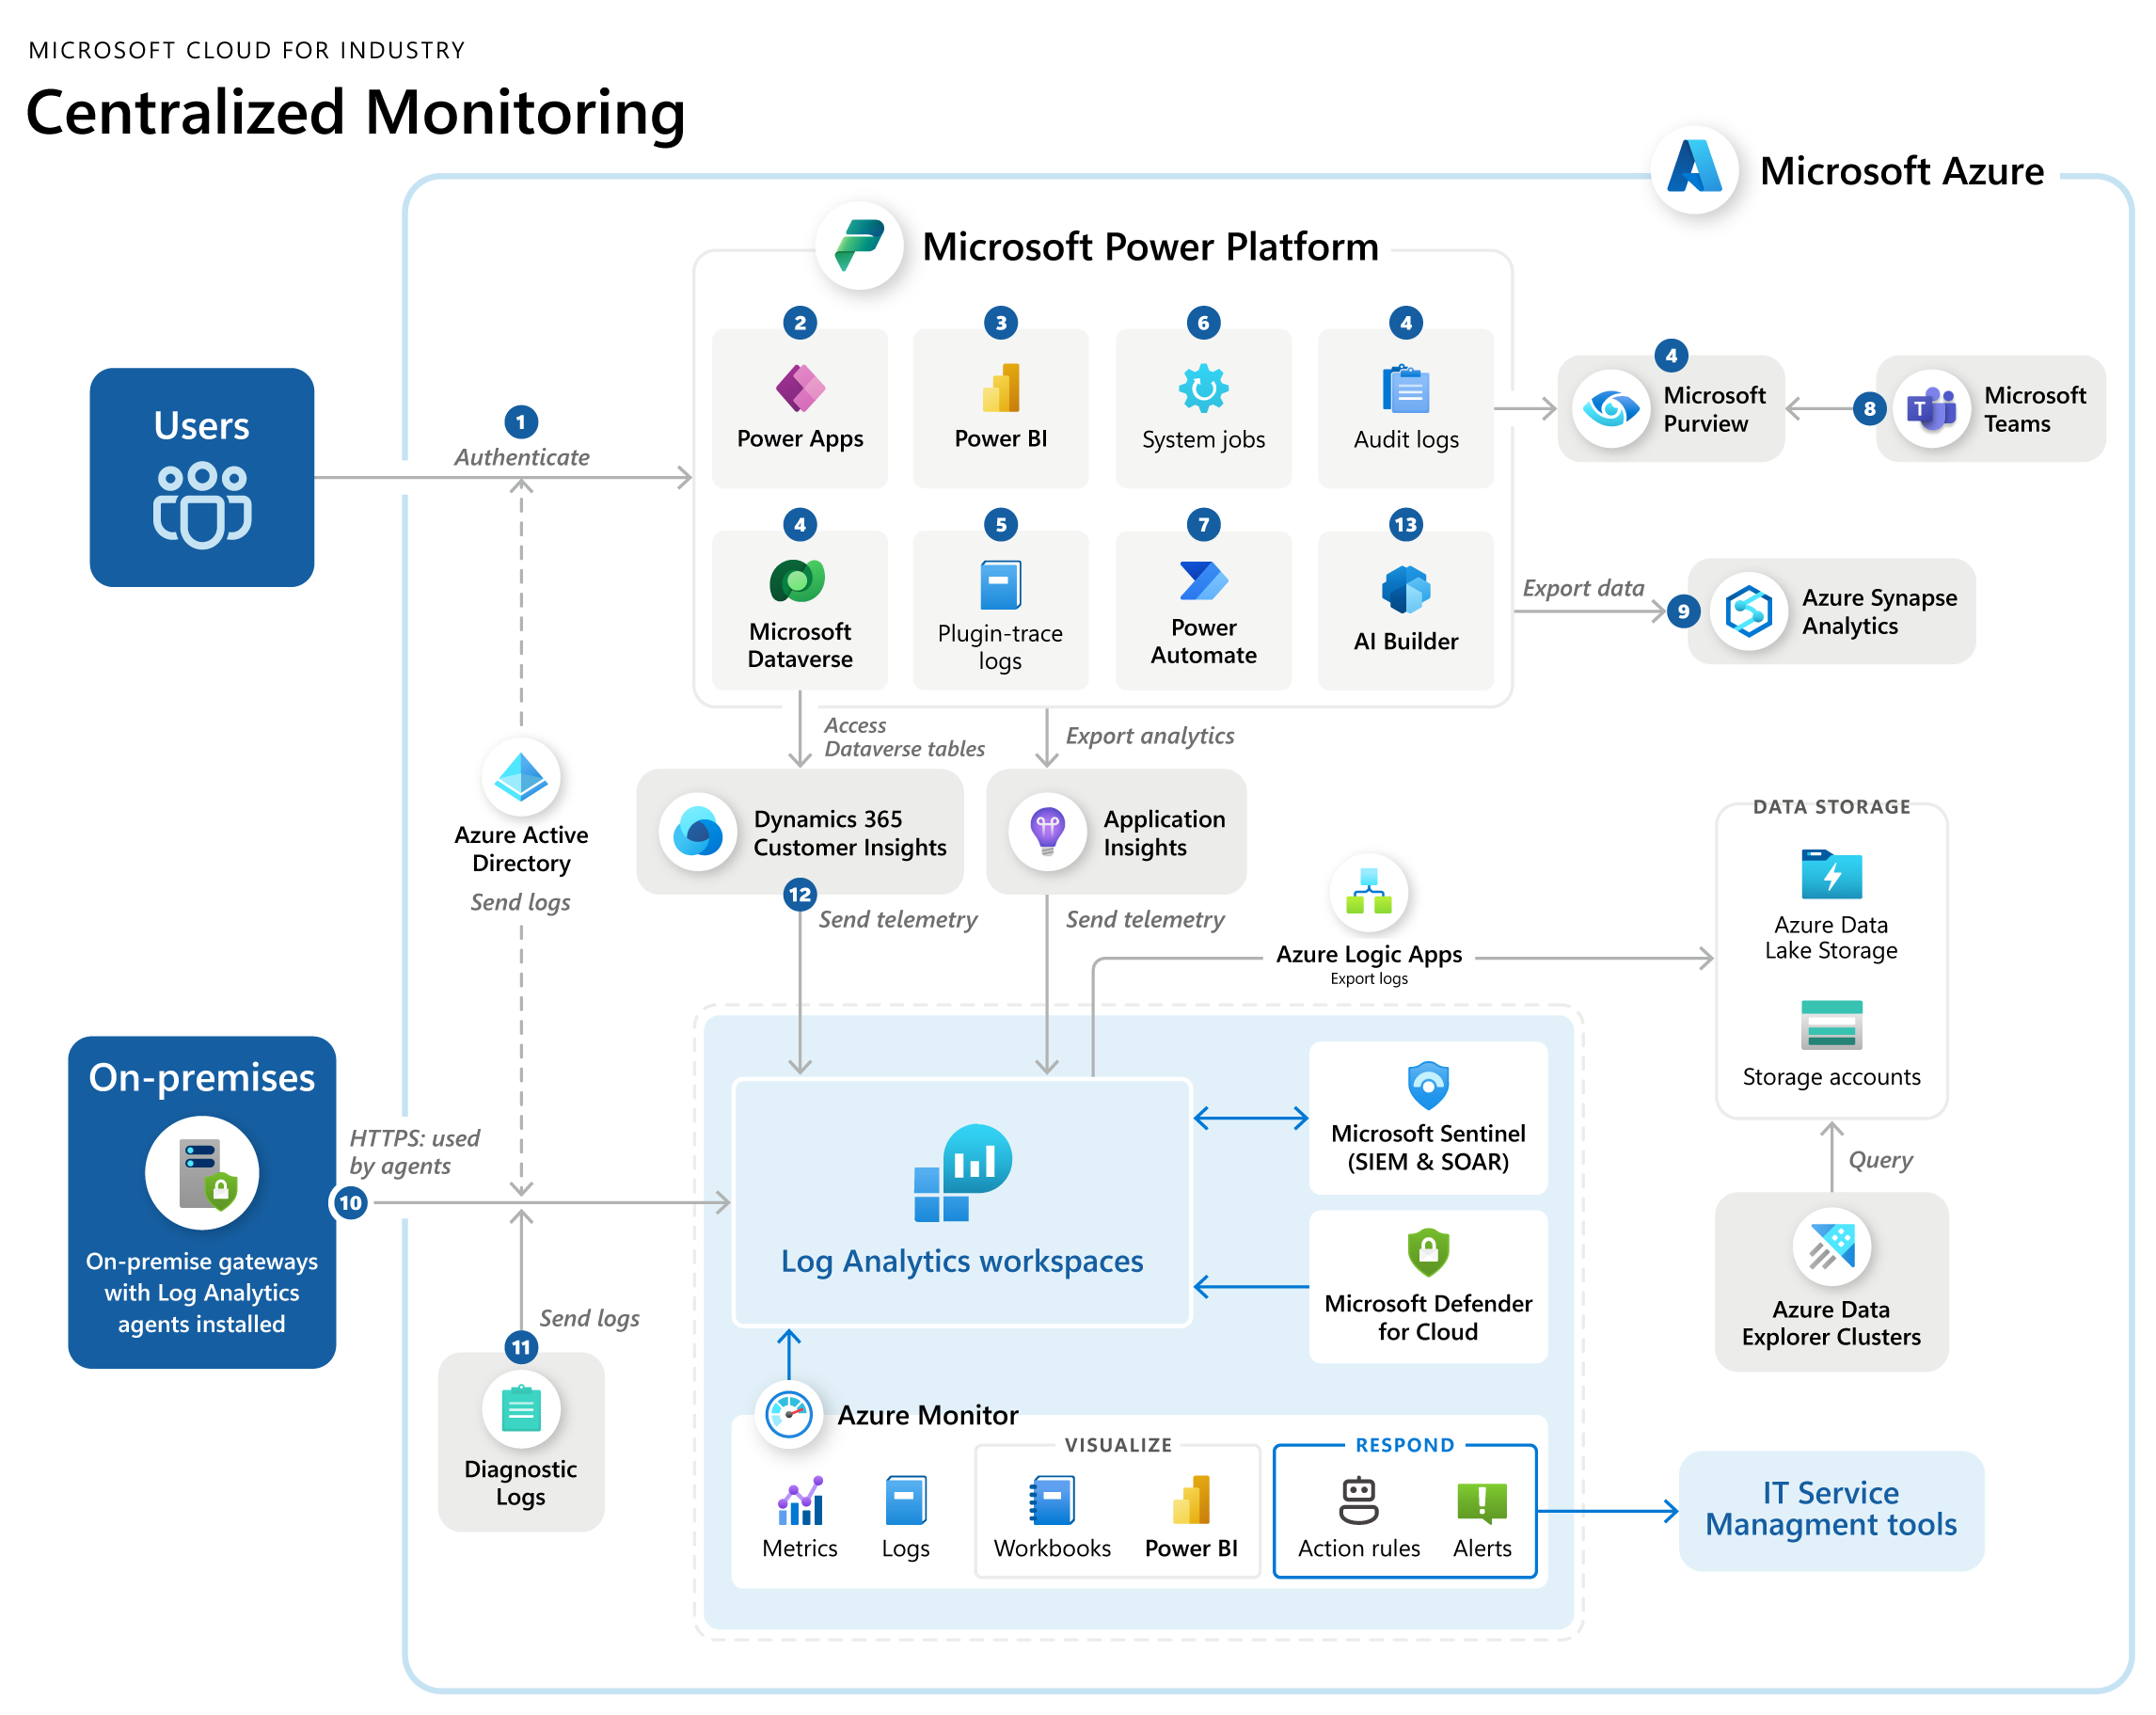
With this objective in mind, we've crafted the following reference operational monitoring architecture to establish a solid groundwork. However, it's essential to assess each solution individually, considering specific components and integration points to extend and tailor this reference architecture accordingly. Be sure to follow product documentation guidelines based on the industry cloud and solution product you implement.
Download a printable PDF of this diagram.
This architecture seamlessly integrates various monitoring capabilities and includes the following products:
- Power Platform admin center
- Azure Monitor
- Microsoft Defender for Cloud
- Microsoft Purview
- Microsoft Sentinel
To centralize logging and monitoring, you can send logs generated by Azure resources for identity, connectivity, and preprocessing, plus logs generated by other cloud resources, with on-premises data gateways to an Azure Log Analytics workspace. Use Azure Monitor to perform the following actions:
- Centralize the aggregated logs
- Monitor
- Visualize through Power BI and workbooks
- Respond via alerts or defined action groups and rules.
You can export aggregated logs to other storage options for later analysis via Azure Data Explorer.
The following table presents how each solution component in the diagram generates its operational and audit logs, how to monitor them, and how to define an alert mechanism.
| Number | Solution component | Monitoring | Logging | Auditing | Alerts |
|---|---|---|---|---|---|
| 1 | Authentication to PowerApps | Microsoft Entra ID sign-in logs or those activity Logs sent to Azure Monitor | Sign-in, provisioning, and audit logs in Microsoft Entra ID | Changes to applications, groups, users, and licenses in Microsoft Entra ID | Custom Azure Monitor alerts SIEM: Microsoft Sentinel Cybersecurity: Microsoft Defender |
| 2 | Model-driven app and PCF Controls | Dataverse analytics | Telemetry events for model-driven apps | Audit: Audit summary view, Model-driven apps activity logging: Microsoft Purview | Custom Azure Monitor alerts |
| 3 | Power BI embedded dashboards | Power BI embedded dashboards | Microsoft managed | Microsoft managed | Microsoft managed |
| 4 | Dataverse | Dataverse analytics, Telemetry events for Dataverse | Request: Incoming API calls Dependency: Outgoing calls |
Dataverse auditing | Custom Azure Monitor alerts, System administrator alerts, Microsoft 365 Message center notifications |
| 5 | Plugins | Dataverse Analytics | Plugin Tracelog, dependency, and exceptions table in Application Insights | Dataverse auditing | Custom Azure Monitor alerts |
| 6 | System Jobs (workflows) | System jobs | System Job Table (AsyncOperation) | Dataverse auditing | A custom Power Automate to monitor system jobs failed records |
| 7 | Power Automate | Power Platform Admin Center or the Analytics page of each individual Power Automate flow | Runs, triggers, and action logs are stored in Power Automate execution log and can be exported to Application Insights (preview) to centralize | Microsoft Purview | Add more steps in power automate to notify users based on specific steps failure or custom Azure Monitor alerts from the Application Insights logs |
| 8 | Teams Collaboration | Microsoft managed | Microsoft managed | Microsoft Purview | Microsoft 365 Message center notifications |
| 9 | Azure Synapse Link | Azure Synapse Link | Microsoft managed | Microsoft managed | Microsoft managed |
| 10 | On-premises data gateway | Gateway service health: On-premises data gateway management Gateway node monitoring: Azure Monitor and Log Analytics Gateway node performance: Windows Performance Monitor or Gateway performance PBI template |
Collect VM logs Slow-performing queries |
Log Analytics agent | Custom Azure Monitor alerts |
| 11 | Azure connectivity and data estate resources | Azure Monitor | Log Analytics workspace | Azure resource diagnostics log | Custom Azure Monitor alerts |
| 12 | Customer Insights | Customer Insights System Status page or Azure Monitor to monitor exported diagnostic logs | Log Analytics workspace, storage account, or event hub | Customer insights diagnostic log | Custom Azure Monitor alerts from the Application Insights log |
| 13 | AI Builder | Monitor AI Builder Activity (preview) page in the Power Automate portal to monitor activities and Consumption Report to monitor licensing | Logged in Monitor AI Builder Activity (preview) and if the AI model used in Power Automate, logs can be exported to Application Insights (preview) | N/A | Add more steps in power automate to notify users based on specific steps failure or custom Azure Monitor alerts from the Application Insights logs |
