チュートリアル:Bing 地図から Web アプリを移行する
Bing 地図が使用される Web アプリでは、多くの場合、Bing 地図 V8 JavaScript SDK が使用されます。 Azure Maps Web SDK は、移行に適した Azure ベースの SDK です。 Azure Maps Web SDK を使用すると、インタラクティブ マップをカスタマイズして、Web アプリケーションまたはモバイル アプリケーションに独自のコンテンツや映像を表示することができます。 このコントロールには、WebGL が利用されているため、大きなデータ セットを高いパフォーマンスでレンダリングすることができます。 JavaScript または TypeScript を使用して、この SDK での開発を行います。 このチュートリアルでは、次の方法について説明します。
- マップを読み込む
- マップをローカライズする
- 画鋲、ポリライン、およびポリゴンを追加する。
- ポップアップまたは情報ボックスに情報を表示する
- KML と GeoJSON のデータを読み込んで表示する
- 画鋲をクラスタリングする
- タイル レイヤーをオーバーレイする
- トラフィック データを表示する
- グラウンド オーバーレイを追加する
JavaScript フレームワークを開発に使用している場合は、次のいずれかのオープンソース プロジェクトが役に立つかもしれません。
- ng-azure-maps - Azure Maps の Angular 10 ラッパー。
- AzureMapsControl.Components - Azure Maps Blazor コンポーネント。
- Azure Maps React Component - Azure Maps コントロール用の React ラッパー。
- Vue Azure Maps - Vue アプリケーション用の Azure Maps コンポーネント。
前提条件
Azure サブスクリプションをお持ちでない場合は、開始する前に 無料アカウント を作成してください。
主なフィーチャーのサポート
次の表には、Bing 地図 V8 JavaScript SDK の主な API 機能と、Azure Maps Web SDK での同様の API のサポートが示されています。
| Bing 地図の機能 | Azure Maps Web SDK のサポート |
|---|---|
| 画鋲 | ✓ |
| 画鋲クラスタリング | ✓ |
| ポリラインと多角形 | ✓ |
| グラウンド オーバーレイ | ✓ |
| ヒート マップ | ✓ |
| タイル レイヤー | ✓ |
| KML レイヤー | ✓ |
| 等高線レイヤー | 等高線レイヤーのコード サンプル |
| データのビン分割レイヤー | 該当なし |
| アニメーション タイル レイヤー | オープンソースの Azure Maps アニメーション モジュールに含まれています。 |
| 描画ツール | ✓ |
| ジオコーダー サービス | ✓ |
| 方向サービス | ✓ |
| 距離マトリックス サービス | ✓ |
| 空間データ サービス | 該当なし |
| 衛星または航空映像 | ✓ |
| 鳥瞰図 | N/A |
| Streetside 映像 | N/A |
| GeoJSON サポート | ✓ |
| GeoXML サポート | ✓ 空間 IO モジュール |
| Well-Known Text サポート | ✓ |
| カスタム マップ スタイル | Partial |
Azure Maps には、その機能を拡張する Web SDK 用のオープンソース モジュールが他にもあります。
Web SDK の注目すべき相違点
Bing 地図と Azure Maps の Web SDK の注意すべき主な相違点をいくつか以下に示します。
- Azure Maps Web SDK にアクセスするためのホステッド エンドポイントの提供に加えて、必要に応じて、Web SDK をアプリに埋め込むための npm パッケージが使用できます。 詳細については、「Azure Maps マップ コントロールを使用する」を参照してください。 このパッケージには TypeScript 定義も含まれています。
- Bing 地図には、SDK のホスト ブランチとして、リリース用と実験用の 2 つがあります。 実験ブランチでは、新規の開発が進行していると、1 日に複数回、更新が行われる場合があります。 Azure Maps でホストされるのはリリース ブランチのみですが、オープンソースの Azure Maps コード サンプル プロジェクトに試験的な機能がカスタム モジュールとして作成されます。 Bing 地図にはかつて、更新頻度を低くすることによってリリースによる破壊的変更のリスクを軽減する凍結ブランチもありました。 Azure Maps では、npm モジュールを使用して、過去にリリースされた任意のマイナー バージョンを参照できます。
ヒント
Azure Maps では、縮小されたバージョンと縮小されていないバージョン両方の SDK が公開されています。 ファイル名から .min を削除するだけです。 縮小されていないバージョンは問題をデバッグする際に役立ちますが、運用環境では必ず、縮小されたバージョンを使用してください。その方がファイル サイズが小さくて済みます。
Azure Maps で Map クラスのインスタンスが作成されたら、マップを操作する前にマップの
readyまたはloadイベントが発生するのをコードで待機する必要があります。 これらのイベントにより、マップ リソースがすべて読み込まれ、アクセスできる状態であることが保証されます。両方のプラットフォームで基本マップに同様のタイリング システムを使用しますが、Bing 地図のタイルは 256 ピクセルであり、Azure Maps では 512 ピクセルです。 Azure Maps で Bing 地図と同じマップ ビューを表示するには、Azure Maps においてズーム レベルを 1 つ減らす必要があります。
Bing 地図では座標は
latitude, longitudeと呼ばれますが、Azure Maps ではlongitude, latitudeが使用されます。 この形式は、ほとんどの GIS プラットフォームが準拠する標準の[x, y]と合致します。Azure Maps Web SDK の図形は、GeoJSON スキーマに基づいています。 ヘルパー クラスは、"atlas.data" 名前空間を通じて公開されます。 また、atlas.Shape というクラスがあります。これを使用すると、GeoJSON オブジェクトをラップし、データ バインド可能な方法で簡単に更新および保守できます。
Azure Maps の座標は、
[longitude, latitude]またはnew atlas.data.Position(longitude, latitude)形式のシンプルな数値配列として指定できる位置オブジェクトとして定義されます。
ヒント
Position クラスには、latitude, longitude 形式の座標をインポートするための静的ヘルパー関数があります。 atlas.data.Position.fromLatLng 関数は、多くの場合、Bing 地図コードの new Microsoft.Maps.Location 関数と置き換えることができます。
- マップに追加される各図形にスタイル設定情報を指定するのではなく、Azure Maps によってデータからスタイルが分離されます。 データはデータ ソースに格納され、Azure Maps コードでデータをレンダリングするために使用される、レンダリング レイヤーに接続されます。 この手法では、パフォーマンスが向上します。 多くのレイヤーではデータ ドリブン スタイル設定がサポートされています。これは、レイヤー スタイル オプションにビジネス ロジックを追加することで行われ、これにより、レイヤー内での個々の図形のレンダリング方法がそのプロパティに応じて変更されます。
- Azure Maps では
atlas.math名前空間に空間演算関数が用意されていますが、これらは Bing 地図の空間演算関数と異なります。 主な違いは、Azure Maps にはunionやintersectionなどのバイナリ操作用の組み込み関数が用意されていない点です。 ただし、Azure Maps はオープンな GeoJSON 標準に基づいており、使用可能なオープンソース ライブラリがあります。 Azure Maps との相性がよく、空間演算機能を備えている一般的なオプションの 1 つは、turf js です。
Azure Maps に関連する用語の詳細については、「Azure Maps の用語集」を参照してください。
Web SDK のサイドバイサイドの例
次の一覧は、各プラットフォームのコード サンプルのコレクションです。これらは、Web アプリケーションを Bing 地図 V8 JavaScript SDK から Azure Maps Web SDK に移行する際に役立つ一般的なユース ケースについて説明しています。 Web アプリケーションに関連するコード サンプルは JavaScript で提供されていますが、Azure Maps では、npm モジュール内に TypeScript 定義も用意されています。 TypeScript 定義の詳細については、「Azure Maps のマップ コントロールを使用する」を参照してください。
トピック
- マップを読み込む
- マップのローカライズ
- マップ ビューの設定
- 画鋲の追加
- カスタム画鋲の追加
- ポリラインの追加
- 多角形の追加
- 情報ボックスの表示
- 画鋲クラスタリング
- ヒート マップを追加する
- タイル レイヤーをオーバーレイする
- トラフィック データを表示する
- グラウンド オーバーレイを追加する
- マップへの KML データの追加
- 描画ツールの追加
マップを読み込む
どちらの SDK も、マップの読み込みは、同じ一連の手順に従って行います。
- Map SDK への参照を追加します。
- マップのプレースホルダーとして機能する
divタグをページの本文に追加します。 - ページが読み込まれたときに呼び出される JavaScript 関数を作成します。
- それぞれのマップ クラスのインスタンスを作成します。
主な相違点
- Bing 地図では、API のスクリプト参照で、またはマップ オプションとして、アカウント キーを指定する必要があります。 Azure Maps の認証資格情報は、マップ クラスのオプションとして、共有キー認証または Microsoft Entra ID として指定されます。
- Bing 地図では、API のスクリプト参照でコールバック関数を受け取ります。これは、マップを読み込むために初期化関数を呼び出す際に使用されます。 Azure Maps では、ページの onload イベントを使用する必要があります。
- マップがレンダリングされる
div要素を参照するために ID を使用する場合、Bing 地図では HTML セレクター (#myMap) が使用されるのに対し、Azure Maps では ID 値 (myMap) のみが使用されます。 - Azure Maps の座標は、
[longitude, latitude]形式のシンプルな数値配列として指定できる位置オブジェクトとして定義されます。 - Azure Maps のズーム レベルは、Bing 地図の例よりも 1 つ下のレベルとなります。これは、プラットフォーム間のタイリング システム サイズが異なるためです。
- 既定では、Azure Maps で、ズーム ボタンやマップ スタイル ボタンなどのナビゲーション コントロールはマップ キャンバスに追加されません。 しかし、マップ スタイル ピッカー、ズーム ボタン、コンパスまたは回転コントロール、およびピッチ コントロールを追加するためのコントロールがあります。
- イベント ハンドラーは、マップ インスタンスの
readyイベントを監視するために Azure Maps に追加されます。 これは、マップが WebGL コンテキストと必要なリソースすべての読み込みを完了したときに発生します。 このイベント ハンドラーでは、任意のポスト ロード コードを追加できます。
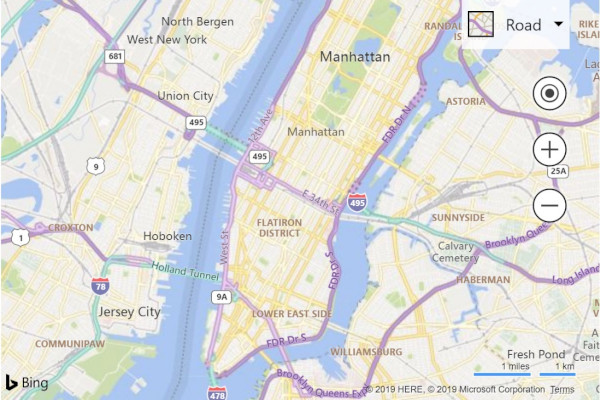
次の例では、ニューヨークが中心の基本マップの読み込みを示します。これは、座標の経度が -73.985、緯度が 40.747 で、ズーム レベルが 12 の Bing 地図です。
前: Bing 地図
次のコードは、ある場所を中心にズームされた Bing 地図を表示する方法の例です。
<!DOCTYPE html>
<html>
<head>
    <title></title>
    <meta charset="utf-8" />
    <meta http-equiv="x-ua-compatible" content="IE=Edge" />
    <meta name="viewport" content="width=device-width, initial-scale=1, shrink-to-fit=no" />

    <script type='text/javascript'>
        var map;

        function initMap() {
            map = new Microsoft.Maps.Map('#myMap', {
                credentials: '<Your Bing Maps Key>',
                center: new Microsoft.Maps.Location(40.747, -73.985),
                zoom: 12
            });
        }
    </script>

    <!-- Bing Maps Script Reference -->
    <script src="https://www.bing.com/api/maps/mapcontrol?callback=initMap" async defer></script>
</head>
<body>
    <div id='myMap' style='position:relative;width:600px;height:400px;'></div>
</body>
</html>
ブラウザーでこのコードを実行すると、次の画像のようなマップが表示されます。
後: Azure Maps
次のコードは、Azure Maps で同じビューのマップを、マップ スタイル コントロールおよびズーム ボタンと共に読み込む方法を示しています。
<!DOCTYPE html>
<html>
<head>
    <title></title>
    <meta charset="utf-8" />
    <meta http-equiv="x-ua-compatible" content="IE=Edge" />
    <meta name="viewport" content="width=device-width, initial-scale=1, shrink-to-fit=no" />

    <!-- Add references to the Azure Maps Map control JavaScript and CSS files. -->
    <link rel="stylesheet" href="https://atlas.microsoft.com/sdk/javascript/mapcontrol/3/atlas.min.css" type="text/css" />
    <script src="https://atlas.microsoft.com/sdk/javascript/mapcontrol/3/atlas.min.js"></script>

    <script type='text/javascript'>
        var map;

        function initMap() {
            map = new atlas.Map('myMap', {
                center: [-73.985, 40.747],  //Format coordinates as longitude, latitude.
                zoom: 11,   //Subtract the zoom level by one.

                //Add your Azure Maps key to the map SDK. Get an Azure Maps key at https://azure.com/maps. NOTE: The primary key should be used as the key.
                authOptions: {
                    authType: 'subscriptionKey',
                    subscriptionKey: '<Your Azure Maps Key>'
                }
            });

            //Wait until the map resources are ready.
            map.events.add('ready', function () {
                //Add zoom and map style controls to top right of map.
                map.controls.add([
                        new atlas.control.StyleControl(),
                        new atlas.control.ZoomControl()
                    ], {
                        position: 'top-right'
                });
            });
        }
    </script>
</head>
<body onload="initMap()">
    <div id='myMap' style='position:relative;width:600px;height:400px;'></div>
</body>
</html>
ブラウザーでこのコードを実行すると、次の画像のようなマップが表示されます。

Web アプリで Azure Maps マップ コントロールを設定して使用する方法について、詳しくは「Azure Maps のマップ コントロールを使用する」をご覧ください。
ヒント
Azure Maps では、縮小されたバージョンと縮小されていないバージョン両方の SDK が公開されています。 ファイル名から .min を削除してください。 縮小されていないバージョンは問題をデバッグする際に役立ちますが、運用環境では必ず、縮小されたバージョンを使用してください。その方がファイル サイズが小さくて済みます。
その他のリソース
- マップの回転およびピッチ調整のための Azure Maps ナビゲーション コントロールの詳細については、「マップにコントロールを追加する」を参照してください。
マップのローカライズ
対象ユーザーが複数の国または地域に分散している場合や、使用されている言語が異なる場合は、ローカライズが重要になります。
前: Bing 地図
Bing 地図をローカライズするために、API の <script> タグ参照には UR パラメーターが追加され、setLang を使用して言語と地域が指定されています。 Bing 地図の一部の機能は、特定の市場でのみ利用できす。たとえば、ユーザーの市場は、setMkt パラメーターを使用して指定します。
<script type="text/javascript" src="https://www.bing.com/api/maps/mapcontrol?callback=initMap&setLang={language-code}&setMkt={market}&UR={region-code}" async defer></script>
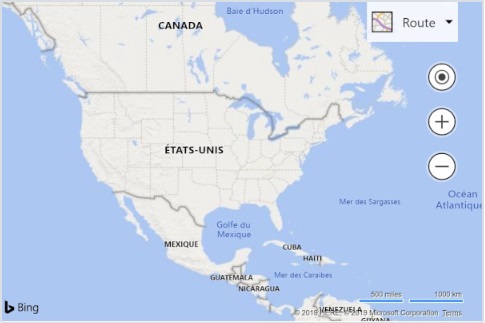
以下に、言語が fr-FR に設定されている Bing Maps の例を示します。
後: Azure Maps
Azure Maps には、マップの言語と地域ビューを設定するためのオプションのみが用意されています。 市場パラメーターは、地物を制限するためには使用されません。 マップの言語と地域ビューを設定するための 2 つの異なる方法が用意されています。 最初のオプションでは、この情報をグローバルな atlas 名前空間に追加します。これにより、アプリ内のすべてのマップ コントロール インスタンスにこれらの設定が既定で使用されます。 以下では、言語をフランス語 (fr-FR) に、地域ビューを "Auto" に設定します。
atlas.setLanguage('fr-FR');
atlas.setView('auto');
2 つ目のオプションでは、次のようにマップを読み込むときに、この情報をマップ オプションに渡します。
map = new atlas.Map('myMap', {
    language: 'fr-FR',
    view: 'auto',

    authOptions: {
        authType: 'subscriptionKey',
        subscriptionKey: '<Your Azure Maps Key>'
    }
});
Note
Azure Maps では、言語と地域の設定が異なる複数のマップ インスタンスを同じページに読み込むことができます。 また、マップでは読み込み後に、これらの設定を更新することもできます。 Azure Maps でサポートされている言語の一覧については、「Azure Maps でのローカライズのサポート」を参照してください。
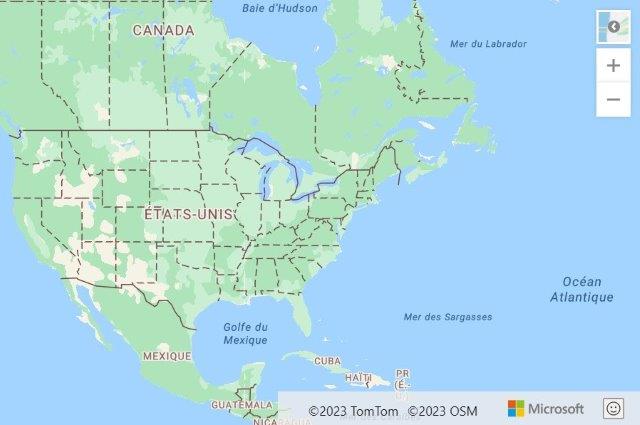
言語が "fr" に設定され、ユーザーの地域が fr-FR に設定されている Azure Maps の例を以下に示します。
マップ ビューの設定
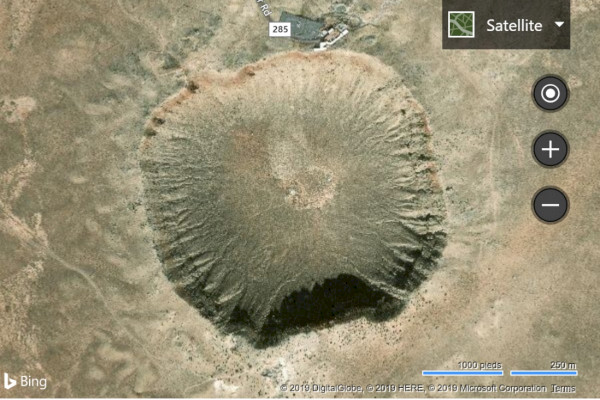
Bing 地図と Azure Maps の動的マップはどちらも、JavaScript で適切な関数を呼び出すことによって、プログラムで新しい地理的な場所に移動できます。 次の例では、衛星航空映像を表示するマップを示します。これは、座標の経度が -111.0225、緯度が 35.0272 である場所を中心とし、ズーム レベルを 15 に変更した Bing 地図です。
Note
Bing 地図では、ディメンションが 256 ピクセルのタイルが使用されますが、Azure Maps では、より大きな 512 ピクセルのタイルが使用されます。 これにより、Azure Maps で Bing 地図と同じマップ領域を読み込むために必要なネットワーク要求の数が減ります。 しかし、マップ コントロールでのタイル ピラミッドの動作方法により、Azure Maps のより大きなタイルは、Bing 地図のマップと同じ可視領域を得るために、Azure Maps の使用時に Bing 地図で利用されるズーム レベルを 1 ずつ減算する必要があることを意味します。
前: Bing 地図
Bing 地図のマップ コントロールは、マップの中心とズーム レベルを指定できる setView 関数を使用してプログラムで移動できます。
map.setView({
    mapTypeId: Microsoft.Maps.MapTypeId.aerial,
    center: new Microsoft.Maps.Location(35.0272, -111.0225),
    zoom: 15
});
後: Azure Maps
Azure Maps では、マップの setCamera 関数を使用して、マップの位置をプログラムで変更し、setStyle 関数を使用して、マップ スタイルを変更することができます。 Azure Maps 内の座標は "経度, 緯度" の形式であり、ズーム レベルの値は 1 ずつ減算されます。
map.setCamera({
    center: [-111.0225, 35.0272],
    zoom: 14
});

map.setStyle({
    style: 'satellite_road_labels'
});

参考情報
画鋲の追加
Azure Maps には、ポイント データをマップにレンダリングできる方法が複数あります。
- HTML マーカー – 従来の DOM 要素を使用してポイントをレンダリングします。 HTML マーカーではドラッグがサポートされます。
- シンボル レイヤー – WebGL コンテキスト内でアイコンやテキストを使用してポイントをレンダリングします。
- バブル レイヤー - ポイントをマップ上で円としてレンダリングします。 円の半径は、データのプロパティに基づいてスケーリングできます。
シンボルとバブルの両方レイヤーは、WebGL コンテキスト内にレンダリングされ、マップに大規模なポイント セットをレンダリングできます。 これらのレイヤーでは、データをデータ ソースに格納する必要があります。 データ ソースとレンダリング レイヤーは、ready イベントが発生した後にマップに追加する必要があります。 HTML マーカーは、ページ内に DOM 要素としてレンダリングされ、データ ソースは使用されません。 ページに含まれる DOM 要素が多いほど、そのページの速度は遅くなります。 マップ上に数百を超えるポイントをレンダリングする場合は、代わりにレンダリング レイヤーのいずれかの使用を試してください。
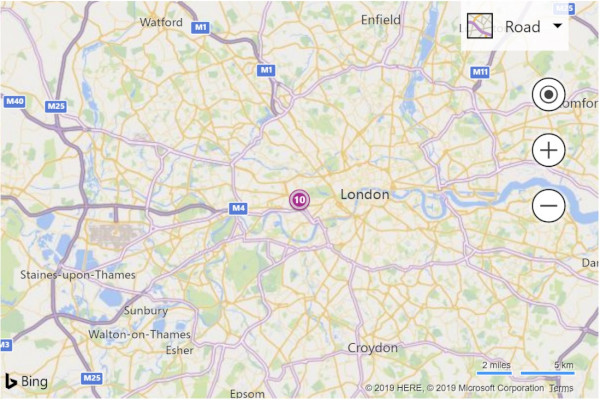
以下の例では、マップの経度 -0.2、緯度 51.5 の地点にマーカーを追加します。ラベルとして数値の 10 がオーバーレイされています。
前: Bing 地図
Bing 地図では、Microsoft.Maps.Pushpin クラス*を使用して、マップにマーカーを追加します。 そのうえで、2 つの関数のどちらかを使用してマップに画鋲を追加します。
1 つ目の関数では、レイヤーを作成し、そこに画鋲を挿入して、マップの layers プロパティにレイヤーを追加します。
var pushpin = new Microsoft.Maps.Pushpin(new Microsoft.Maps.Location(51.5, -0.2), {
    text: '10'
});

var layer = new Microsoft.Maps.Layer();
layer.add(pushpin);
map.layers.insert(layer);
2 つ目は、マップの entities プロパティを使用して追加するものです。 この関数は、Bing Maps V8 のドキュメントでは非推奨とマークされていますが、基本的なシナリオではまだ部分的に機能します。
var pushpin = new Microsoft.Maps.Pushpin(new Microsoft.Maps.Location(51.5, -0.2), {
    text: '10'
});

map.entities.add(pushpin);
後: HTML マーカーを使用した Azure Maps
Azure Maps では、HTML マーカーは、マップにポイントを簡単に表示するために使用でき、マップに少数のポイントだけ表示する必要がある単純なアプリにお勧めです。 HTML マーカーを使用するには、atlas.HtmlMarker クラスのインスタンスを作成して、テキストおよび位置のオプションを設定し、map.markers.add 関数を使用してマップにマーカーを追加します。
//Create a HTML marker and add it to the map.
map.markers.add(new atlas.HtmlMarker({
    text: '10',
    position: [-0.2, 51.5]
}));

後: シンボル レイヤーを使用した Azure Maps
シンボル レイヤーを使用する場合は、データをデータ ソースに追加し、データ ソースをレイヤーにアタッチする必要があります。 また、データ ソースとレイヤーは、ready イベントが発生した後にマップに追加する必要があります。 一意のテキスト値をシンボルの上にレンダリングするには、テキスト情報をデータ ポイントのプロパティとして格納し、そのプロパティをレイヤーの textField オプションで参照する必要があります。 これは HTML マーカーを使用するよりも少し手間がかかりますが、パフォーマンスの利点が得られます。
<!DOCTYPE html>
<html>
<head>
    <title></title>
    <meta charset="utf-8" />
    <meta http-equiv="x-ua-compatible" content="IE=Edge" />
    <meta name="viewport" content="width=device-width, initial-scale=1, shrink-to-fit=no" />

    <!-- Add references to the Azure Maps Map control JavaScript and CSS files. -->
    <link rel="stylesheet" href="https://atlas.microsoft.com/sdk/javascript/mapcontrol/3/atlas.min.css" type="text/css" />
    <script src="https://atlas.microsoft.com/sdk/javascript/mapcontrol/3/atlas.min.js"></script>

    <script type='text/javascript'>
        var map, datasource;

        function initMap() {
            map = new atlas.Map('myMap', {
                center: [-0.2, 51.5],
                zoom: 9,

                authOptions: {
                    authType: 'subscriptionKey',
                    subscriptionKey: '<Your Azure Maps Key>'
                }
            });

            //Wait until the map resources are ready.
            map.events.add('ready', function () {

                //Create a data source and add it to the map.
                datasource = new atlas.source.DataSource();
                map.sources.add(datasource);

                //Create a point feature, add a property to store a label for it, and add it to the data source.
                datasource.add(new atlas.data.Feature(new atlas.data.Point([-0.2, 51.5]), {
                    label: '10'
                }));

                //Add a layer for rendering point data as symbols.
                map.layers.add(new atlas.layer.SymbolLayer(datasource, null, {
                    textOptions: {
                        //Use the label property to populate the text for the symbols.
                        textField: ['get', 'label'],
                        color: 'white',
                        offset: [0, -1]
                    }
                }));
            });
        }
    </script>
</head>
<body onload="initMap()">
    <div id='myMap' style='position:relative;width:600px;height:400px;'></div>
</body>
</html>
参考情報
- データ ソースを作成する
- シンボル レイヤーを追加する
- バブル レイヤーを追加する
- ポイント データをクラスタリングする
- HTML マーカーを追加する
- データドリブンのスタイルの式を使用する
- シンボル レイヤーのアイコン オプション
- シンボル レイヤーのテキスト オプション
- HTML マーカーのクラス
- HTML マーカーのオプション
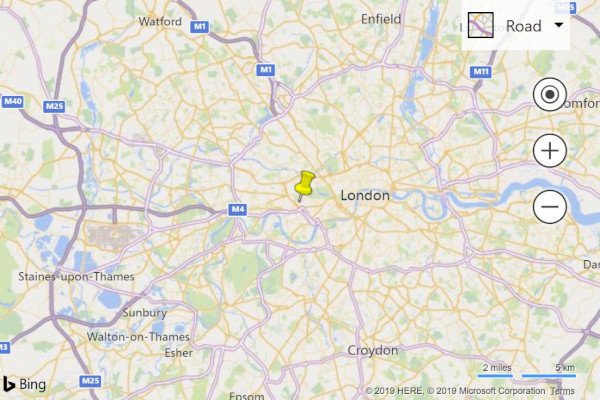
カスタム画鋲の追加
カスタム イメージを使用すると、マップ上のポイントを表すことができます。 以下のイメージ例では、カスタム イメージを使用してマップ上のポイントを表示します。ここでは、緯度が 51.5、経度が -0.2 で、マーカーの位置をオフセットして、画鋲アイコンのポイントがマップ上の正しい位置に揃うようにします。
 |
|---|
| yellow-pushpin.png |
前: Bing 地図
Bing 地図では、画鋲の icon オプションに画像の URL を渡すことでカスタム マーカーを作成します。 画鋲の画像のポイントは、anchor オプションを使用して、マップ上の座標に合わせます。 Bing 地図のアンカー値は、画像の左上隅を基準とします。
var pushpin = new Microsoft.Maps.Pushpin(new Microsoft.Maps.Location(51.5, -0.2), {
    icon: 'ylw-pushpin.png',
    anchor: new Microsoft.Maps.Point(5, 30)
});

var layer = new Microsoft.Maps.Layer();
layer.add(pushpin);
map.layers.insert(layer);
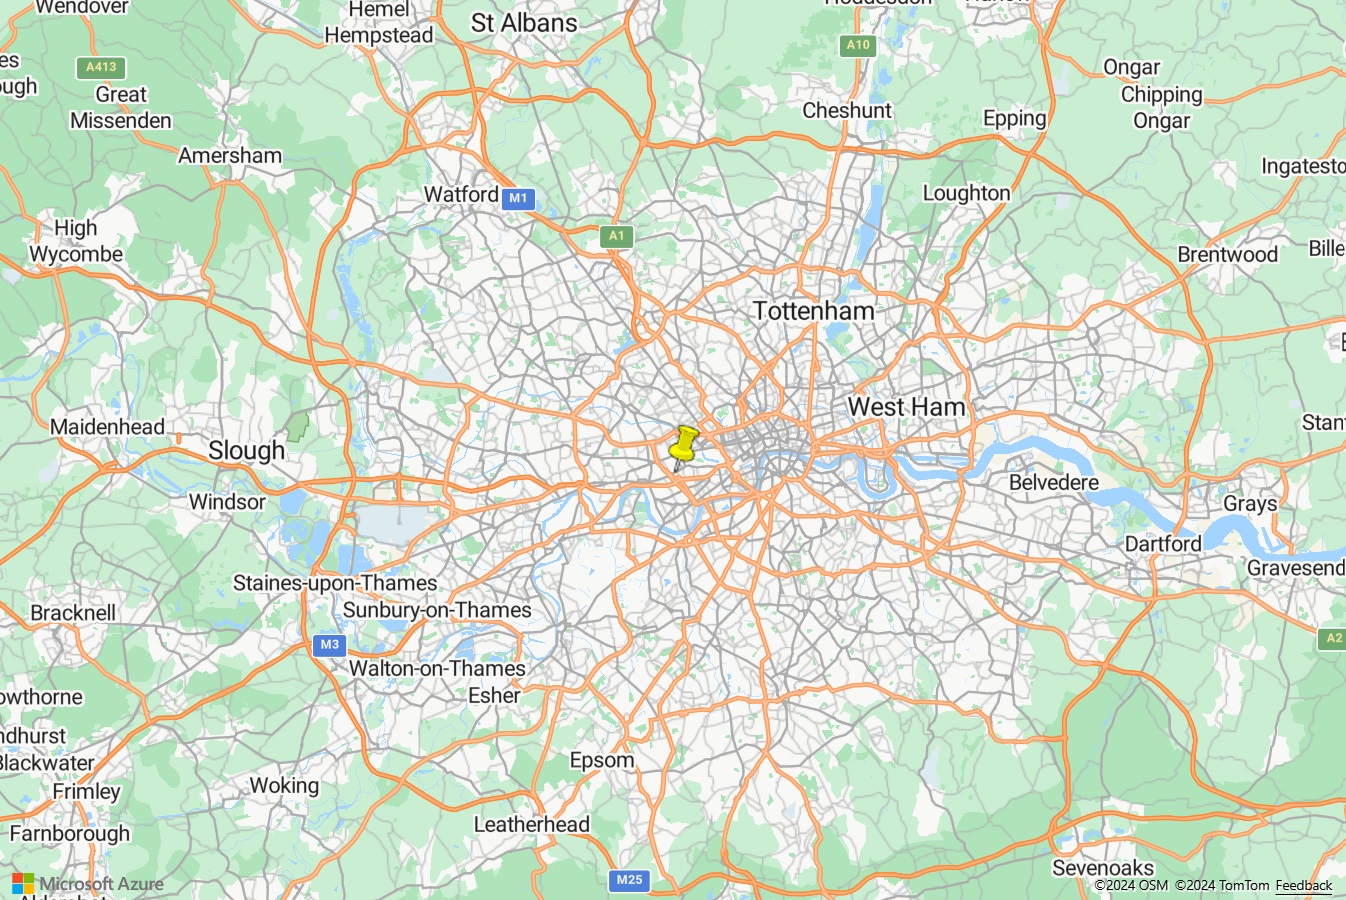
後: HTML マーカーを使用した Azure Maps
Azure Maps で HTML マーカーをカスタマイズする場合は、HTML string または HTMLElement をマーカーの htmlContent オプションに渡すことができます。 Azure Maps では、anchor オプションを使用して、9 つの定義済みの参照ポイントである "center"、"top"、"bottom"、"left"、"right"、"top-left"、"top-right"、"bottom-left"、"bottom-right" のいずれかを使用して、位置座標を基準とするマーカーの相対位置を指定します。 コンテンツは固定され、既定では "下部" の中央に配置されます。 Bing 地図からコードをより簡単に移行できるようにするには、アンカーを "top-left" に設定してから、Bing 地図で使用したものと同じオフセットで offset オプションを使用します。 Azure Maps のオフセットは、Bing 地図の反対方向に移動するため、-1 を乗算します。
ヒント
HTML コンテンツにスタイルとして pointer-events:none を追加して、不要なアイコンを表示する、MS Edge での既定のドラッグ動作を無効にします。
map.markers.add(new atlas.HtmlMarker({
    htmlContent: '<img src="ylw-pushpin.png" style="pointer-events: none;" />',
    anchor: 'top-left',
    pixelOffset: [-5, -30],
    position: [-0.2, 51.5]
}));

後: シンボル レイヤーを使用した Azure Maps
Azure Maps のシンボル レイヤーでもカスタム イメージがサポートされますが、最初にイメージをマップ リソースに読み込んで、一意の ID を割り当てる必要があります。 その後、シンボル レイヤーでこの ID を参照できます。 アイコンの offset オプションを使用して、イメージ上の正しいポイントに合わせるために、シンボルをオフセットできます。 Azure Maps では、anchor オプションを使用して、9 つの定義済みの参照ポイントである "center"、"top"、"bottom"、"left"、"right"、"top-left"、"top-right"、"bottom-left"、"bottom-right" のいずれかを使用して、位置座標を基準とするシンボルの相対位置を指定します。 コンテンツは固定され、既定では "bottom" (HTML コンテンツの下中央) に設定されます。 Bing 地図からコードをより簡単に移行できるようにするには、アンカーを "top-left" に設定してから、Bing 地図で使用したものと同じオフセットで offset オプションを使用します。 Azure Maps のオフセットは、Bing 地図の反対方向に移動するため、-1 を乗算します。
<!DOCTYPE html>
<html>
<head>
    <title></title>
    <meta charset="utf-8" />
    <meta http-equiv="x-ua-compatible" content="IE=Edge" />
    <meta name="viewport" content="width=device-width, initial-scale=1, shrink-to-fit=no" />

    <!-- Add references to the Azure Maps Map control JavaScript and CSS files. -->
    <link rel="stylesheet" href="https://atlas.microsoft.com/sdk/javascript/mapcontrol/3/atlas.min.css" type="text/css" />
    <script src="https://atlas.microsoft.com/sdk/javascript/mapcontrol/3/atlas.min.js"></script>

    <script type='text/javascript'>
        var map, datasource;

        function initMap() {
            map = new atlas.Map('myMap', {
                center: [-0.2, 51.5],
                zoom: 9,
                authOptions: {
                    authType: 'subscriptionKey',
                    subscriptionKey: '<Your Azure Maps Key>'
                }
            });

            //Wait until the map resources are ready.
            map.events.add('ready', function () {

                //Load the custom image icon into the map resources.
                map.imageSprite.add('my-yellow-pin', 'ylw-pushpin.png').then(function () {

                    //Create a data source and add it to the map.
                    datasource = new atlas.source.DataSource();
                    map.sources.add(datasource);

                    //Create a point and add it to the data source.
                    datasource.add(new atlas.data.Point([-0.2, 51.5]));

                    //Add a layer for rendering point data as symbols.
                    map.layers.add(new atlas.layer.SymbolLayer(datasource, null, {
                        iconOptions: {
                            //Set the image option to the id of the custom icon that was loaded into the map resources.
                            image: 'my-yellow-pin',
                            anchor: 'top-left',
                            offset: [-5, -30]
                        }
                    }));
                });
            });
        }
    </script>
</head>
<body onload="initMap()">
    <div id='myMap' style='position:relative;width:600px;height:400px;'></div>
</body>
</html>
ヒント
ポイントの高度なカスタム レンダリングを作成するには、複数のレンダリング レイヤーを一緒に使用します。 たとえば、異なる色付きの円で同じアイコンの画鋲を複数使用する場合は、色ごとに多くのイメージを作成するのではなく、バブル レイヤーの上にシンボル レイヤーをオーバーレイし、同じデータ ソースを参照するようにします。 これは作成するよりもはるかに効率的であり、マップに多くのさまざまなイメージが保持されます。
その他のリソース
- データ ソースを作成する
- シンボル レイヤーを追加する
- HTML マーカーを追加する
- データドリブンのスタイルの式を使用する
- シンボル レイヤーのアイコン オプション
- シンボル レイヤーのテキスト オプション
- HTML マーカーのクラス
- HTML マーカーのオプション
ポリラインの追加
ポリラインは、マップ上の線またはパスを表すために使用されます。 次の例では、マップに破線ポリラインを作成する方法を示します。
前: Bing 地図
Bing 地図では、Polyline クラスに場所の配列と一連のオプションを渡します。
//Get the center of the map.
var center = map.getCenter();

//Create the polyline.
var polyline = new Microsoft.Maps.Polyline([
        center,
        new Microsoft.Maps.Location(center.latitude - 0.5, center.longitude - 1),
        new Microsoft.Maps.Location(center.latitude - 0.5, center.longitude + 1)
    ], {
        strokeColor: 'red',
        strokeThickness: 4,
        strokeDashArray: [3, 3]
    });

//Add the polyline to the map using a layer.
var layer = new Microsoft.Maps.Layer();
layer.add(polyline);
map.layers.insert(layer);
後: Azure Maps
Azure Maps におけるポリラインは、LineString オブジェクトまたは MultiLineString オブジェクトという、地理空間に関するより一般的な用語で呼ばれています。 これらのオブジェクトは、データ ソースに追加し、線レイヤーを使用してレンダリングできます。 ストロークの色、幅、破線間隔のオプションは、どのプラットフォームでもほとんど同じです。
//Get the center of the map.
var center = map.getCamera().center;

//Create a data source and add it to the map.
var datasource = new atlas.source.DataSource();
map.sources.add(datasource);

//Create a line and add it to the data source.
datasource.add(new atlas.data.LineString([
    center,
    [center[0] - 1, center[1] - 0.5],
    [center[0] + 1, center[1] - 0.5]
]));

//Add a layer for rendering line data.
map.layers.add(new atlas.layer.LineLayer(datasource, null, {
    strokeColor: 'red',
    strokeWidth: 4,
    strokeDashArray: [3, 3]
}));

参考情報
多角形の追加
多角形は、マップ上の領域を表すために使用されます。 Azure Maps と Bing 地図では、多角形について、ほぼ同等のサポートが提供されます。 次の例では、マップの中心座標に基づいて三角形を形成する多角形を作成する方法を示します。
前: Bing 地図
Bing 地図では、Polygon クラスに、座標の配列 (座標環) と一連のオプションを渡します。
//Get the center of the map.
var center = map.getCenter();

//Create the polygon.
var polygon = new Microsoft.Maps.Polygon([
        center,
        new Microsoft.Maps.Location(center.latitude - 0.5, center.longitude - 1),
        new Microsoft.Maps.Location(center.latitude - 0.5, center.longitude + 1),
        center
    ], {
        fillColor: 'rgba(0, 255, 0, 0.5)',
        strokeColor: 'red',
        strokeThickness: 2
    });

//Add the polygon to the map using a layer.
var layer = new Microsoft.Maps.Layer();
layer.add(polygon);
map.layers.insert(layer);
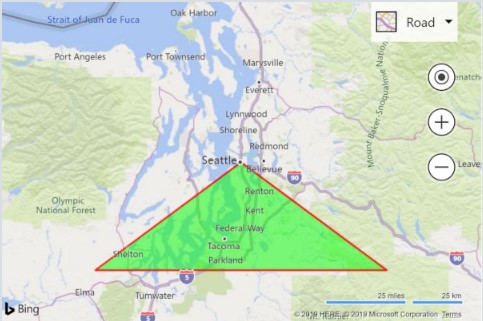
後: Azure Maps
Azure Maps では、Polygon および MultiPolygon オブジェクトをデータ ソースに追加し、レイヤーを使用してマップ上にレンダリングすることができます。 多角形の領域は、多角形レイヤーでレンダリングできます。 多角形の枠線は、線レイヤーを使用してレンダリングできます。
//Get the center of the map.
var center = map.getCamera().center;

//Create a data source and add it to the map.
datasource = new atlas.source.DataSource();
map.sources.add(datasource);

//Create a polygon and add it to the data source.
datasource.add(new atlas.data.Polygon([
    center,
    [center[0] - 1, center[1] - 0.5],
    [center[0] + 1, center[1] - 0.5],
    center
]));

//Add a polygon layer for rendering the polygon area.
map.layers.add(new atlas.layer.PolygonLayer(datasource, null, {
    fillColor: 'rgba(0, 255, 0, 0.5)'
}));

//Add a line layer for rendering the polygon outline.
map.layers.add(new atlas.layer.LineLayer(datasource, null, {
    strokeColor: 'red',
    strokeWidth: 2
}));

参考情報
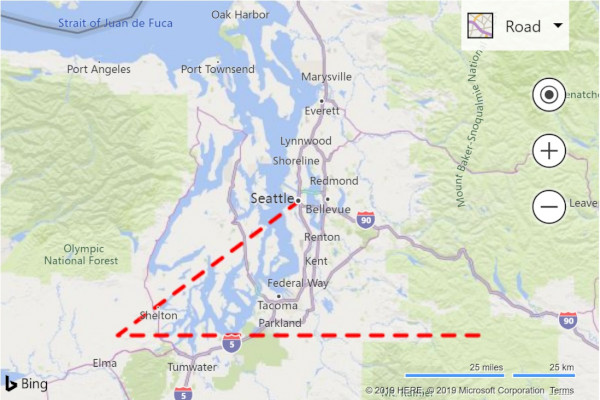
情報ボックスの表示
エンティティのその他の情報は、Bing 地図では Microsoft.Maps.Infobox クラスとしてマップに表示できます。Azure Maps では、atlas.Popup クラスを使用してこれを実現します。 次の例では、マップにプッシュピンまたはマーカーを追加します。これを選択すると、情報ボックスまたはポップアップが表示されます。
前: Bing 地図
Bing 地図では、Microsoft.Maps.Infobox コンストラクターを使用して、情報ボックスが作成されます。
//Add a pushpin where we want to display an infobox.
var pushpin = new Microsoft.Maps.Pushpin(new Microsoft.Maps.Location(47.6, -122.33));

//Add the pushpin to the map using a layer.
var layer = new Microsoft.Maps.Layer();
layer.add(pushpin);
map.layers.insert(layer);

//Create an infobox and bind it to the map.
var infobox = new Microsoft.Maps.Infobox(new Microsoft.Maps.Location(47.6, -122.33), {
    description: '<div style="padding:5px"><b>Hello World!</b></div>',
    visible: false
});
infobox.setMap(map);

//Add a click event to the pushpin to open the infobox.
Microsoft.Maps.Events.addHandler(pushpin, 'click', function () {
    infobox.setOptions({ visible: true });
});
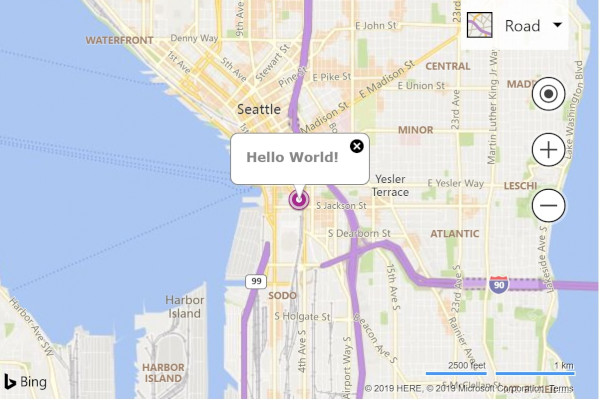
後: Azure Maps
Azure Maps では、ポップアップを使用して、場所に関するその他の情報を表示できます。 HTML の string または HTMLElement オブジェクトを、ポップアップの content オプションに渡すことができます。 ポップアップは、必要に応じて、図形とは別に表示できるため、position 値を指定する必要があります。 ポップアップを表示するには、open 関数を呼び出し、ポップアップの表示先となるマップを渡します。
//Add a marker to the map that to display a popup for.
var marker = new atlas.HtmlMarker({
    position: [-122.33, 47.6]
});

//Add the marker to the map.
map.markers.add(marker);

//Create a popup.
var popup = new atlas.Popup({
    content: '<div style="padding:10px"><b>Hello World!</b></div>',
    position: [-122.33, 47.6],
    pixelOffset: [0, -35]
});

//Add a click event to the marker to open the popup.
map.events.add('click', marker, function () {
    //Open the popup
    popup.open(map);
});

Note
シンボル、バブル、線または多角形のレイヤーで同じことを行うには、マーカーではなく、マップのイベント コードにレイヤーを渡します。
その他のリソース
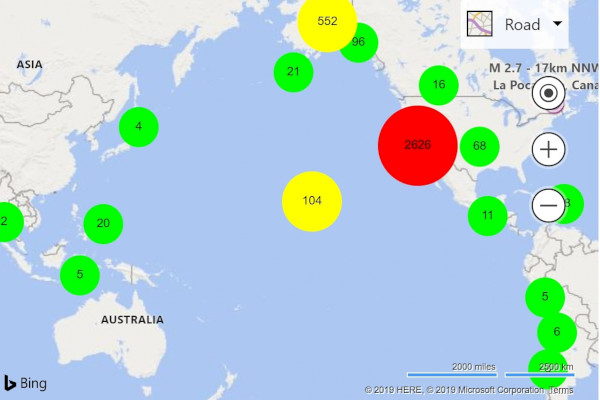
画鋲クラスタリング
多数のデータ ポイントをマップ上に視覚化すると、ポイントが互いに重なり合い、マップの見た目がごちゃごちゃして、見づらく使いづらいものになります。 ポイント データのクラスタリングは、このユーザー エクスペリエンスを向上させ、パフォーマンスを向上させるためにも使用できます。 ポイント データのクラスタリングは、互いに近いポイント データを結合し、単一のクラスター化されたデータ ポイントとしてマップ上に表現するプロセスです。 ユーザーがマップにズーム インすると、クラスターは個々のデータ ポイントに分解します。
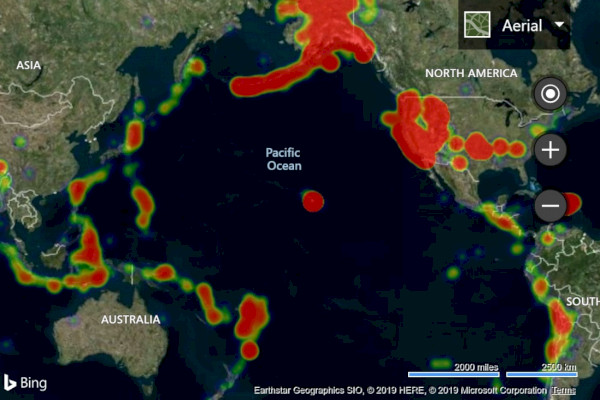
次の例では、過去 1 週間の地震データの GeoJSON フィードを読み込み、それをマップに追加します。 クラスターは、含まれているポイントの数に応じて、スケーリングされた色付きの円としてレンダリングされます。
Note
画鋲クラスタリングには、いくつかの異なるアルゴリズムが使用されています。 Bing 地図では単純なグリッド ベースの関数が使用されるのに対し、Azure Maps では、より高度で見栄えの良いポイント ベースのクラスタリング メソッドが使用されます。
前: Bing 地図
Bing 地図では、GeoJSON モジュールを使用して GeoJSON データを読み込むことができます。 画鋲をクラスタリングするには、クラスタリング モジュールを読み込み、そこに含まれるクラスタリング レイヤーを使用します。
<!DOCTYPE html>
<html>
<head>
    <title></title>
    <meta charset="utf-8" />
    <meta http-equiv="x-ua-compatible" content="IE=Edge" />
    <meta name="viewport" content="width=device-width, initial-scale=1, shrink-to-fit=no" />

    <script type='text/javascript'>
        var map;
        var earthquakeFeed = 'https://earthquake.usgs.gov/earthquakes/feed/v1.0/summary/all_week.geojson';

        function initMap() {
            map = new Microsoft.Maps.Map(document.getElementById('myMap'), {
                credentials: '<Your Bing Maps Key>',
                center: new Microsoft.Maps.Location(20, -160),
                zoom: 2
            });

            //Load the GeoJSON and Clustering modules.
            Microsoft.Maps.loadModule(['Microsoft.Maps.GeoJson', 'Microsoft.Maps.Clustering'], function () {

                //Load the GeoJSON data from a URL.
                Microsoft.Maps.GeoJson.readFromUrl(earthquakeFeed, function (pins) {

                    //Create a ClusterLayer with options and add it to the map.
                    clusterLayer = new Microsoft.Maps.ClusterLayer(pins, {
                        clusteredPinCallback: createCustomClusteredPin,
                        gridSize: 100
                    });

                    map.layers.insert(clusterLayer);
                });
            });
        }

        //A function that defines how clustered pins are rendered.
        function createCustomClusteredPin(cluster) {
            //Get the number of pushpins in the cluster
            var clusterSize = cluster.containedPushpins.length;

            var radius = 20;    //Default radius to 20 pixels.
            var fillColor = 'lime'; 	//Default to lime green.

            if (clusterSize >= 750) {
                radius = 40;   //If point_count >= 750, radius is 40 pixels.
                fillColor = 'red';    //If the point_count >= 750, color is red.
            } else if (clusterSize >= 100) {
                radius = 30;    //If point_count >= 100, radius is 30 pixels.
                fillColor = 'yellow';    //If the point_count >= 100, color is yellow.
            }

            //Create an SVG string of a circle with the specified radius and color.
            var svg = ['<svg xmlns="http://www.w3.org/2000/svg" width="', (radius * 2), '" height="', (radius * 2), '">',
                '<circle cx="', radius, '" cy="', radius, '" r="', radius, '" fill="', fillColor, '"/>',
                '<text x="50%" y="50%" dominant-baseline="middle" text-anchor="middle" style="font-size:12px;font-family:arial;fill:black;" >{text}</text>',
                '</svg>'];

            //Customize the clustered pushpin using the generated SVG and anchor on its center.
            cluster.setOptions({
                icon: svg.join(''),
                anchor: new Microsoft.Maps.Point(radius, radius),
                textOffset: new Microsoft.Maps.Point(0, radius - 8) //Subtract 8 to compensate for height of text.
            });
        }
    </script>

    <!-- Bing Maps Script Reference -->
    <script src="https://www.bing.com/api/maps/mapcontrol?callback=initMap" async defer></script>
</head>
<body>
    <div id='myMap' style='position:relative;width:600px;height:400px;'></div>
</body>
</html>
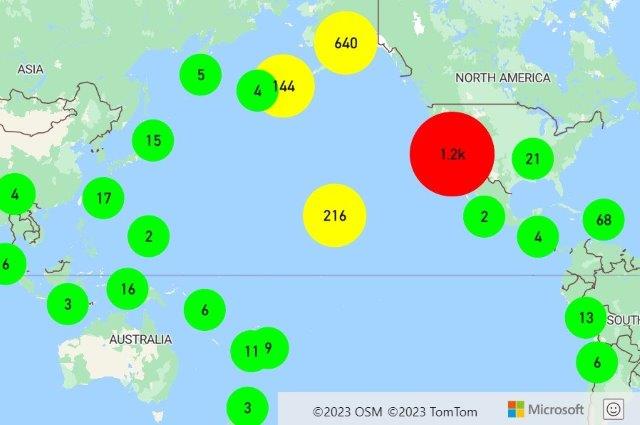
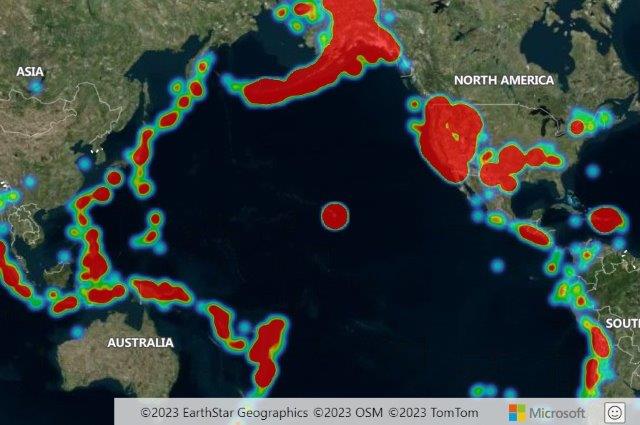
後: Azure Maps
Azure Maps では、データはデータ ソースによって追加および管理されます。 レイヤーはデータ ソースに接続され、そこでデータがレンダリングされます。 Azure Maps の DataSource クラスでは、いくつかのクラスタリング オプションが提供されます。
cluster– データ ソースにポイント データをクラスタリングするように指示します。clusterRadius-ポイントをまとめてクラスタリングする場合の半径 (ピクセル単位)。clusterMaxZoom- クラスタリングが行われる最大ズーム レベル。 それ以外のズームでは、すべてのポイントがシンボルとしてレンダリングされます。clusterProperties- 各クラスター内のすべてのポイントに対して式を使用して計算され、各クラスター ポイントのプロパティに追加されるカスタム プロパティを定義します。
クラスタリングが有効になっている場合、データ ソースは、クラスター化および非クラスター化データ ポイントをレンダリングするためにレイヤーに送信します。 データ ソースでは、数十万のデータ ポイントをクラスタリングすることができます。 クラスタリングされたデータ ポイントには、次のプロパティがあります。
| プロパティ名 | 種類 | Description |
|---|---|---|
cluster |
boolean | フィーチャーがクラスターを表すかどうかを示します。 |
cluster_id |
string | DataSource クラスの関数である getClusterExpansionZoom、getClusterChildren、getClusterLeaves で使用できるクラスターの一意の ID。 |
point_count |
number | クラスターに含まれているポイントの数。 |
point_count_abbreviated |
string | point_count の値が長い場合にその値を省略形にした文字列。 (たとえば、4,000 が 4K になります) |
DataSource クラスには、cluster_id を使用してクラスターに関する追加情報にアクセスするための次のヘルパー関数があります。
| 機能 | の戻り値の型 : | 説明 |
|---|---|---|
getClusterChildren(clusterId: number) |
Promise<Feature<Geometry, any> | Shape> |
次のズーム レベルで指定されたクラスターの子を取得します。 これらの子は、シェイプとサブクラスターを組み合わせたものである場合があります。 サブクラスターは、クラスターのプロパティと一致するプロパティを備えた機能です。 |
getClusterExpansionZoom(clusterId: number) |
Promise<number> |
クラスターが拡大し始めるか、または分解するズーム レベルを計算します。 |
getClusterLeaves(clusterId: number, limit: number, offset: number) |
Promise<Feature<Geometry, any> | Shape> |
クラスター内のすべてのポイントを取得します。 ポイントのサブセットを返すには limit を設定し、ポイントをページ送りするには offset を使用します。 |
クラスター化されたデータをマップにレンダリングする際、多くの場合は、2 つ以上のレイヤーを使用するのが最も簡単です。 次の例では、3 つのレイヤーを使用します。つまり、クラスターのサイズに基づいてスケーリングされた色付き円を描画するためのバブル レイヤー、クラスター サイズをテキストとしてレンダリングするためのシンボル レイヤー、およびクラスタリング解除されたポイントをレンダリングするための 2 番目のシンボル レイヤーです。 Azure Maps でのクラスター化データのレンダリングの詳細については、「Web SDK でのポイント データのクラスタリング」を参照してください。
GeoJSON データは、DataSource クラスの importDataFromUrl 関数を使用して、Azure Maps に直接インポートできます。
<!DOCTYPE html>
<html>
<head>
    <title></title>
    <meta charset="utf-8" />
    <meta http-equiv="x-ua-compatible" content="IE=Edge" />
    <meta name="viewport" content="width=device-width, initial-scale=1, shrink-to-fit=no" />

    <!-- Add references to the Azure Maps Map control JavaScript and CSS files. -->
    <link rel="stylesheet" href="https://atlas.microsoft.com/sdk/javascript/mapcontrol/3/atlas.min.css" type="text/css" />
    <script src="https://atlas.microsoft.com/sdk/javascript/mapcontrol/3/atlas.min.js"></script>

    <script type='text/javascript'>
        var map, datasource;
        var earthquakeFeed = 'https://earthquake.usgs.gov/earthquakes/feed/v1.0/summary/all_week.geojson';

        function initMap() {
            //Initialize a map instance.
            map = new atlas.Map('myMap', {
                center: [-160, 20],
                zoom: 1,

                //Add your Azure Maps key to the map SDK. Get an Azure Maps key at https://azure.com/maps. NOTE: The primary key should be used as the key.
                authOptions: {
                    authType: 'subscriptionKey',
                    subscriptionKey: '<Your Azure Maps Key>'
                }
            });

            //Wait until the map resources are ready.
            map.events.add('ready', function () {

                //Create a data source and add it to the map.
                datasource = new atlas.source.DataSource(null, {
                    //Tell the data source to cluster point data.
                    cluster: true
                });
                map.sources.add(datasource);

                //Create layers for rendering clusters, their counts and unclustered points and add the layers to the map.
                map.layers.add([
                    //Create a bubble layer for rendering clustered data points.
                    new atlas.layer.BubbleLayer(datasource, null, {
                        //Scale the size of the clustered bubble based on the number of points inthe cluster.
                        radius: [
                            'step',
                            ['get', 'point_count'],
                            20,         //Default of 20 pixel radius.
                            100, 30,    //If point_count >= 100, radius is 30 pixels.
                            750, 40     //If point_count >= 750, radius is 40 pixels.
                        ],

                        //Change the color of the cluster based on the value on the point_cluster property of the cluster.
                        color: [
                            'step',
                            ['get', 'point_count'],
                            'lime',            //Default to lime green.
                            100, 'yellow',     //If the point_count >= 100, color is yellow.
                            750, 'red'         //If the point_count >= 750, color is red.
                        ],
                        strokeWidth: 0,
                        filter: ['has', 'point_count'] //Only rendered data points that have a point_count property, which clusters do.
                    }),

                    //Create a symbol layer to render the count of locations in a cluster.
                    new atlas.layer.SymbolLayer(datasource, null, {
                        iconOptions: {
                            image: 'none' //Hide the icon image.
                        },
                        textOptions: {
                            textField: ['get', 'point_count_abbreviated'],
                            offset: [0, 0.4]
                        }
                    }),

                    //Create a layer to render the individual locations.
                    new atlas.layer.SymbolLayer(datasource, null, {
                        filter: ['!', ['has', 'point_count']] //Filter out clustered points from this layer.
                    })
                ]);

                //Retrieve a GeoJSON data set and add it to the data source.
                datasource.importDataFromUrl(earthquakeFeed);
            });
        }
    </script>
</head>
<body onload="initMap()">
    <div id='myMap' style='position:relative;width:600px;height:400px;'></div>
</body>
</html>
参考情報
ヒート マップを追加する
ヒート マップは、点密度マップとも呼ばれ、一定の範囲の色を使用して、データの密度を表すために使用されるデータ視覚化の一種です。 多くの場合、マップ上のデータの "ホットスポット" を示すために使用され、大規模なポイント データ セットをレンダリングする場合に適しています。
次の例では、USGS から過去 1 か月間のすべての地震の GeoJSON フィードを読み込み、ヒート マップとしてレンダリングします。
前: Bing 地図
Bing 地図でヒート マップを作成するには、ヒート マップ モジュールを読み込みます。 同様に、GeoJSON データに対応するために GeoJSON モジュールを読み込みます。
<!DOCTYPE html>
<html>
<head>
    <title></title>
    <meta charset="utf-8" />
    <meta http-equiv="x-ua-compatible" content="IE=Edge" />
    <meta name="viewport" content="width=device-width, initial-scale=1, shrink-to-fit=no" />

    <script type='text/javascript'>
        var map;
        var earthquakeFeed = 'https://earthquake.usgs.gov/earthquakes/feed/v1.0/summary/all_month.geojson';

        function initMap() {
            map = new Microsoft.Maps.Map(document.getElementById('myMap'), {
                credentials: '<Your Bing Maps Key>',
                center: new Microsoft.Maps.Location(20, -160),
                zoom: 2,
                mapTypeId: Microsoft.Maps.MapTypeId.aerial
            });

            //Load the GeoJSON and HeatMap modules.
            Microsoft.Maps.loadModule(['Microsoft.Maps.GeoJson', 'Microsoft.Maps.HeatMap'], function () {

                //Load the GeoJSON data from a URL.
                Microsoft.Maps.GeoJson.readFromUrl(earthquakeFeed, function (shapes) {

                    //Create a heat map and add it to the map.
                    var heatMap = new Microsoft.Maps.HeatMapLayer(shapes, {
                        opacity: 0.65,
                        radius: 10
                    });
                    map.layers.insert(heatMap);
                });
            });
        }
    </script>

    <!-- Bing Maps Script Reference -->
    <script src="https://www.bing.com/api/maps/mapcontrol?callback=initMap" async defer></script>
</head>
<body>
    <div id='myMap' style='position:relative;width:600px;height:400px;'></div>
</body>
</html>
後: Azure Maps
Azure Maps で、GeoJSON データをデータ ソースに読み込み、そのデータ ソースをヒート マップ レイヤーに接続します。 GeoJSON データは、DataSource クラスの importDataFromUrl 関数を使用して、Azure Maps に直接インポートできます。
<!DOCTYPE html>
<html>
<head>
    <title></title>
    <meta charset="utf-8" />
    <meta http-equiv="x-ua-compatible" content="IE=Edge" />
    <meta name="viewport" content="width=device-width, initial-scale=1, shrink-to-fit=no" />

    <!-- Add references to the Azure Maps Map control JavaScript and CSS files. -->
    <link rel="stylesheet" href="https://atlas.microsoft.com/sdk/javascript/mapcontrol/3/atlas.min.css" type="text/css" />
    <script src="https://atlas.microsoft.com/sdk/javascript/mapcontrol/3/atlas.min.js"></script>

    <script type='text/javascript'>
        var map;
        var earthquakeFeed = 'https://earthquake.usgs.gov/earthquakes/feed/v1.0/summary/all_month.geojson';

        function initMap() {
            //Initialize a map instance.
            map = new atlas.Map('myMap', {
                center: [-160, 20],
                zoom: 1,
                style: 'satellite_road_labels',

                //Add your Azure Maps key to the map SDK. Get an Azure Maps key at https://azure.com/maps. NOTE: The primary key should be used as the key.
                authOptions: {
                    authType: 'subscriptionKey',
                    subscriptionKey: '<Your Azure Maps Key>'
                }
            });

            //Wait until the map resources are ready.
            map.events.add('ready', function () {

                //Create a data source and add it to the map.
                datasource = new atlas.source.DataSource();
                map.sources.add(datasource);

                //Load the earthquake data.
                datasource.importDataFromUrl(earthquakeFeed);

                //Create a layer to render the data points as a heat map.
                map.layers.add(new atlas.layer.HeatMapLayer(datasource, null, {
                    opacity: 0.65,
                    radius: 10
                }));
            });
        }
    </script>
</head>
<body onload="initMap()">
    <div id='myMap' style='position:relative;width:600px;height:400px;'></div>
</body>
</html>
その他のリソース
タイル レイヤーをオーバーレイする
タイル レイヤーを使用すると、マップ タイル システムに合わせて、より小さなタイル表示されたイメージに分割されたより大きなイメージをオーバーレイすることができます。 これは、大きな画像や大規模なデータ セットをオーバーレイする一般的な方法です。
次の例では、X、Y、ズームのタイル名前付けスキーマを使用するアイオワ州立大学の Iowa Environmental Mesonet の気象レーダー タイル レイヤーをオーバーレイします。
前: Bing 地図
Bing 地図では、Microsoft.Maps.TileLayer クラスを使用して、タイル レイヤーを作成できます。
var weatherTileLayer = new Microsoft.Maps.TileLayer({
    mercator: new Microsoft.Maps.TileSource({
        uriConstructor: 'https://mesonet.agron.iastate.edu/cache/tile.py/1.0.0/nexrad-n0q-900913/{zoom}/{x}/{y}.png'
    })
});
map.layers.insert(weatherTileLayer);
後: Azure Maps
Azure Maps では、他のレイヤーとほぼ同じように、タイル レイヤーをマップに追加できます。 x、y、ズーム プレースホルダー({x}、{y}、{z}) の書式設定された URL はそれぞれ、タイルにアクセスする場所をレイヤーに指示するために使用されます。 Azure Maps のタイル レイヤーでは、{quadkey}、{bbox-epsg-3857}、{subdomain} プレースホルダーもサポートされます。
ヒント
Azure Maps では、レイヤーは、基本マップ レイヤーを含む、他のレイヤーの下にレンダリングできます。 多くの場合、読みやすいようにタイル レイヤーをマップ ラベルの下にレンダリングすることをお勧めします。 map.layers.add 関数には第 2 パラメーターがあります。これは、2 つ目のレイヤーの ID です。新しいレイヤーはこの下に挿入されます。 マップ ラベルの下にタイル レイヤーを挿入する場合は、次のコードを使用できます。
map.layers.add(myTileLayer, "labels");
//Create a tile layer and add it to the map below the label layer.
map.layers.add(new atlas.layer.TileLayer({
    tileUrl: 'https://mesonet.agron.iastate.edu/cache/tile.py/1.0.0/nexrad-n0q-900913/{z}/{x}/{y}.png',
    opacity: 0.8,
    tileSize: 256
}), 'labels');
ヒント
タイル要求は、マップの transformRequest オプションを使用してキャプチャできます。 これにより、必要に応じて、要求に対してヘッダーの変更や追加を行うことができます。
その他のリソース
トラフィック データを表示する
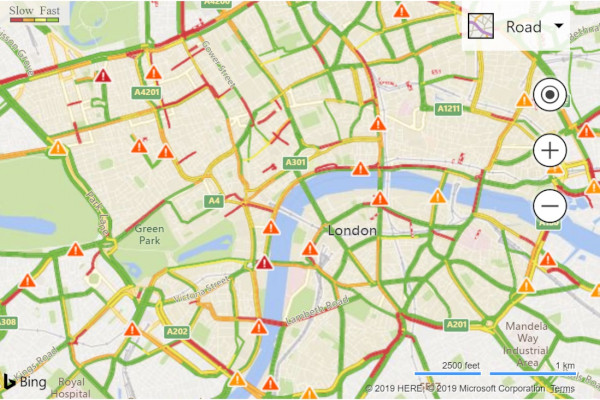
交通データは、Bing と Azure のどちらのマップにもオーバーレイできます。
前: Bing 地図
Bing 地図では、交通モジュールを使用して、交通データをマップにオーバーレイすることができます。
Microsoft.Maps.loadModule('Microsoft.Maps.Traffic', function () {
    var manager = new Microsoft.Maps.Traffic.TrafficManager(map);
    manager.show();
});
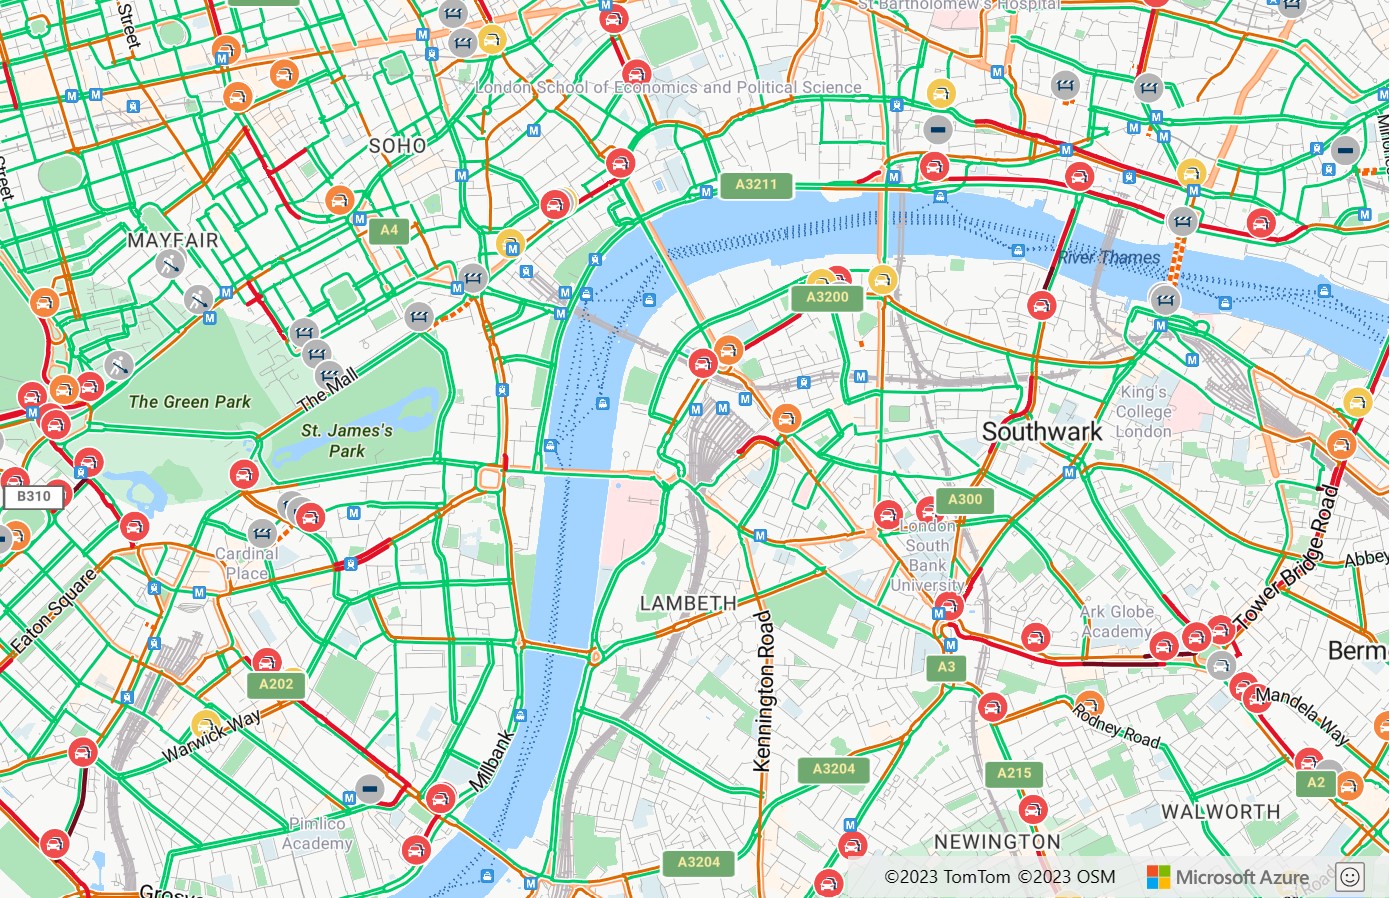
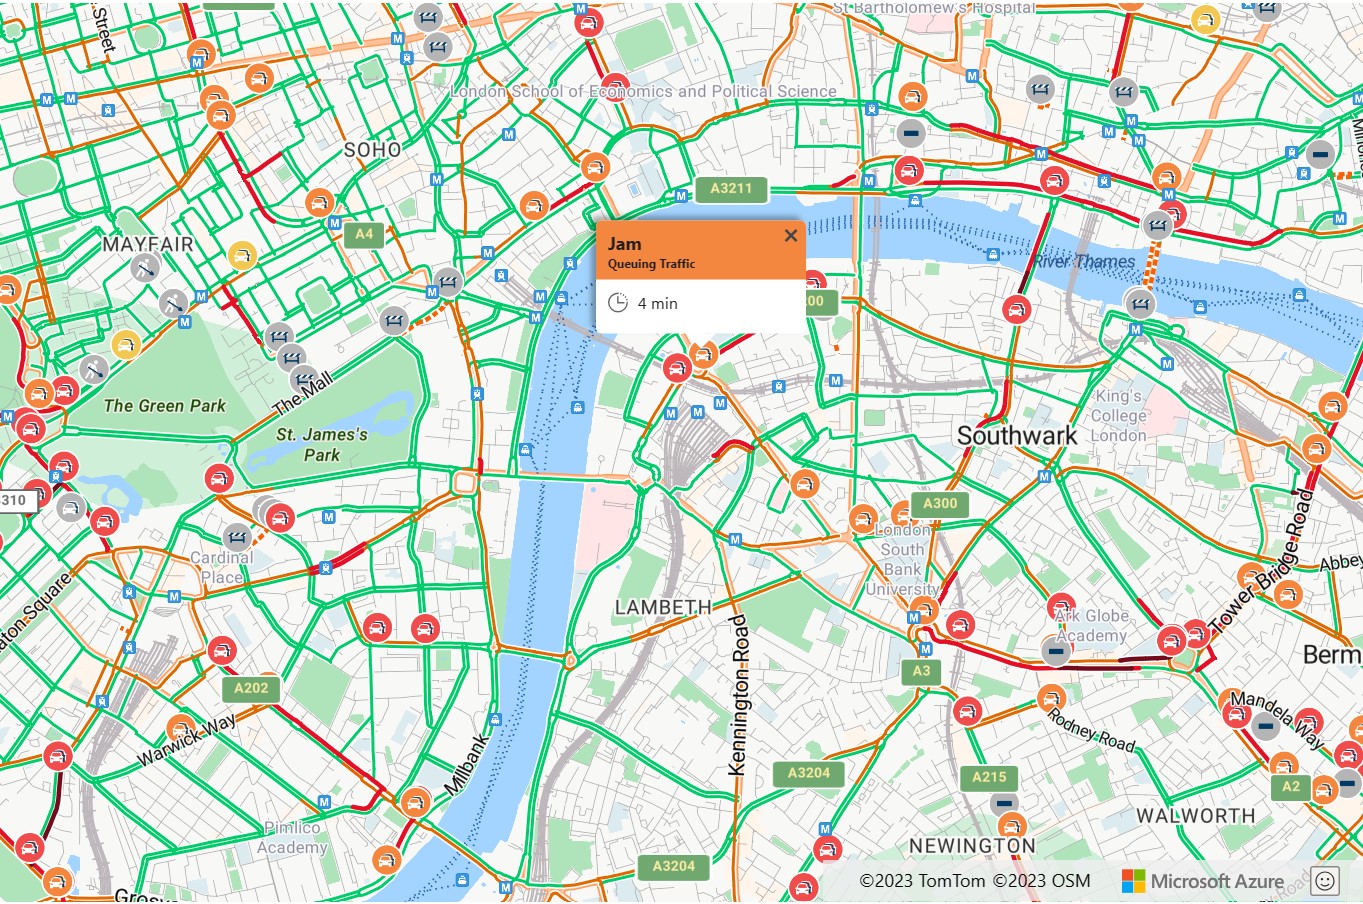
後: Azure Maps
Azure Maps では、交通情報を表示するためのさまざまなオプションが提供されます。 道路の閉鎖や事故などの交通事故は、マップ上にアイコンとして表示できます。 交通流量、色分けされた道路をマップ上にオーバーレイでき、掲示された速度制限、通常予想される遅延、または絶対遅延を基準として、色を変更することができます。 Azure Maps の事故データは 1 分ごとに、流量データは 2 分ごとに更新されます。
map.setTraffic({
    incidents: true,
    flow: 'relative'
});
Azure Maps のいずれかの交通情報アイコンをクリックすると、ポップアップに情報がさらに表示されます。
その他のリソース
グラウンド オーバーレイを追加する
Bing と Azure のどちらのマップも、マップのパンやズームに伴って移動や拡大縮小するジオリファレンスされた画像をマップ上でオーバーレイすることがサポートされています。 Bing 地図では、これらはグラウンド オーバーレイとして知られており、Azure Maps では、画像レイヤーと呼ばれます。 画像レイヤーは、ビルの図面、古いマップのオーバーレイ、ドローンからの映像に適しています。
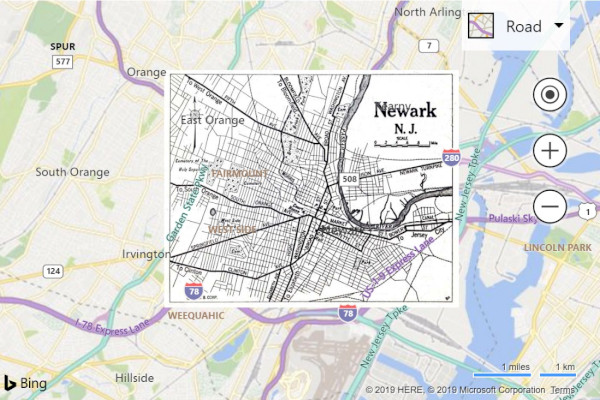
前: Bing 地図
Bing 地図でグラウンド オーバーレイを作成するには、オーバーレイ画像の URL と、マップに画像をバインドする境界ボックスを指定する必要があります。 この例では、マップ上に 1922 年のニュージャージー州のニューアークのマップ イメージをオーバーレイします。
<!DOCTYPE html>
<html>
<head>
    <title></title>
    <meta charset="utf-8" />
    <meta http-equiv="x-ua-compatible" content="IE=Edge" />
    <meta name="viewport" content="width=device-width, initial-scale=1, shrink-to-fit=no" />

    <script type='text/javascript'>
        var map;

        function initMap() {
            map = new Microsoft.Maps.Map(document.getElementById('myMap'), {
                credentials: '<Your Bing Maps Key>',
                center: new Microsoft.Maps.Location(40.740, -74.18),
                zoom: 12
            });

            var overlay = new Microsoft.Maps.GroundOverlay({
                //Create a LocationRect from the edges of the bounding box; north, west, south, east.
                bounds: Microsoft.Maps.LocationRect.fromEdges(40.773941, -74.22655, 40.712216, -74.12544),
                imageUrl: 'newark_nj_1922.jpg'
            });
            map.layers.insert(overlay);
        }
    </script>

    <!-- Bing Maps Script Reference -->
    <script src="https://www.bing.com/api/maps/mapcontrol?callback=initMap" async defer></script>
</head>
<body>
    <div id='myMap' style='position:relative;width:600px;height:400px;'></div>
</body>
</html>
ブラウザーでこのコードを実行すると、次の画像のようなマップが表示されます。
後: Azure Maps
Azure Maps では、atlas.layer.ImageLayer クラスを使用して、ジオリファレンスされたイメージをオーバーレイできます。 このクラスでは、イメージへの URL と、イメージの四隅の座標のセットが必要です。 イメージは、同じドメインでホストされているか、CORS が有効になっている必要があります。
ヒント
画像の各隅の座標ではなく、北、南、東、西および回転の情報のみがある場合は、静的な atlas.layer.ImageLayer.getCoordinatesFromEdges 関数を使用できます。
<!DOCTYPE html>
<html>
<head>
    <title></title>
    <meta charset="utf-8" />
    <meta http-equiv="x-ua-compatible" content="IE=Edge" />
    <meta name="viewport" content="width=device-width, initial-scale=1, shrink-to-fit=no" />

    <!-- Add references to the Azure Maps Map control JavaScript and CSS files. -->
    <link rel="stylesheet" href="https://atlas.microsoft.com/sdk/javascript/mapcontrol/3/atlas.min.css" type="text/css" />
    <script src="https://atlas.microsoft.com/sdk/javascript/mapcontrol/3/atlas.min.js"></script>

    <script type='text/javascript'>
        var map;

        function initMap() {
            //Initialize a map instance.
            map = new atlas.Map('myMap', {
                center: [-74.18, 40.740],
                zoom: 12,

                //Add your Azure Maps key to the map SDK. Get an Azure Maps key at https://azure.com/maps. NOTE: The primary key should be used as the key.
                authOptions: {
                    authType: 'subscriptionKey',
                    subscriptionKey: '<Your Azure Maps Key>'
                }
            });

            //Wait until the map resources are ready.
            map.events.add('ready', function () {

                //Create an image layer and add it to the map.
                map.layers.add(new atlas.layer.ImageLayer({
                    url: 'newark_nj_1922.jpg',
                    coordinates: [
                        [-74.22655, 40.773941], //Top Left Corner
                        [-74.12544, 40.773941], //Top Right Corner
                        [-74.12544, 40.712216], //Bottom Right Corner
                        [-74.22655, 40.712216]  //Bottom Left Corner
                    ]
                }));
            });
        }
    </script>
</head>
<body onload="initMap()">
    <div id='myMap' style='position:relative;width:600px;height:400px;'></div>
</body>
</html>

参考情報
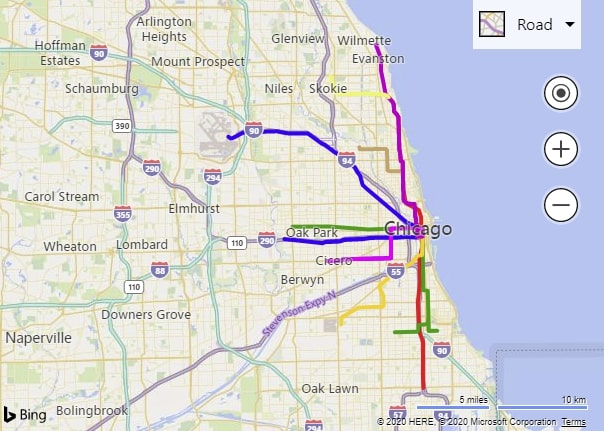
マップへの KML データの追加
Azure と Bing のどちらのマップも、KML、KMZ、GeoRSS、GeoJSON、Well-Known Text (WKT) のデータをインポートしてマップ上にレンダリングすることができます。 Azure Maps ではさらに、GPX、GML、空間 CSV ファイル、Web Mapping Services (WMS)、Web Mapping Tile Services (WMTS)、Web Feature Services (WFS) がサポートされます。
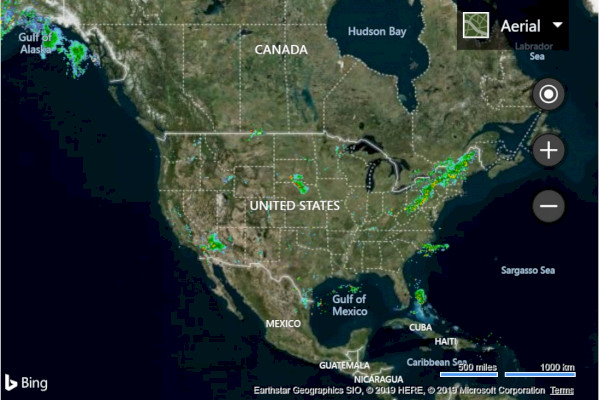
前: Bing 地図
ブラウザーでこのコードを実行すると、次の画像のようなマップが表示されます。
<!DOCTYPE html>
<html>
<head>
    <title></title>
    <meta charset="utf-8" />
    <meta http-equiv="x-ua-compatible" content="IE=Edge" />
    <meta name="viewport" content="width=device-width, initial-scale=1, shrink-to-fit=no" />

    <script type='text/javascript'>
        var map;

        function initMap() {
            map = new Microsoft.Maps.Map('#myMap', {
                credentials: '<Your Bing Maps Key>',
                center: new Microsoft.Maps.Location(40.747, -73.985),
                zoom: 12
            });

            Microsoft.Maps.loadModule('Microsoft.Maps.GeoXml', function () {
                var callback = function (dataset) {
                    if (dataset.shapes) {
                        var l = new Microsoft.Maps.Layer();
                        l.add(dataset.shapes);
                        map.layers.insert(l);
                    }
                    if (dataset.layers) {
                        for (var i = 0, len = dataset.layers.length; i < len; i++) {
                            map.layers.insert(dataset.layers[i]);
                        }
                    }
                };
                Microsoft.Maps.GeoXml.readFromUrl('myKMLFile.kml', { error: function (msg) { alert(msg); } }, callback);
            });
        }
    </script>

    <!-- Bing Maps Script Reference -->
    <script src="https://www.bing.com/api/maps/mapcontrol?callback=initMap" async defer></script>
</head>
<body>
    <div id='myMap' style='position:relative;width:600px;height:400px;'></div>
</body>
</html>
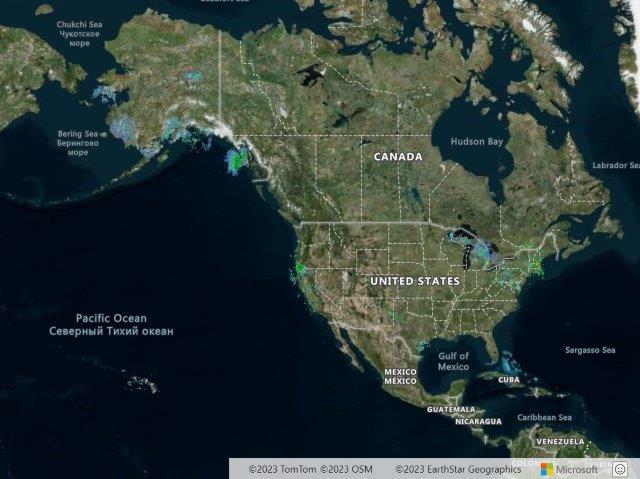
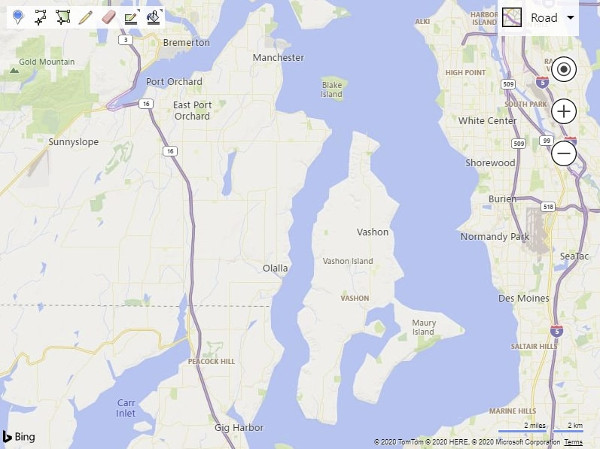
後: Azure Maps
Azure Maps では、GeoJSON が Web SDK で使用される主なデータ形式となりますが、空間 IO モジュールを使用すれば、その他の空間データ形式も容易に統合することができます。 このモジュールには、空間データの読み取りと書き込みの両方に対応した関数のほか、これらの空間データ形式から簡単にデータをレンダリングできるシンプルなデータ レイヤーが備わっています。 空間データ ファイルのデータを読み取るには、URL を (あるいは生データを文字列または BLOB として) atlas.io.read 関数に渡します。 これによってファイルから解析済みのデータがすべて返され、後でマップに追加できます。 KML は、多くのスタイル情報を含んでいるため、ほとんどの空間データ形式と比べてやや複雑です。 こうしたスタイルの大半のレンダリングは、SpatialDataLayer クラスでサポートされますが、地物データを読み込む前にアイコン画像をマップに読み込む必要があり、また、別途レイヤーとしてグラウンド オーバーレイをマップに追加する必要があります。 URL でデータを読み込む場合は、CORS が有効なエンドポイントでデータがホストされているか、または、読み取り関数にオプションとしてプロキシ サービスを渡す必要があります。
<!DOCTYPE html>
<html>
<head>
    <title></title>
    <meta charset="utf-8" />
    <meta http-equiv="x-ua-compatible" content="IE=Edge" />
    <meta name="viewport" content="width=device-width, initial-scale=1, shrink-to-fit=no" />

    <!-- Add references to the Azure Maps Map control JavaScript and CSS files. -->
    <link rel="stylesheet" href="https://atlas.microsoft.com/sdk/javascript/mapcontrol/3/atlas.min.css" type="text/css" />
    <script src="https://atlas.microsoft.com/sdk/javascript/mapcontrol/3/atlas.min.js"></script>

    <!-- Add reference to the Azure Maps Spatial IO module. -->
    <script src="https://atlas.microsoft.com/sdk/javascript/spatial/0/atlas-spatial.js"></script>

    <script type='text/javascript'>
        var map, datasource, layer;

        function initMap() {
            //Initialize a map instance.
            map = new atlas.Map('myMap', {
                view: 'Auto',

                //Add your Azure Maps key to the map SDK. Get an Azure Maps key at https://azure.com/maps. NOTE: The primary key should be used as the key.
                authOptions: {
                    authType: 'subscriptionKey',
                    subscriptionKey: '<Your Azure Maps Key>'
                }
            });

            //Wait until the map resources are ready.
            map.events.add('ready', function () {

                //Create a data source and add it to the map.
                datasource = new atlas.source.DataSource();
                map.sources.add(datasource);

                //Add a simple data layer for rendering the data.
                layer = new atlas.layer.SimpleDataLayer(datasource);
                map.layers.add(layer);

                //Read a KML file from a URL or pass in a raw KML string.
                atlas.io.read('myKMLFile.kml').then(async r => {
                    if (r) {

                        //Check to see if there are any icons in the data set that need to be loaded into the map resources.
                        if (r.icons) {
                            //For each icon image, create a promise to add it to the map, then run the promises in parrallel.
                            var imagePromises = [];

                            //The keys are the names of each icon image.
                            var keys = Object.keys(r.icons);

                            if (keys.length !== 0) {
                                keys.forEach(function (key) {
                                    imagePromises.push(map.imageSprite.add(key, r.icons[key]));
                                });

                                await Promise.all(imagePromises);
                            }
                        }

                        //Load all features.
                        if (r.features && r.features.length > 0) {
                            datasource.add(r.features);
                        }

                        //Load all ground overlays.
                        if (r.groundOverlays && r.groundOverlays.length > 0) {
                            map.layers.add(r.groundOverlays);
                        }

                        //If bounding box information is known for data, set the map view to it.
                        if (r.bbox) {
                            map.setCamera({ bounds: r.bbox, padding: 50 });
                        }
                    }
                });
            });
        }
    </script>
</head>
<body onload="initMap()">
    <div id='myMap' style='position:relative;width:600px;height:400px;'></div>
</body>
</html>

参考情報
描画ツールの追加
Bing 地図と Azure Maps のどちらにも、ユーザーがマウスや他の入力デバイスを使用してマップで図形の描画や編集できるようにするモジュールが用意されています。 どちらも、画鋲、線、多角形の描画がサポートされます。 Azure Maps にはさらに、円や四角形を描画するためのオプションがあります。
前: Bing 地図
Bing 地図では、Microsoft.Maps.loadModule 関数を使用して DrawingTools モジュールを読み込みます。 読み込み後、DrawingTools クラスのインスタンスを作成できるので、その showDrawingManager 関数を呼び出してマップにツール バーを追加します。
<!DOCTYPE html>
<html>
<head>
    <title></title>
    <meta charset="utf-8" />
    <meta http-equiv="x-ua-compatible" content="IE=Edge" />
    <meta name="viewport" content="width=device-width, initial-scale=1, shrink-to-fit=no" />

    <script type='text/javascript'>
    var map, drawingManager;

    function initMap() {
        map = new Microsoft.Maps.Map('#myMap', {
            credentials: '<Your Bing Maps Key>'
        });

        //Load the DrawingTools module
        Microsoft.Maps.loadModule('Microsoft.Maps.DrawingTools', function () {
            //Create an instance of the DrawingTools class and bind it to the map.
            var tools = new Microsoft.Maps.DrawingTools(map);

            //Show the drawing toolbar and enable editting on the map.
            tools.showDrawingManager(function (manager) {
                //Store a reference to the drawing manager as it will be useful later.
                drawingManager = manager;
            });
        });
    }
    </script>

    <!-- Bing Maps Script Reference -->
    <script src="https://www.bing.com/api/maps/mapcontrol?callback=initMap" async defer></script>
</head>
<body>
    <div id='myMap' style='position:relative;width:600px;height:400px;'></div>
</body>
</html>
後: Azure Maps
Azure Maps では、アプリで参照する必要のある JavaScript や CSS のファイルを読み込んで、描画ツール モジュールを読み込む必要があります。 マップが読み込まれると、DrawingManager クラスのインスタンスを作成し、DrawingToolbar インスタンスをアタッチすることができます。
<!DOCTYPE html>
<html>
<head>
    <title></title>
    <meta charset="utf-8" />
    <meta http-equiv="x-ua-compatible" content="IE=Edge" />
    <meta name="viewport" content="width=device-width, initial-scale=1, shrink-to-fit=no" />

    <!-- Add references to the Azure Maps Map control JavaScript and CSS files. -->
    <link rel="stylesheet" href="https://atlas.microsoft.com/sdk/javascript/mapcontrol/3/atlas.min.css" type="text/css" />
    <script src="https://atlas.microsoft.com/sdk/javascript/mapcontrol/3/atlas.min.js"></script>

    <!-- Add references to the Azure Maps Map Drawing Tools JavaScript and CSS files. -->
    <link rel="stylesheet" href="https://atlas.microsoft.com/sdk/javascript/drawing/0/atlas-drawing.min.css" type="text/css" />
    <script src="https://atlas.microsoft.com/sdk/javascript/drawing/0/atlas-drawing.min.js"></script>

    <script type='text/javascript'>
        var map, drawingManager;

        function initMap() {
            //Initialize a map instance.
            map = new atlas.Map('myMap', {
                view: 'Auto',

                //Add your Azure Maps key to the map SDK. Get an Azure Maps key at https://azure.com/maps. NOTE: The primary key should be used as the key.
                authOptions: {
                    authType: 'subscriptionKey',
                    subscriptionKey: '<Your Azure Maps Key>'
                }
            });

            //Wait until the map resources are ready.
            map.events.add('ready', function () {

                //Create an instance of the drawing manager and display the drawing toolbar.
                drawingManager = new atlas.drawing.DrawingManager(map, {
                    toolbar: new atlas.control.DrawingToolbar({ position: 'top-left' })
                });
            });
        }
    </script>
</head>
<body onload="initMap()">
    <div id="myMap" style="position:relative;width:600px;height:400px;"></div>
</body>
</html>

ヒント
Azure Maps のレイヤーでは、描画ツールに備わっているさまざまな方法を利用してユーザーが図形を描画できます。 たとえば多角形を描画する場合、ユーザーは、個々のポイントをクリックして追加するか、マウスの左ボタンを押し下げたままマウスをドラッグしてパスを描画することができます。 これは、DrawingManager の interactionType オプションを使用して変更できます。
その他のリソース
その他のリソース
オープンソースの Azure Maps Web SDK モジュールをご覧ください。 これらのモジュールは、他にも機能を備えており、自在にカスタマイズできます。
その他の Bing 地図機能の移行に関連したコード サンプルをご確認ください。
データ可視化
サービス
Azure Maps Web SDK の詳細について学習します。
次のステップ
Bing 地図から Azure Maps への移行について理解を深めます。