Google Maps를 사용하는 대부분의 웹앱은 Google Maps v3 JavaScript SDK를 사용합니다. Azure Maps Web SDK는 마이그레이션 대상이 되는 Azure 기반 SDK로 적합합니다. Azure Maps Web SDK를 사용하면 고유한 콘텐츠와 이미지를 사용해 대화형 맵을 사용자 지정할 수 있습니다. 웹 또는 모바일 애플리케이션 모두에서 앱을 실행할 수 있습니다. 이 컨트롤은 WebGL을 사용하므로, 대규모 데이터 세트를 고성능으로 렌더링할 수 있습니다. 이 SDK는 JavaScript 또는 TypeScript로 개발할 수 있습니다. 이 자습서에서는 다음을 다룹니다:
- 맵 로드
- 맵 지역화
- 마커, 폴리라인 및 폴리곤 추가
- 팝업 또는 정보 창에 정보 표시
- KML 및 GeoJSON 데이터 로드 및 표시
- 마커 클러스터링
- 타일 레이어 오버레이
- 트래픽 데이터 표시
- 그라운드 오버레이 추가
또한 다음 작업도 수행합니다.
- Azure Maps 웹 SDK를 사용하여 일반적인 매핑 작업을 수행하는 방법
- 성능과 사용자 경험을 개선하기 위한 모범 사례
- Azure Maps에서 제공되는 보다 고급 기능을 사용하는 팁.
기존 웹 애플리케이션을 마이그레이션하는 경우, 오픈 소스 맵 컨트롤 라이브러리를 사용하고 있는지 확인하세요. 오픈 소스 맵 컨트롤 라이브러리의 예로는 Cesium, Leaflet, OpenLayers가 있습니다. 오픈 소스 맵 컨트롤 라이브러리를 사용하고 있고 Azure Maps Web SDK를 사용하고 싶지 않은 경우에도 여전히 애플리케이션을 마이그레이션할 수 있습니다. 이러한 경우 애플리케이션을 Azure Maps 렌더링 서비스(road tiles | satellite tiles)에 연결하세요. 다음은 일반적으로 사용되는 오픈 소스 맵 컨트롤 라이브러리 중 일부에서 Azure Maps를 사용하는 방법에 대해 자세히 설명합니다.
- Cesium - 웹을 위한 3D 맵 컨트롤. Cesium 문서.
- Leaflet – 웹을 위한 경량 2D 맵 컨트롤. Leaflet 코드 샘플 | Leaflet 문서.
- OpenLayers - 투영을 지원하는 웹용 2D 맵 컨트롤. OpenLayers 문서.
JavaScript 프레임워크를 사용해 개발하는 경우, 다음 오픈 소스 프로젝트 중 하나가 유용할 수 있습니다:
- ng-azure-maps - Azure Maps를 위한 Angular 10 래퍼입니다.
- AzureMapsControl.Components - Azure Maps Blazor 구성 요소입니다.
- Azure Maps React Component - Azure Maps 컨트롤용 React 래퍼입니다.
- Vue Azure Maps - Vue 애플리케이션용 Azure Maps 구성 요소입니다.
필수 구성 요소
Azure 구독이 아직 없는 경우 시작하기 전에 체험 계정을 만듭니다.
참고
Azure Maps의 인증에 대한 자세한 내용은 Azure Maps의 인증 관리를 참조하세요.
핵심 기능 지원
이 표에는 Google Maps v3 JavaScript SDK의 주요 API 기능과 Azure Maps 웹 SDK에서 지원되는 API 기능이 나와 있습니다.
| Google Maps 기능 | Azure Maps Web SDK 지원 |
|---|---|
| 표식 | ✓ |
| 표식 클러스터링 | ✓ |
| 폴리라인 및& 다각형 | ✓ |
| 데이터 레이어 | ✓ |
| 그라운드 오버레이 | ✓ |
| 열 지도 | ✓ |
| 타일 레이어 | ✓ |
| KML 레이어 | ✓ |
| 그리기 도구 | ✓ |
| Geocoder 서비스 | ✓ |
| 길찾기 서비스 | ✓ |
| 거리 행렬 서비스 | ✓ |
웹 SDK의 주목할 만한 차이점
다음은 Google Maps와 Azure Maps Web SDK 간의 몇 가지 핵심 차이점입니다. 주의 깊게 살펴보세요:
- Azure Maps 웹 SDK에 액세스하기 위한 호스트된 엔드포인트를 제공하는 것 외에도, npm 패키지를 사용할 수 있습니다. Web SDK 패키지를 앱에 포함하는 방법에 대한 자세한 내용은 Azure Maps 맵 컨트롤 사용을 참조하세요. 이 패키지에는 TypeScript 정의도 포함되어 있습니다.
- 먼저 Azure Maps에서 Map 클래스 인스턴스를 만들어야 합니다. 맵과 상호 작용하는 코드를 작성하기 전에 맵의
ready또는load이벤트가 발생할 때까지 기다리세요. 이 순서를 따르면 모든 맵 리소스가 로드되고 액세스할 준비가 된 뒤에 코드를 실행하게 됩니다. - 두 플랫폼 모두 기본 맵에 비슷한 바둑판식 배열 시스템을 사용합니다. Google Maps의 타일은 크기가 256픽셀인 반면, Azure Maps의 타일은 크기가 512픽셀입니다. Azure Maps에서 Google Maps와 동일한 맵 보기를 만들려면, Azure Maps에서는 Google Maps 확대/축소 수준에서 숫자 1을 빼야 합니다.
- Google Maps에서는 좌표를
latitude,longitude라고 하지만, Azure Maps에서는longitude,latitude을(를) 사용합니다. Azure Maps 형식은 대부분의 GIS 플랫폼에서 따르는 표준[x, y]와(과) 일치합니다. - Azure Maps Web SDK의 도형은 GeoJSON 스키마를 기반으로 합니다. 도우미 클래스는 atlas.data 네임스페이스를 통해 노출됩니다. atlas.Shape 클래스도 있습니다. 이 클래스를 사용하여 GeoJSON 개체를 래핑하면 데이터를 바인딩 가능한 방식으로 쉽게 업데이트하고 유지 관리할 수 있습니다.
- Azure Maps에서 좌표는 Position 개체로 정의됩니다. 좌표는
[longitude,latitude]형식의 숫자 배열로 지정합니다. 또는 새로운 atlas.data.Position(경도, 위도)을 사용하여 지정됩니다.팁
Position 클래스에는 "위도, 경도" 형식의 좌표를 가져올 수 있는 정적 도우미 메서드가 있습니다. atlas.data.Position.fromLatLng 메서드는 Google Maps 코드에서
new google.maps.LatLng메서드로 대체할 수 있는 경우가 많습니다. - 맵에 추가되는 각 도형에 스타일링 정보를 지정하는 대신, Azure Maps에서는 스타일을 데이터와 분리합니다. 데이터는 데이터 원본에 저장되며 렌더링 레이어에 연결됩니다. Azure Maps 코드는 데이터 원본을 사용하여 데이터를 렌더링합니다. 이 접근 방식은 향상된 성능상 이점을 제공합니다. 또한 많은 레이어에서 데이터 기반 스타일링을 지원하므로, 레이어 스타일 옵션에 비즈니스 논리를 추가할 수 있습니다. 이 지원 기능을 사용하면 도형에 정의된 속성에 따라 레이어 내 개별 도형이 렌더링되는 방식이 달라집니다.
Web SDK 병렬 예제
이 컬렉션에는 각 플랫폼에 대한 코드 샘플이 있으며, 각 샘플은 일반적인 사용 사례를 다룹니다. Google Maps v3 JavaScript SDK에서 Azure Maps 웹 SDK로 웹 애플리케이션을 마이그레이션하는 데 도움이 됩니다. 웹 애플리케이션과 관련된 코드 샘플은 JavaScript로 제공됩니다. 하지만 Azure Maps는 또 다른 옵션으로 npm 모듈을 통해 TypeScript 정의도 제공합니다.
주제
- 맵 로드
- 맵 지역화
- 맵 뷰 설정
- 마커 추가
- 사용자 지정 마커 추가
- 폴리라인 추가
- 폴리곤 추가
- 정보 창 표시
- GeoJSON 파일 가져오기
- 마커 클러스터링
- 히트 맵 추가
- 타일 레이어 오버레이
- 교통 데이터 표시
- 그라운드 오버레이 추가
- 맵에 KML 데이터 추가
맵 로드
두 SDK 모두 맵을 로드하는 단계가 동일합니다.
- Map SDK를 참조로 추가하세요.
- 페이지 본문에 맵의 자리 표시자로 사용할
div태그를 추가하세요. - 페이지 로드가 완료되었을 때 호출될 JavaScript 함수를 만드세요.
- 해당 맵 클래스 인스턴스를 만드세요.
몇 가지 핵심 차이점
- Google Maps에서는 API 스크립트 참조에 계정 키를 지정해야 합니다. Azure Maps의 인증 자격 증명은 맵 클래스의 옵션으로 지정합니다. 이 자격 증명은 구독 키 또는 Microsoft Entra 정보가 될 수 있습니다.
- Google Maps에서는 API 스크립트 참조에 콜백 함수를 지정해 맵을 로드할 초기화 함수를 호출합니다. Azure Maps에서는 페이지의 onload 이벤트를 사용해야 합니다.
- 맵이 렌더링되는
div요소를 참조할 때, Azure Maps의Map클래스는id값만 필요하지만 Google Maps는HTMLElement개체가 필요합니다. - Azure Maps의 좌표는
[longitude, latitude]형식의 단순 숫자 배열로 지정할 수 있는 Position 개체로 정의됩니다. - Azure Maps의 줌 레벨은 Google Maps의 줌 레벨보다 한 단계 낮습니다. 이 차이는 두 플랫폼의 타일링 시스템 크기가 다르기 때문입니다.
- Azure Maps는 맵 캔버스에 탐색 컨트롤을 추가하지 않습니다. 따라서 기본적으로 맵에는 확대/축소 버튼과 맵 스타일 버튼이 없습니다. 하지만 맵 스타일 선택기, 확대/축소 버튼, 나침반 또는 회전 컨트롤, 피치 컨트롤을 추가하기 위한 컨트롤 옵션이 제공됩니다.
- Azure Maps에서는 맵 인스턴스의
ready이벤트를 모니터링하기 위해 이벤트 처리기를 추가합니다. 이 이벤트는 WebGL 컨텍스트와 필요한 모든 리소스 로딩을 맵이 완료했을 때 발생합니다. 맵 로딩이 완료된 후 실행할 코드는 이 이벤트 처리기에 추가하세요.
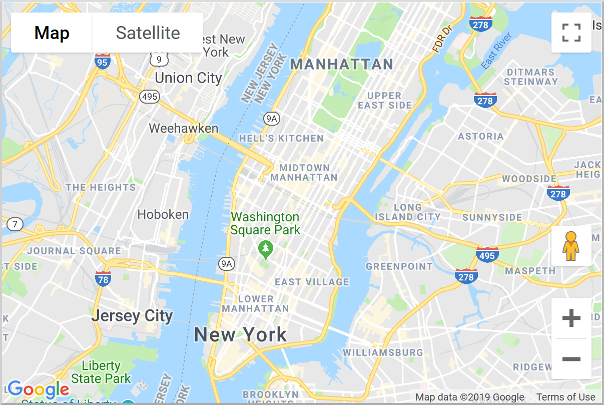
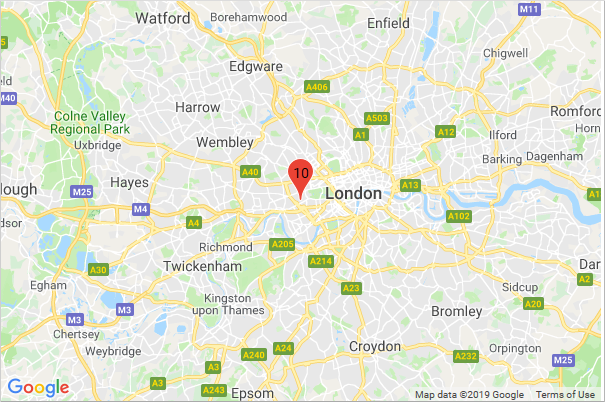
다음 예제에서는 Google Maps를 사용해 뉴욕을 중심으로 하는 좌표에 맵을 로드합니다. 경도: -73.985, 위도: 40.747이며, 맵 줌 레벨은 12입니다.
이전: Google Maps
지정된 위치를 중심으로 확대된 Google 맵을 표시합니다.
<!DOCTYPE html>
<html>
<head>
    <title></title>
    <meta charset="utf-8" />
    <meta http-equiv="x-ua-compatible" content="IE=Edge" />
    <meta name="viewport" content="width=device-width, initial-scale=1, shrink-to-fit=no" />

    <script type='text/javascript'>
        var map;

        function initMap() {
            map = new google.maps.Map(document.getElementById('myMap'), {
                center: new google.maps.LatLng(40.747, -73.985),
                zoom: 12
            });
        }
    </script>

    <!-- Google Maps Script Reference -->
    <script src="https://maps.googleapis.com/maps/api/js?callback=initMap&key={Your-Google-Maps-Key}" async defer></script>
</head>
<body>
    <div id='myMap' style='position:relative;width:600px;height:400px;'></div>
</body>
</html>
이 코드를 브라우저에서 실행하면 다음 이미지와 같은 맵이 표시됩니다.
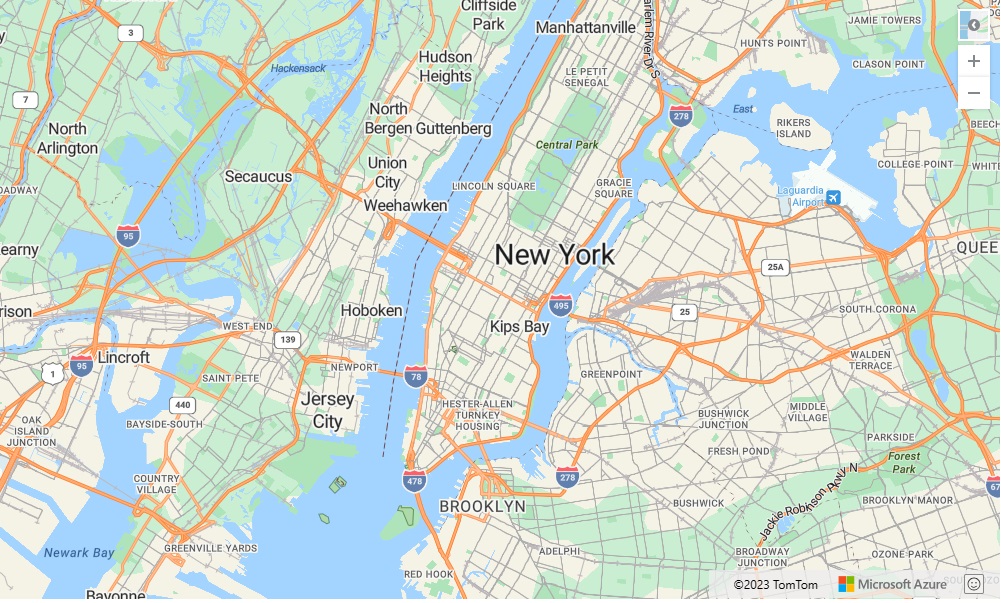
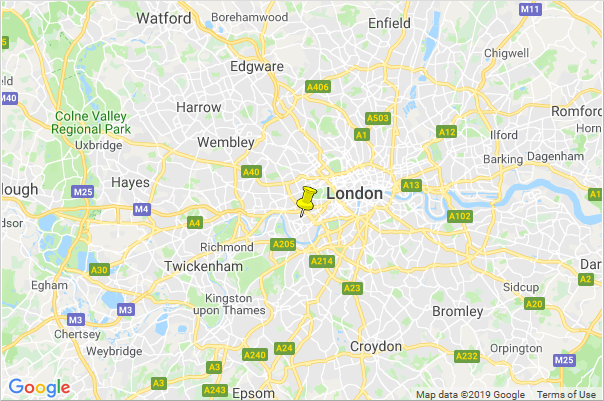
이후: Azure Maps
같은 뷰를 가진 맵을 Azure Maps에서 로드하고, 맵 스타일 컨트롤과 확대/축소 버튼을 함께 표시합니다.
<!DOCTYPE html>
<html>
<head>
    <title></title>
    <meta charset="utf-8" />
    <meta http-equiv="x-ua-compatible" content="IE=Edge" />
    <meta name="viewport" content="width=device-width, initial-scale=1, shrink-to-fit=no" />

    <!-- Add references to the Azure Maps Map control JavaScript and CSS files. -->
    <link rel="stylesheet" href="https://atlas.microsoft.com/sdk/javascript/mapcontrol/3/atlas.min.css" type="text/css" />
    <script src="https://atlas.microsoft.com/sdk/javascript/mapcontrol/3/atlas.min.js"></script>

    <script type='text/javascript'>
        var map;

        function initMap() {
            map = new atlas.Map('myMap', {
                center: [-73.985, 40.74],  //Format coordinates as longitude, latitude.
                zoom: 11,   //Subtract the zoom level by one.

                //Specify authentication information when loading the map.
                authOptions: {
                    authType: 'subscriptionKey',
                    subscriptionKey: '<Your Azure Maps Key>'
                }
            });

            //Wait until the map resources are ready.
            map.events.add('ready', function () {
                //Add zoom controls to bottom right of map.
                map.controls.add(new atlas.control.ZoomControl(), {
                    position: 'bottom-right'
                });

                //Add map style control in top left corner of map.
                map.controls.add(new atlas.control.StyleControl(), {
                    position: 'top-left'
                });
            });
        }
    </script>
</head>
<body onload="initMap()">
    <div id='myMap' style='position:relative;width:600px;height:400px;'></div>
</body>
</html>
이 코드를 브라우저에서 실행하면 다음 이미지와 같은 맵이 표시됩니다.
웹앱에서 Azure Maps 맵 컨트롤을 설정하고 사용하는 방법에 대한 자세한 내용은 Azure Maps 맵 컨트롤 사용을 참조하세요.
참고
Google Maps와 달리 Azure Maps는 맵을 로드할 때 초기 중심점과 줌 레벨을 요구하지 않습니다. 이 정보를 제공하지 않고 맵을 로드하면 Azure Maps가 사용자의 도시를 알아내려고 시도합니다. 그 곳을 중심으로 맵이 확대/축소됩니다.
추가 리소스:
- 맵 뷰를 회전하고 피치하기 위한 탐색 컨트롤에 대한 자세한 내용은 맵에 컨트롤 추가를 참조하세요.
맵 지역화
대상이 여러 국가/지역에 분산되어 있거나 서로 다른 언어를 사용하는 경우, 지역화가 중요합니다.
이전: Google Maps
Google Maps를 지역화하려면 언어 및 지역 매개 변수를 추가하세요.
<script type="text/javascript" src=" https://maps.googleapis.com/maps/api/js?callback=initMap&key={api-Key}&language={language-code}®ion={region-code}" async defer></script>
다음은 언어를 "fr-FR"로 설정한 Google Maps 예제입니다.
이후: Azure Maps
Azure Maps는 맵의 언어 및 지역 보기를 설정하는 두 가지 방법을 제공합니다. 첫 번째 옵션은 전역 atlas 네임스페이스에 이 정보를 추가하는 것입니다. 이렇게 하면 앱의 모든 맵 컨트롤 인스턴스가 기본적으로 이 설정을 사용합니다. 다음 예제는 언어를 프랑스어("fr-FR")로, 지역 보기를 "Auto(자동)"로 설정합니다:
atlas.setLanguage('fr-FR');
atlas.setView('auto');
두 번째 옵션은 맵을 로드할 때 맵 옵션에 이 정보를 전달하는 것입니다. 다음과 같습니다.
map = new atlas.Map('myMap', {
    language: 'fr-FR',
    view: 'auto',

    authOptions: {
        authType: 'subscriptionKey',
        subscriptionKey: '<Your Azure Maps Key>'
    }
});
참고
Azure Maps를 사용하면 다른 언어 및 지역 설정을 사용하여 동일한 페이지에 여러 개의 맵 인스턴스를 로드할 수 있습니다. 로드된 후에도 맵에서 이러한 설정을 업데이트할 수 있습니다.
지원되는 언어에 대한 자세한 내용은 Azure Maps에서의 지역화 지원을 참조하세요.
다음은 언어를 "fr"로, 사용자 지역을 "fr-FR"로 설정한 Azure Maps 예제입니다.

맵 뷰 설정
Azure와 Google Maps의 동적 맵은 둘 다 프로그래밍 방식으로 새로운 지리적 위치로 이동할 수 있습니다. 이렇게 하려면 JavaScript에서 적절한 함수를 호출합니다. 예제에서는 Google Maps에서 위성 항공 이미지를 표시하고, 맵을 특정 위치로 이동하고, 줌 레벨을 15로 변경하는 방법을 보여 줍니다. 사용되는 위치 좌표는 경도 -111.0225, 위도 35.0272입니다.
참고
Google Maps는 256픽셀 타일을 사용하는 반면, Azure Maps는 더 큰 512픽셀 타일을 사용합니다. 따라서 Azure Maps는 Google Maps와 동일한 맵 영역을 로드하기 위해 적은 네트워크 요청이 필요합니다. 지도 컨트롤의 타일 피라미드 구조로 인해 Azure Maps를 사용할 때 Google Maps에서 사용되는 확대/축소 수준에서 하나를 빼야 합니다. 이렇게 조정하면 Azure Maps에서 렌더링하는 더 큰 타일이 Google Maps에서 사용되는 것과 동일한 지도 영역을 사용할 수 있습니다.
이전: Google Maps
setOptions 메서드를 사용해 Google Maps 맵 컨트롤을 이동하세요. 이 메서드를 사용하면 맵의 중심과 줌 레벨을 지정할 수 있습니다.
map.setOptions({
    mapTypeId: google.maps.MapTypeId.SATELLITE,
    center: new google.maps.LatLng(35.0272, -111.0225),
    zoom: 15
});
이후: Azure Maps
Azure Maps에서 setCamera 메서드를 사용하여 맵 위치를 변경하고 setStyle 메서드를 사용하여 맵 스타일을 변경합니다. Azure Maps의 좌표는 "경도, 위도" 형식이고, 확대/축소 수준은 1을 뺀 값입니다.
map.setCamera({
    center: [-111.0225, 35.0272],
    zoom: 14
});

map.setStyle({
    style: 'satellite'
});

추가 리소스:
표식 추가
Azure Maps에서는 포인트 데이터를 맵에 렌더링하는 여러 가지 방법을 제공합니다:
- HTML 마커 – 기존 DOM 요소를 사용해 포인트를 렌더링합니다. HTML 표식은 끌기를 지원합니다.
- 심벌 레이어 – WebGL 컨텍스트 내에서 아이콘 또는 텍스트를 사용해 포인트를 렌더링합니다.
- 버블 레이어 – 포인트를 맵 상의 원으로 렌더링합니다. 원 반지름은 데이터의 속성에 따라 조정할 수 있습니다.
심벌 레이어와 버블 레이어는 WebGL 컨텍스트 내에서 렌더링됩니다. 두 레이어 모두 대규모 포인트 세트를 맵에 렌더링할 수 있습니다. 이러한 레이어에는 데이터가 데이터 소스에 저장되어 있어야 합니다. 데이터 소스와 렌더링 레이어는 ready 이벤트가 발생한 후에 맵에 추가해야 합니다. HTML 마커는 페이지 내 DOM 요소로 렌더링되며, 데이터 소스를 사용하지 않습니다. 페이지에 DOM 요소가 많을수록 페이지 속도는 느려집니다. 맵에 수백 개 이상의 포인트를 렌더링하는 경우, 렌더링 레이어 중 하나를 사용하는 것이 좋습니다.
맵에 숫자 10을 레이블로 오버레이한 마커를 추가해 보겠습니다. 경도 -0.2, 위도 51.5를 사용하세요.
이전: Google Maps
Google Maps에서는 google.maps.Marker 클래스를 사용해 맵에 마커를 추가하고, 옵션 중 하나로 맵을 지정합니다.
//Create a marker and add it to the map.
var marker = new google.maps.Marker({
    position: new google.maps.LatLng(51.5, -0.2),
    label: '10',
    map: map
});
이후: HTML 마커를 사용하는 Azure Maps
Azure Maps에서는 HTML 마커를 사용해 맵에 포인트를 표시합니다. HTML 마커는 소수의 포인트만 표시하면 되는 앱에 권장됩니다. HTML 표식을 사용하려면 atlas.HtmlMarker 클래스 인스턴스를 만듭니다. 텍스트와 위치 옵션을 설정한 다음 map.markers.add 메서드를 사용해 맵에 마커를 추가하세요.
//Create a HTML marker and add it to the map.
map.markers.add(new atlas.HtmlMarker({
    text: '10',
    position: [-0.2, 51.5]
}));

이후: 심벌 레이어를 사용하는 Azure Maps
기호 레이어의 경우, 데이터 원본에 데이터를 추가합니다. 데이터 소스를 레이어에 연결하세요. 또한 데이터 소스와 레이어는 ready 이벤트가 발생한 후에 맵에 추가해야 합니다. 고유한 텍스트 값을 심벌 위에 렌더링하려면, 텍스트 정보를 데이터 포인트의 속성으로 저장해야 합니다. 해당 속성은 레이어의 textField 옵션에서 참조되어야 합니다. 이 접근 방식은 HTML 마커를 사용하는 것보다 작업이 조금 더 많지만, 성능 측면에서는 더 좋습니다.
<!DOCTYPE html>
<html>
<head>
    <title></title>
    <meta charset="utf-8" />
    <meta http-equiv="x-ua-compatible" content="IE=Edge" />
    <meta name="viewport" content="width=device-width, initial-scale=1, shrink-to-fit=no" />

    <!-- Add references to the Azure Maps Map control JavaScript and CSS files. -->
    <link rel="stylesheet" href="https://atlas.microsoft.com/sdk/javascript/mapcontrol/3/atlas.min.css" type="text/css" />
    <script src="https://atlas.microsoft.com/sdk/javascript/mapcontrol/3/atlas.min.js"></script>

    <script type='text/javascript'>
        var map, datasource;

        function initMap() {
            map = new atlas.Map('myMap', {
                center: [-0.2, 51.5],
                zoom: 9,

                authOptions: {
                    authType: 'subscriptionKey',
                    subscriptionKey: '<Your Azure Maps Key>'
                }
            });

            //Wait until the map resources are ready.
            map.events.add('ready', function () {

                //Create a data source and add it to the map.
                datasource = new atlas.source.DataSource();
                map.sources.add(datasource);

                //Create a point feature, add a property to store a label for it, and add it to the data source.
                datasource.add(new atlas.data.Feature(new atlas.data.Point([-0.2, 51.5]), {
                    label: '10'
                }));

                //Add a layer for rendering point data as symbols.
                map.layers.add(new atlas.layer.SymbolLayer(datasource, null, {
                    textOptions: {
                        //Use the label property to populate the text for the symbols.
                        textField: ['get', 'label'],
                        color: 'white',
                        offset: [0, -1]
                    }
                }));
            });
        }
    </script>
</head>
<body onload="initMap()">
    <div id='myMap' style='position:relative;width:600px;height:400px;'></div>
</body>
</html>

추가 리소스:
- 데이터 소스 만들기
- 심벌 레이어 추가
- 버블 레이어 추가
- Web SDK에서 포인트 데이터 클러스터링
- HTML 마커 추가
- 데이터 기반 스타일 표현식 사용
- 심벌 레이어 아이콘 옵션
- 심벌 레이어 텍스트 옵션
- HTML 마커 클래스
- HTML 마커 옵션
사용자 지정 표식 추가
사용자 지정 이미지를 사용해 맵의 포인트를 표시할 수 있습니다. 다음 맵은 사용자 지정 이미지를 사용해 포인트를 표시합니다. 포인트는 위도 51.5, 경도 -0.2에 표시됩니다. 앵커는 마커 위치를 보정해, 압정 아이콘의 끝부분이 맵의 올바른 위치와 정렬되도록 합니다.

yellow-pushpin.png
이전: Google Maps
Icon 개체를 지정해 사용자 지정 마커를 만들고, 여기에 이미지에 대한 url을(를) 포함시킵니다. 압정 이미지의 끝이 맵 좌표와 정렬되도록 anchor 포인트를 지정하세요. Google Maps에서 앵커 값은 이미지의 왼쪽 위 모서리를 기준으로 합니다.
var marker = new google.maps.Marker({
    position: new google.maps.LatLng(51.5, -0.2),
    icon: {
        url: 'https://samples.azuremaps.com/images/icons/ylw-pushpin.png',
        anchor: new google.maps.Point(5, 30)
    },
    map: map
});
이후: HTML 마커를 사용하는 Azure Maps
HTML 마커를 사용자 지정하려면, HTML string 또는 HTMLElement을(를) 마커의 htmlContent 옵션에 전달하세요. 마커의 상대적 위치를 지정하려면 anchor 옵션을 사용해, 위치 좌표에 대한 마커의 상대 위치를 지정하세요. 정의된 참조 지점 9개 중 하나를 anchor 옵션에 할당합니다. 해당 포인트는 "가운데", "위쪽", "아래쪽", "왼쪽", "오른쪽", "왼쪽 위", "오른쪽 위", "왼쪽 아래", "오른쪽 아래"입니다. 콘텐츠는 기본적으로 html 콘텐츠의 하단 가운데에 고정됩니다. Google Maps에서 코드를 더 쉽게 마이그레이션하기 위해, anchor을(를) "왼쪽 위"로 설정한 다음 Google Maps에서 사용하던 것과 동일한 오프셋 값으로 pixelOffset 옵션을 사용하세요. Azure Maps에서 오프셋은 Google Maps의 오프셋과 반대 방향으로 이동합니다. 따라서 오프셋에 -1을 곱합니다
팁
Microsoft Edge에서 기본 끌기 동작을 사용하지 않도록 설정해 원치 않는 아이콘이 표시되지 않도록 하려면, HTML 콘텐츠에 스타일로 pointer-events:none을(를) 추가하세요.
map.markers.add(new atlas.HtmlMarker({
    htmlContent: '<img src="https://samples.azuremaps.com/images/icons/ylw-pushpin.png" style="pointer-events: none;" />',
    anchor: 'top-left',
    pixelOffset: [-5, -30],
    position: [-0.2, 51.5]
}));

이후: 심벌 레이어를 사용하는 Azure Maps
Azure Maps의 기호 레이어는 사용자 지정 이미지도 지원합니다. 먼저 이미지를 맵 리소스로 로드하고 고유한 ID를 할당하세요. 심벌 레이어에서 이미지를 참조하세요. 이미지가 맵에서 올바른 포인트와 정렬되도록 offset 옵션을 사용하세요.
anchor 옵션을 사용하여 위치 좌표를 기준으로 기호의 상대적 위치를 지정합니다. 아홉 개의 정의된 기준 포인트 중 하나를 사용하세요. 해당 지점은 "가운데", "위쪽", "아래쪽", "왼쪽", "오른쪽", "왼쪽 위", "오른쪽 위", "왼쪽 아래", "오른쪽 아래"입니다. 콘텐츠는 기본적으로 html 콘텐츠의 하단 가운데에 고정됩니다. Google Maps에서 코드를 더 쉽게 마이그레이션하기 위해, anchor을(를) "왼쪽 위"로 설정한 다음 Google Maps에서 사용하던 것과 동일한 오프셋 값으로 offset 옵션을 사용하세요. Azure Maps에서 오프셋은 Google Maps의 오프셋과 반대 방향으로 이동합니다. 따라서 오프셋에 -1을 곱합니다
<!DOCTYPE html>
<html>
<head>
    <title></title>
    <meta charset="utf-8" />
    <meta http-equiv="x-ua-compatible" content="IE=Edge" />
    <meta name="viewport" content="width=device-width, initial-scale=1, shrink-to-fit=no" />

    <!-- Add references to the Azure Maps Map control JavaScript and CSS files. -->
    <link rel="stylesheet" href="https://atlas.microsoft.com/sdk/javascript/mapcontrol/3/atlas.min.css" type="text/css" />
    <script src="https://atlas.microsoft.com/sdk/javascript/mapcontrol/3/atlas.min.js"></script>

    <script type='text/javascript'>
        var map, datasource;

        function initMap() {
            map = new atlas.Map('myMap', {
                center: [-0.2, 51.5],
                zoom: 9,
                authOptions: {
                    authType: 'subscriptionKey',
                    subscriptionKey: '<Your Azure Maps Key>'
                }
            });

            //Wait until the map resources are ready.
            map.events.add('ready', function () {

                //Load the custom image icon into the map resources.
                map.imageSprite.add('my-yellow-pin', 'https://samples.azuremaps.com/images/icons/ylw-pushpin.png').then(function () {

                    //Create a data source and add it to the map.
                    datasource = new atlas.source.DataSource();
                    map.sources.add(datasource);

                    //Create a point and add it to the data source.
                    datasource.add(new atlas.data.Point([-0.2, 51.5]));

                    //Add a layer for rendering point data as symbols.
                    map.layers.add(new atlas.layer.SymbolLayer(datasource, null, {
                        iconOptions: {
                            //Set the image option to the id of the custom icon that was loaded into the map resources.
                            image: 'my-yellow-pin',
                            anchor: 'top-left',
                            offset: [-5, -30]
                        }
                    }));
                });
            });
        }
    </script>
</head>
<body onload="initMap()">
    <div id='myMap' style='position:relative;width:600px;height:400px;'></div>
</body>
</html>
![]()
팁
고급 사용자 지정 포인트를 렌더링하려면 여러 렌더링 레이어를 함께 사용하세요. 예를 들어 서로 다른 색이 지정된 원에 동일한 아이콘이 있는 여러 개의 압정을 사용하려고 한다고 가정해 보겠습니다. 각 색상 오버레이에 대해 여러 이미지를 만드는 대신, 버블 레이어 위에 심벌 레이어를 추가하세요. 압정이 동일한 데이터 소스를 참조하도록 하세요. 이 접근 방식은 여러 종류의 이미지를 만들고 유지 관리하는 것보다 더 효율적입니다.
추가 리소스:
- 데이터 소스 만들기
- 심벌 레이어 추가
- HTML 마커 추가
- 데이터 기반 스타일 표현식 사용
- 심벌 레이어 아이콘 옵션
- 심벌 레이어 텍스트 옵션
- HTML 마커 클래스
- HTML 마커 옵션
폴리라인 추가
폴리라인을 사용하여 맵에서 선 또는 경로를 나타냅니다. 맵에 점선 폴리라인을 만들어 보겠습니다.
이전: Google Maps
폴리라인 클래스는 일련의 옵션을 허용합니다. 폴리라인의 path 옵션에 좌표 배열을 전달하세요.
//Get the center of the map.
var center = map.getCenter();

//Define a symbol using SVG path notation, with an opacity of 1.
var lineSymbol = {
    path: 'M 0,-1 0,1',
    strokeOpacity: 1,
    scale: 4
};

//Create the polyline.
var line = new google.maps.Polyline({
    path: [
        center,
        new google.maps.LatLng(center.lat() - 0.5, center.lng() - 1),
        new google.maps.LatLng(center.lat() - 0.5, center.lng() + 1)
    ],
    strokeColor: 'red',
    strokeOpacity: 0,
    strokeWeight: 4,
    icons: [{
        icon: lineSymbol,
        offset: '0',
        repeat: '20px'
    }]
});

//Add the polyline to the map.
line.setMap(map);
이후: Azure Maps
폴리라인은 LineString 또는 MultiLineString 개체라고 합니다. 이러한 개체는 데이터 소스에 추가하고 라인 레이어를 사용해 렌더링할 수 있습니다.
LineString을(를) 데이터 소스에 추가한 다음, 해당 데이터 소스를 LineLayer에 추가해 렌더링하세요.
//Get the center of the map.
var center = map.getCamera().center;

//Create a data source and add it to the map.
var datasource = new atlas.source.DataSource();
map.sources.add(datasource);

//Create a line and add it to the data source.
datasource.add(new atlas.data.LineString([
    center,
    [center[0] - 1, center[1] - 0.5],
    [center[0] + 1, center[1] - 0.5]
]));

//Add a layer for rendering line data.
map.layers.add(new atlas.layer.LineLayer(datasource, null, {
    strokeColor: 'red',
    strokeWidth: 4,
    strokeDashArray: [3, 3]
}));

추가 리소스:
폴리곤 추가
Azure Maps와 Google Maps는 폴리곤에 대해 비슷한 지원을 제공합니다. 폴리곤은 맵에서 영역을 나타내는 데 사용됩니다. 다음 예제에서는 맵 중심 좌표를 기준으로 삼각형을 구성하는 폴리곤을 만드는 방법을 보여 줍니다.
이전: Google Maps
폴리곤 클래스는 일련의 옵션을 허용합니다. 좌표 배열을 다각형의 paths 옵션에 전달합니다.
//Get the center of the map.
var center = map.getCenter();

//Create a polygon.
var polygon = new google.maps.Polygon({
    paths: [
        center,
        new google.maps.LatLng(center.lat() - 0.5, center.lng() - 1),
        new google.maps.LatLng(center.lat() - 0.5, center.lng() + 1),
        center
    ],
    strokeColor: 'red',
    strokeWeight: 2,
    fillColor: 'rgba(0, 255, 0, 0.5)'
});

//Add the polygon to the map
polygon.setMap(map);
이후: Azure Maps
Polygon 또는 MultiPolygon 개체를 데이터 소스에 추가하세요. 레이어를 사용해 개체를 맵에 렌더링하세요. 다각형 계층을 사용하여 다각형 영역을 렌더링합니다. 그리고, 선 계층을 사용하여 다각형의 윤곽선을 렌더링합니다.
//Get the center of the map.
var center = map.getCamera().center;

//Create a data source and add it to the map.
datasource = new atlas.source.DataSource();
map.sources.add(datasource);

//Create a polygon and add it to the data source.
datasource.add(new atlas.data.Polygon([
    center,
    [center[0] - 1, center[1] - 0.5],
    [center[0] + 1, center[1] - 0.5],
    center
]));

//Add a polygon layer for rendering the polygon area.
map.layers.add(new atlas.layer.PolygonLayer(datasource, null, {
    fillColor: 'rgba(0, 255, 0, 0.5)'
}));

//Add a line layer for rendering the polygon outline.
map.layers.add(new atlas.layer.LineLayer(datasource, null, {
    strokeColor: 'red',
    strokeWidth: 2
}));
추가 리소스:
정보 창 표시
엔터티에 대한 추가 정보를 Google Maps에서는 google.maps.InfoWindow 클래스 형태로 맵에 표시할 수 있습니다. Azure Maps에서는 이 기능을 atlas.Popup 클래스 사용으로 구현할 수 있습니다. 다음 예제에서는 맵에 마커를 추가합니다. 마커를 클릭하면 정보 창 또는 팝업이 표시됩니다.
이전: Google Maps
google.maps.InfoWindow 생성자를 사용해 정보 창 인스턴스를 만듭니다.
<!-- Google Maps Script Reference -->
<script async src="https://maps.googleapis.com/maps/api/js?callback=initMap&key={Your-Google-Maps-Key}&loading=async"></script>

<script type='text/javascript'>

    async function initMap() {
        // Request needed libraries.
        const { Map, InfoWindow } = await google.maps.importLibrary("maps");
        const { AdvancedMarkerElement, PinElement } = await google.maps.importLibrary("marker",);

        const map = new Map(document.getElementById("myMap"), {
            zoom: 12,
            center: { lat: 47.608458, lng: -122.335077 },
            disableDefaultUI: true,
            mapId: "4504f8b37365c3d0",
        });

        // Create an info window to share between markers.
        const infoWindow = new InfoWindow();

        // Create the marker.
        const pin = new PinElement();
        const marker = new AdvancedMarkerElement({
            position: { lat: 47.608458, lng: -122.335077 },
            map,
            title: "<B>Hello World!</B>",
            content: pin.element,
            gmpClickable: true,
        });

        // Add a click listener for each marker, and set up the info window.
        marker.addListener("click", ({ domEvent, latLng }) => {
            const { target } = domEvent;
            infoWindow.close();
            infoWindow.setContent(marker.title);
            infoWindow.open(marker.map, marker);
        });
    }
</script>
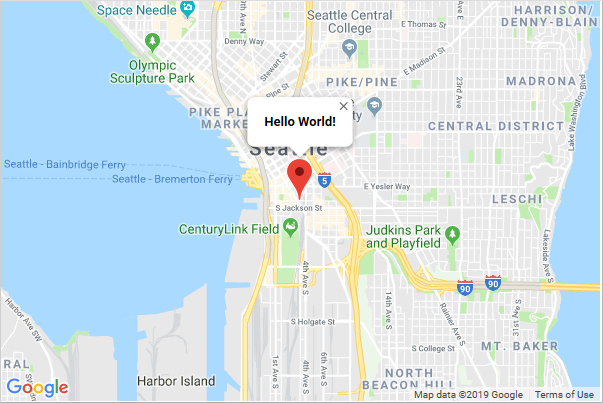
이후: Azure Maps
이제 팝업을 사용해 위치에 대한 추가 정보를 표시해 보겠습니다. HTML string 또는 HTMLElement 개체를 팝업의 content 옵션에 전달합니다. 원하는 경우 모양에 관계없이 팝업을 표시할 수 있습니다. 따라서 팝업에는 position 값을 지정해야 합니다.
position 값을 지정합니다. 팝업을 표시하려면 open 메서드를 호출하고, 팝업을 표시할 map을(를) 전달하세요.
//Add a marker to the map in which to display a popup for.
var marker = new atlas.HtmlMarker({
    position: [-122.33, 47.6]
});

//Add the marker to the map.
map.markers.add(marker);

//Create a popup.
var popup = new atlas.Popup({
    content: '<div style="padding:5px"><b>Hello World!</b></div>',
    position: [-122.33, 47.6],
    pixelOffset: [0, -35]
});

//Add a click event to the marker to open the popup.
map.events.add('click', marker, function () {
    //Open the popup
    popup.open(map);
});

참고
마커 대신 선택한 레이어를 맵 이벤트 코드에 전달하면, 심벌, 버블, 선 또는 폴리곤 레이어로도 동일한 작업을 수행할 수 있습니다.
추가 리소스:
GeoJSON 파일 가져오기
Google Maps는 google.maps.Data 클래스를 통해 GeoJSON 데이터를 로드하고 동적으로 스타일링할 수 있습니다. 이 클래스의 기능은 Azure Maps의 데이터 기반 스타일링과 더 잘 일치합니다. 하지만 중요한 차이가 있습니다. Google Maps에서는 콜백 함수를 지정합니다. 각 기능에 대한 스타일링 비즈니스 논리는 UI 스레드에서 개별적으로 처리됩니다. 반면 Azure Maps에서는 레이어에서 스타일 옵션으로 데이터 기반 표현식을 지정하는 방식을 지원합니다. 이러한 표현식은 렌더링 시점에 별도 스레드에서 처리됩니다. Azure Maps 방식은 렌더링 성능을 향상시킵니다. 이 장점은 더 큰 데이터 세트를 빠르게 렌더링해야 할 때 눈에 띕니다.
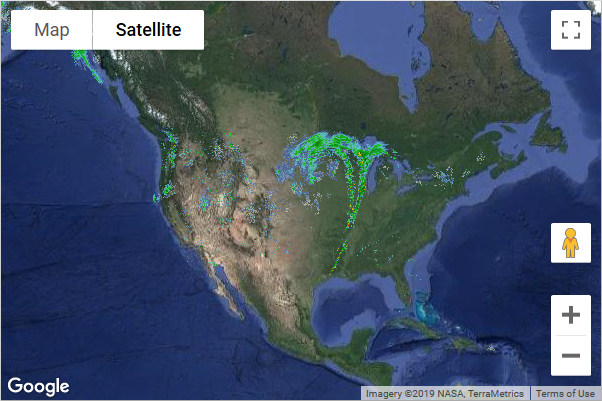
다음 예제에서는 USGS에서 지난 7일 동안 발생한 모든 지진에 대한 GeoJSON 피드를 로드합니다. 지진 데이터는 맵에서 크기가 조정된 원으로 렌더링됩니다. 각 원의 색과 배율은 각 지진의 크기를 기반으로 하며, 데이터 세트에 있는 각 기능의 "mag" 속성에 저장됩니다. 규모가 5 이상이면 원은 빨간색입니다. 규모가 3 이상 5 미만이면 원은 주황색입니다. 규모가 3 미만이면 원은 녹색입니다. 각 원의 반지름은 규모에 0.1을 곱한 값의 지수입니다.
이전: Google Maps
map.data.setStyle 메서드에서 단일 콜백 함수를 지정하세요. 콜백 함수 안에서 각 기능에 대해 비즈니스 논리를 적용합니다.
map.data.loadGeoJson 메서드를 사용해 GeoJSON 피드를 로드합니다.
<!DOCTYPE html>
<html>
<head>
    <title></title>
    <meta charset="utf-8" />
    <meta http-equiv="x-ua-compatible" content="IE=Edge" />
    <meta name="viewport" content="width=device-width, initial-scale=1, shrink-to-fit=no" />

    <script type='text/javascript'>
        var map;
        var earthquakeFeed = 'https://earthquake.usgs.gov/earthquakes/feed/v1.0/summary/all_week.geojson';

        function initMap() {
            map = new google.maps.Map(document.getElementById('myMap'), {
                center: new google.maps.LatLng(20, -160),
                zoom: 2
            });

            //Define a callback to style each feature.
            map.data.setStyle(function (feature) {

                //Extract the 'mag' property from the feature.
                var mag = parseFloat(feature.getProperty('mag'));

                //Set the color value to 'green' by default.
                var color = 'green';

                //If the mag value is greater than 5, set the color to 'red'.
                if (mag >= 5) {
                    color = 'red';
                }
                //If the mag value is greater than 3, set the color to 'orange'.
                else if (mag >= 3) {
                    color = 'orange';
                }

                return /** @type {google.maps.Data.StyleOptions} */({
                    icon: {
                        path: google.maps.SymbolPath.CIRCLE,

                        //Scale the radius based on an exponential of the 'mag' value.
                        scale: Math.exp(mag) * 0.1,
                        fillColor: color,
                        fillOpacity: 0.75,
                        strokeWeight: 2,
                        strokeColor: 'white'
                    }
                });
            });

            //Load the data feed.
            map.data.loadGeoJson(earthquakeFeed);
        }
    </script>

    <!-- Google Maps Script Reference -->
    <script src="https://maps.googleapis.com/maps/api/js?callback=initMap&key={Your-Google-Maps-Key}" async defer></script>
</head>
<body>
    <div id='myMap' style='position:relative;width:600px;height:400px;'></div>
</body>
</html>
이후: Azure Maps
Azure Maps에서 GeoJSON은 기본 데이터 형식입니다.
datasource.importFromUrl 메서드를 사용하여 데이터 원본으로 가져옵니다. 거품형 레이어를 사용합니다. 버블 레이어는 데이터 소스의 기능 속성에 따라 크기가 조정된 원을 렌더링하는 기능을 제공합니다. 콜백 함수를 포함하는 대신, 비즈니스 논리가 식으로 변환되어 스타일 옵션에 전달됩니다. 표현식은 비즈니스 논리가 작동하는 방식을 정의합니다. 식은 다른 스레드에 전달되고 기능 데이터와 비교하여 평가할 수 있습니다. Azure Maps에는 서로 다른 비즈니스 논리를 가진 여러 데이터 소스와 레이어를 추가할 수 있습니다. 이 기능을 사용하면 여러 데이터 세트를 서로 다른 방식으로 맵에 렌더링할 수 있습니다.
<!DOCTYPE html>
<html>
<head>
    <title></title>
    <meta charset="utf-8" />
    <meta http-equiv="x-ua-compatible" content="IE=Edge" />
    <meta name="viewport" content="width=device-width, initial-scale=1, shrink-to-fit=no" />

    <!-- Add references to the Azure Maps Map control JavaScript and CSS files. -->
    <link rel="stylesheet" href="https://atlas.microsoft.com/sdk/javascript/mapcontrol/3/atlas.min.css" type="text/css" />
    <script src="https://atlas.microsoft.com/sdk/javascript/mapcontrol/3/atlas.min.js"></script>

    <script type='text/javascript'>
        var map;
        var earthquakeFeed = 'https://earthquake.usgs.gov/earthquakes/feed/v1.0/summary/all_week.geojson';

        function initMap() {
            //Initialize a map instance.
            map = new atlas.Map('myMap', {
                center: [-160, 20],
                zoom: 1,

                //Add your Azure Maps subscription key to the map SDK. Get an Azure Maps key at https://azure.com/maps
                authOptions: {
                    authType: 'subscriptionKey',
                    subscriptionKey: '<Your Azure Maps Key>'
                }
            });

            //Wait until the map resources are ready.
            map.events.add('ready', function () {

                //Create a data source and add it to the map.
                datasource = new atlas.source.DataSource();
                map.sources.add(datasource);

                //Load the earthquake data.
                datasource.importDataFromUrl(earthquakeFeed);

                //Create a layer to render the data points as scaled circles.
                map.layers.add(new atlas.layer.BubbleLayer(datasource, null, {
                    //Make the circles semi-transparent.
                    opacity: 0.75,

                    color: [
                        'case',

                        //If the mag value is greater than 5, return 'red'.
                        ['>=', ['get', 'mag'], 5],
                        'red',

                        //If the mag value is greater than 3, return 'orange'.
                        ['>=', ['get', 'mag'], 3],
                        'orange',

                        //Return 'green' as a fallback.
                        'green'
                    ],

                    //Scale the radius based on an exponential of the 'mag' value.
                    radius: ['*', ['^', ['e'], ['get', 'mag']], 0.1]
                }));
            });
        }
    </script>
</head>
<body onload="initMap()">
    <div id='myMap' style='position:relative;width:600px;height:400px;'></div>
</body>
</html>

추가 리소스:
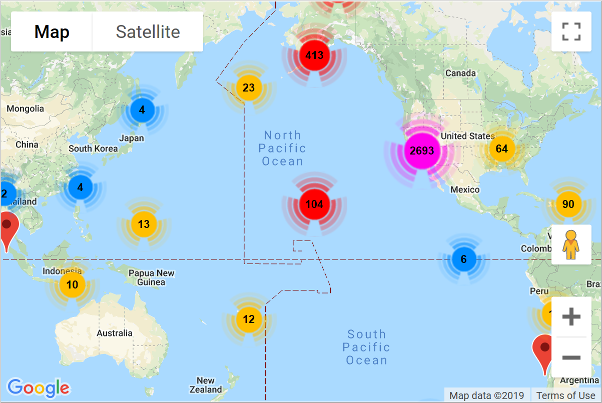
표식 클러스터링
맵에 많은 데이터 포인트가 표시되면 포인트가 서로 겹쳐, 맵을 읽고 사용하기 어려운 복잡한 상태가 될 수 있습니다. 포인트 데이터 클러스터링은 서로 가까이 있는 데이터 포인트를 결합해, 맵에 단일 클러스터 포인트로 표시하는 과정입니다. 사용자가 맵을 확대하면 클러스터가 개별 데이터 포인트로 분리됩니다. 데이터 포인트를 클러스터링하면 사용자 경험과 맵 성능이 향상됩니다.
다음 예제에서는 지난 일주일 동안의 지진 GeoJSON 피드를 로드해 맵에 추가합니다. 클러스터는 크기가 조정되고 색이 지정된 원으로 렌더링됩니다. 원 크기와 색은 클러스터에 포함된 포인트 수에 따라 달라집니다.
참고
Google Maps와 Azure Maps는 약간 다른 클러스터링 알고리즘을 사용합니다. 따라서 때때로 클러스터의 지점 배포가 달라질 수 있습니다.
이전: Google Maps
MarkerCluster 라이브러리를 사용해 마커를 클러스터링하세요. 클러스터 아이콘은 이름이 1부터 5까지의 숫자인 이미지로 제한됩니다. 이 이미지는 모두 동일한 디렉터리에 호스트됩니다.
<!DOCTYPE html>
<html>
<head>
    <title></title>
    <meta charset="utf-8" />
    <meta http-equiv="x-ua-compatible" content="IE=Edge" />
    <meta name="viewport" content="width=device-width, initial-scale=1, shrink-to-fit=no" />

    <script type='text/javascript'>
        var earthquakeFeed = 'https://earthquake.usgs.gov/earthquakes/feed/v1.0/summary/all_week.geojson';

        async function initMap() {
            const AdvancedMarkerElement = await google.maps.importLibrary("marker");
            const map = new google.maps.Map(document.getElementById('myMap'), {
                center: new google.maps.LatLng(20, -160),
                zoom: 2,
                mapId: "DEMO_MAP_ID", // Map ID is required for advanced markers.
            });

            //Download the GeoJSON data.
            fetch(earthquakeFeed)
                .then(function (response) {
                    return response.json();
                }).then(function (data) {

                    //Loop through the GeoJSON data and create a marker for each data point.
                    var markers = [];
                    for (var i = 0; i < data.features.length; i++) {
                        markers.push(new google.maps.marker.AdvancedMarkerElement({
                            position: new google.maps.LatLng(data.features[i].geometry.coordinates[1], data.features[i].geometry.coordinates[0])
                        }));
                    }

                    //Create a marker clusterer instance and tell it where to find the cluster icons.
                    var markerCluster = new markerClusterer.MarkerClusterer({map, markers});
                });
        }
    </script>

    <!-- Load the marker cluster library. -->
    <script src="https://unpkg.com/@googlemaps/markerclusterer/dist/index.min.js"></script>

    <!-- Google Maps Script Reference -->
    <script src="https://maps.googleapis.com/maps/api/js?callback=initMap&key={Your-Google-Maps-Key}&loading=async"></script>
</head>
<body>
    <div id='myMap' style='position:relative;width:600px;height:400px;'></div>
</body>
</html>
이후: Azure Maps
데이터 소스에 데이터를 추가 및 관리하세요. 데이터 소스와 레이어를 연결한 다음 데이터를 렌더링하세요. Azure Maps의 DataSource 클래스는 여러 클러스터링 옵션을 제공합니다.
-
cluster– 데이터 소스에 포인트 데이터 클러스터링을 사용하도록 지시합니다. -
clusterRadius- 포인트를 함께 클러스터링할 픽셀 단위 반경입니다. -
clusterMaxZoom- 클러스터링이 발생하는 최대 줌 레벨입니다. 이 수준보다 더 크게 확대하면 모든 지점이 기호로 렌더링됩니다. -
clusterProperties- 각 클러스터 내 모든 포인트에 대해 표현식을 사용해 계산되는 사용자 지정 속성을 정의하며, 이 속성은 각 클러스터 포인트의 속성에 추가됩니다.
클러스터링이 활성화되면 데이터 소스는 클러스터링된 포인트와 클러스터링되지 않은 포인트를 모두 레이어로 전송해 렌더링합니다. 데이터 소스는 수십만 개의 데이터 포인트를 클러스터링할 수 있습니다. 클러스터링된 데이터 포인트에는 다음 속성이 있습니다:
| Property name | Type | 설명 |
|---|---|---|
cluster |
boolean | 해당 기능가 클러스터를 나타내는지 여부. |
cluster_id |
문자열 | DataSource의 getClusterExpansionZoom, getClusterChildren, getClusterLeaves 메서드와 함께 사용할 수 있는 클러스터의 고유 ID. |
point_count |
숫자 | 클러스터에 포함된 포인트 수. |
point_count_abbreviated |
문자열 | 길이가 긴 경우 point_count 값을 줄여서 표시하는 문자열입니다. (예: 4,000은 4K가 됨) |
DataSource 클래스에는 cluster_id를 사용하여 클러스터에 대한 추가 정보에 액세스하는 다음과 같은 도우미 함수가 있습니다.
| 방법 | 반환 형식 | 설명 |
|---|---|---|
getClusterChildren(clusterId: number) |
Promise<Array<Feature<Geometry, any> | Shape>> | 다음 줌 레벨에서 지정된 클러스터의 자식 요소를 검색합니다. 이 자식 요소는 도형과 하위 클러스터의 조합일 수 있습니다. 하위 클러스터는 ClusteredProperties와 일치하는 속성을 가진 기능입니다. |
getClusterExpansionZoom(clusterId: number) |
Promise<number> | 클러스터가 확장되기 시작하거나 분리되는 줌 레벨을 계산합니다. |
getClusterLeaves(clusterId: number, limit: number, offset: number) |
Promise<Array<Feature<Geometry, any> | Shape>> | 클러스터 내 모든 포인트를 검색합니다.
limit을(를) 설정해 포인트의 하위 집합을 반환하고, offset을(를) 사용해 포인트를 페이지 단위로 조회하세요. |
맵에서 클러스터링된 데이터를 렌더링할 때는 일반적으로 두 개 이상의 레이어를 사용하는 것이 가장 좋습니다. 다음 예제에서는 세 가지 레이어를 사용합니다. 거품형 레이어에서 클러스터 크기에 따라 크기가 조정되고 색이 지정된 원을 그립니다. 기호 레이어에서 클러스터 크기를 텍스트로 렌더링합니다. 또한 클러스터링되지 않은 포인트를 렌더링하기 위해 두 번째 심벌 레이어를 사용합니다. 클러스터링된 데이터를 렌더링하는 다른 방법에 대한 자세한 내용은 Web SDK에서 포인트 데이터 클러스터링을 참조하세요.
Azure Maps 맵 내에서 DataSource 클래스의 importDataFromUrl 함수를 사용해 GeoJSON 데이터를 직접 가져오세요.
<!DOCTYPE html>
<html>
<head>
    <title></title>
    <meta charset="utf-8" />
    <meta http-equiv="x-ua-compatible" content="IE=Edge" />
    <meta name="viewport" content="width=device-width, initial-scale=1, shrink-to-fit=no" />

    <!-- Add references to the Azure Maps Map control JavaScript and CSS files. -->
    <link rel="stylesheet" href="https://atlas.microsoft.com/sdk/javascript/mapcontrol/3/atlas.min.css" type="text/css" />
    <script src="https://atlas.microsoft.com/sdk/javascript/mapcontrol/3/atlas.min.js"></script>

    <script type='text/javascript'>
        var map, datasource;
        var earthquakeFeed = 'https://earthquake.usgs.gov/earthquakes/feed/v1.0/summary/all_week.geojson';

        function initMap() {
            //Initialize a map instance.
            map = new atlas.Map('myMap', {
                center: [-160, 20],
                zoom: 1,

                //Add your Azure Maps subscription key to the map SDK. Get an Azure Maps key at https://azure.com/maps
                authOptions: {
                    authType: 'subscriptionKey',
                    subscriptionKey: '<Your Azure Maps Key>'
                }
            });

            //Wait until the map resources are ready.
            map.events.add('ready', function () {

                //Create a data source and add it to the map.
                datasource = new atlas.source.DataSource(null, {
                    //Tell the data source to cluster point data.
                    cluster: true
                });
                map.sources.add(datasource);

                //Create layers for rendering clusters, their counts and unclustered points and add the layers to the map.
                map.layers.add([
                    //Create a bubble layer for rendering clustered data points.
                    new atlas.layer.BubbleLayer(datasource, null, {
                        //Scale the size of the clustered bubble based on the number of points in the cluster.
                        radius: [
                            'step',
                            ['get', 'point_count'],
                            20,         //Default of 20 pixel radius.
                            100, 30,    //If point_count >= 100, radius is 30 pixels.
                            750, 40     //If point_count >= 750, radius is 40 pixels.
                        ],

                        //Change the color of the cluster based on the value on the point_cluster property of the cluster.
                        color: [
                            'step',
                            ['get', 'point_count'],
                            'lime',            //Default to lime green.
                            100, 'yellow',     //If the point_count >= 100, color is yellow.
                            750, 'red'         //If the point_count >= 750, color is red.
                        ],
                        strokeWidth: 0,
                        filter: ['has', 'point_count'] //Only rendered data points which have a point_count property, which clusters do.
                    }),

                    //Create a symbol layer to render the count of locations in a cluster.
                    new atlas.layer.SymbolLayer(datasource, null, {
                        iconOptions: {
                            image: 'none' //Hide the icon image.
                        },
                        textOptions: {
                            textField: ['get', 'point_count_abbreviated'],
                            offset: [0, 0.4]
                        }
                    }),

                    //Create a layer to render the individual locations.
                    new atlas.layer.SymbolLayer(datasource, null, {
                        filter: ['!', ['has', 'point_count']] //Filter out clustered points from this layer.
                    })
                ]);

                //Retrieve a GeoJSON data set and add it to the data source.
                datasource.importDataFromUrl(earthquakeFeed);
            });
        }
    </script>
</head>
<body onload="initMap()">
    <div id='myMap' style='position:relative;width:600px;height:400px;'></div>
</body>
</html>

추가 리소스:
히트 맵 추가
히트 맵(포인트 밀도 맵)은 데이터 시각화 유형입니다. 색 범위를 사용하여 데이터의 밀도를 나타내는 데 사용됩니다. 일반적으로 맵에서 데이터의 "핫스팟"을 보여 주는 데 사용됩니다. 히트 맵은 대규모 포인트 데이터 세트를 렌더링하는 훌륭한 방법입니다.
다음 예제에서는 지난 한 달 동안의 모든 지진에 대한 GeoJSON 피드를 USGS에서 로드해 가중치가 있는 히트 맵으로 렌더링합니다.
"mag" 속성은 가중치로 사용됩니다.
이전: Google Maps
히트 맵을 만들려면 API 스크립트 URL에 &libraries=visualization을(를) 추가해 "visualization(시각화)" 라이브러리를 로드하세요. Google Maps의 열 지도 계층은 GeoJSON 데이터를 직접 지원하지 않습니다. 먼저 데이터를 다운로드하여 가중치가 적용된 데이터 요소 배열로 변환합니다.
<!DOCTYPE html>
<html>
<head>
    <title></title>
    <meta charset="utf-8" />
    <meta http-equiv="x-ua-compatible" content="IE=Edge" />
    <meta name="viewport" content="width=device-width, initial-scale=1, shrink-to-fit=no" />

    <script type='text/javascript'>
        var map;
        var url = 'https://earthquake.usgs.gov/earthquakes/feed/v1.0/summary/all_month.geojson';

        function initMap() {

            var map = new google.maps.Map(document.getElementById('myMap'), {
                center: new google.maps.LatLng(20, -160),
                zoom: 2,
                mapTypeId: 'satellite'
            });

            //Download the GeoJSON data.
            fetch(url).then(function (response) {
                return response.json();
            }).then(function (res) {
                var points = getDataPoints(res);

                var heatmap = new google.maps.visualization.HeatmapLayer({
                    data: points
                });
                heatmap.setMap(map);
            });
        }

        function getDataPoints(geojson, weightProp) {
            var points = [];

            for (var i = 0; i < geojson.features.length; i++) {
                var f = geojson.features[i];

                if (f.geometry.type === 'Point') {
                    points.push({
                        location: new google.maps.LatLng(f.geometry.coordinates[1], f.geometry.coordinates[0]),
                        weight: f.properties[weightProp]
                    });
                }
            }

            return points;
        }
    </script>

    <!-- Google Maps Script Reference -->
    <script src="https://maps.googleapis.com/maps/api/js?callback=initMap&key={Your-Google-Maps-Key}&libraries=visualization" async defer></script>
</head>
<body>
    <div id='myMap' style='position:relative;width:600px;height:400px;'></div>
</body>
</html>
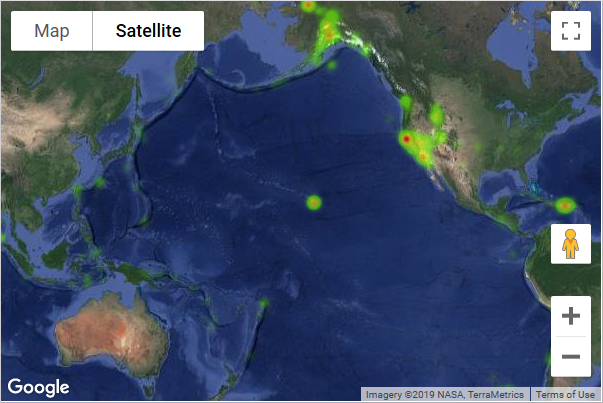
이후: Azure Maps
GeoJSON 데이터를 데이터 소스에 로드한 다음, 데이터 소스를 히트 맵 레이어에 연결하세요. 가중치에 사용되는 속성은 표현식을 사용해 weight 옵션에 전달할 수 있습니다. Azure Maps 맵에서 DataSource 클래스의 importDataFromUrl 함수를 사용해 GeoJSON 데이터를 직접 가져오세요.
<!DOCTYPE html>
<html>
<head>
    <title></title>
    <meta charset="utf-8" />
    <meta http-equiv="x-ua-compatible" content="IE=Edge" />
    <meta name="viewport" content="width=device-width, initial-scale=1, shrink-to-fit=no" />

    <!-- Add references to the Azure Maps Map control JavaScript and CSS files. -->
    <link rel="stylesheet" href="https://atlas.microsoft.com/sdk/javascript/mapcontrol/3/atlas.min.css" type="text/css" />
    <script src="https://atlas.microsoft.com/sdk/javascript/mapcontrol/3/atlas.min.js"></script>

    <script type='text/javascript'>
        var map;
        var earthquakeFeed = 'https://earthquake.usgs.gov/earthquakes/feed/v1.0/summary/all_month.geojson';

        function initMap() {
            //Initialize a map instance.
            map = new atlas.Map('myMap', {
                center: [-160, 20],
                zoom: 1,
                style: 'satellite',

                //Add your Azure Maps subscription key to the map SDK. Get an Azure Maps key at https://azure.com/maps
                authOptions: {
                    authType: 'subscriptionKey',
                    subscriptionKey: '<Your Azure Maps Key>'
                }
            });

            //Wait until the map resources are ready.
            map.events.add('ready', function () {

                //Create a data source and add it to the map.
                datasource = new atlas.source.DataSource();
                map.sources.add(datasource);

                //Load the earthquake data.
                datasource.importDataFromUrl(earthquakeFeed);

                //Create a layer to render the data points as a heat map.
                map.layers.add(new atlas.layer.HeatMapLayer(datasource, null, {
                    weight: ['get', 'mag'],
                    intensity: 0.005,
                    opacity: 0.65,
                    radius: 10
                }));
            });
        }
    </script>
</head>
<body onload="initMap()">
    <div id='myMap' style='position:relative;width:600px;height:400px;'></div>
</body>
</html>

추가 리소스:
타일 레이어 오버레이
Azure Maps의 타일 레이어는 Google Maps에서 이미지 오버레이로 알려져 있습니다. 타일 계층을 사용하면 작은 바둑판식 이미지로 분할된 큰 이미지를 오버레이할 수 있으며, 맵 바둑판식 배열 시스템에 맞춰집니다. 이 접근 방식은 대형 이미지나 대규모 데이터 세트를 오버레이하는 데 일반적으로 사용됩니다.
다음 예제에서는 아이오와 주립 대학교의 Iowa Environmental Mesonet에서 받은 날씨 레이더 타일 레이어를 오버레이합니다.
이전: Google Maps
Google Maps에서는 google.maps.ImageMapType 클래스를 사용해 타일 레이어를 만들 수 있습니다.
map.overlayMapTypes.insertAt(0, new google.maps.ImageMapType({
    getTileUrl: function (coord, zoom) {
        return "https://mesonet.agron.iastate.edu/cache/tile.py/1.0.0/nexrad-n0q-900913/" + zoom + "/" + coord.x + "/" + coord.y;
    },
    tileSize: new google.maps.Size(256, 256),
    opacity: 0.8
}));
이후: Azure Maps
다른 레이어와 마찬가지로 타일 계층을 맵에 추가합니다. x, y, 확대/축소 자리 표시자, {x}, {y}, {z}가 포함된 형식이 지정된 URL을 사용하여 타일에 액세스할 위치를 레이어에 알려줍니다. Azure Maps 타일 레이어는 {quadkey}, {bbox-epsg-3857}, {subdomain} 자리 표시자를 모두 지원합니다.
팁
Azure Maps에서는 베이스 맵 레이어를 포함한 다른 레이어 아래에 타일 레이어를 쉽게 렌더링할 수 있습니다. 일반적으로 타일 레이어를 맵 레이블 아래에 렌더링하면 레이블을 읽기 쉬워집니다.
map.layers.add 메서드는 두 번째 매개 변수를 받는데, 이 매개 변수는 새 레이어를 그 아래에 삽입할 레이어의 ID입니다. 타일 계층을 맵 레이블 아래에 삽입하려면 map.layers.add(myTileLayer, "labels"); 코드를 사용합니다.
//Create a tile layer and add it to the map below the label layer.
map.layers.add(new atlas.layer.TileLayer({
    tileUrl: 'https://mesonet.agron.iastate.edu/cache/tile.py/1.0.0/nexrad-n0q-900913/{z}/{x}/{y}.png',
    opacity: 0.8,
    tileSize: 256
}), 'labels');

팁
맵의 transformRequest 옵션을 사용해 타일 요청을 캡처할 수 있습니다. 이를 통해 요청에 헤더를 수정하거나 추가할 수 있습니다.
추가 리소스:
트래픽 데이터 표시
Azure와 Google Maps 모두에서 교통 데이터를 맵에 오버레이할 수 있습니다.
이전: Google Maps
트래픽 레이어를 사용하여 맵에 트래픽 데이터를 오버레이합니다.
var trafficLayer = new google.maps.TrafficLayer();
trafficLayer.setMap(map);
이후: Azure Maps
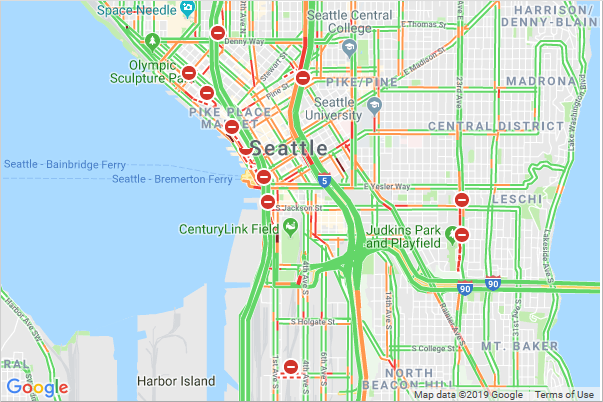
Azure Maps에서는 교통 데이터를 표시하기 위한 여러 옵션을 제공합니다. 도로 폐쇄 및 사고와 같은 교통 사고를 아이콘으로 맵에 표시할 수 있습니다. 맵에 교통 흐름과 색으로 구분된 도로를 오버레이할 수 있습니다. 게시된 속도 제한을 기반으로 또는 일반적인 예상 지연 시간 또는 절대 지연 시간을 기준으로 색을 수정할 수 있습니다. Azure Maps에서 사고 데이터는 매분 업데이트되며, 흐름 데이터는 2분마다 업데이트됩니다.
setTraffic 옵션에 원하는 값을 지정하세요.
map.setTraffic({
    incidents: true,
    flow: 'relative'
});

Azure Maps에서 교통 아이콘 중 하나를 선택하면, 팝업에 추가 정보가 표시됩니다.

추가 리소스:
그라운드 오버레이 추가
Azure와 Google Maps는 모두 지리 참조 이미지를 맵 위에 오버레이할 수 있습니다. 지리 참조 이미지는 맵을 이동하고 확대/축소할 때 함께 이동하고 크기가 조정됩니다. Google Maps에서는 이러한 지리 참조 이미지를 그라운드 오버레이라고 하며, Azure Maps에서는 이미지 레이어라고 합니다. 이 이미지는 실내 평면도 작성, 오래된 맵 오버레이, 드론 이미지 오버레이 등에 유용합니다.
이전: Google Maps
오버레이할 이미지의 URL과 이미지를 맵에 고정할 바운딩 박스를 지정하세요. 이 예제에서는 1922년 뉴저지주 뉴어크의 맵 이미지를 맵에 오버레이합니다.
<!DOCTYPE html>
<html>
<head>
    <title></title>
    <meta charset="utf-8" />
    <meta http-equiv="x-ua-compatible" content="IE=Edge" />
    <meta name="viewport" content="width=device-width, initial-scale=1, shrink-to-fit=no" />

    <script type='text/javascript'>
        var map, historicalOverlay;

        function initMap() {
            map = new google.maps.Map(document.getElementById('myMap'), {
                center: new google.maps.LatLng(40.740, -74.18),
                zoom: 12
            });

            var imageBounds = {
                north: 40.773941,
                south: 40.712216,
                east: -74.12544,
                west: -74.22655
            };

            historicalOverlay = new google.maps.GroundOverlay(
                'https://www.lib.utexas.edu/maps/historical/newark_nj_1922.jpg',
                imageBounds);
            historicalOverlay.setMap(map);
        }
    </script>

    <!-- Google Maps Script Reference -->
    <script src="https://maps.googleapis.com/maps/api/js?callback=initMap&key={Your-Google-Maps-Key}" async defer></script>
</head>
<body>
    <div id="myMap" style="position:relative;width:600px;height:400px;"></div>
</body>
</html>
이 코드를 브라우저에서 실행하면 다음 이미지와 같은 맵이 표시됩니다.

이후: Azure Maps
atlas.layer.ImageLayer 클래스를 사용하여 지리 좌표화된(georeferenced) 이미지를 오버레이합니다. 이 클래스에는 이미지 URL과 이미지 네 모서리에 대한 좌표 집합이 필요합니다. 동일한 도메인에 이미지를 호스팅하거나 COR을 사용하도록 설정해야 합니다.
팁
북쪽, 남쪽, 동쪽, 서쪽과 회전 정보만 있고 각 모서리에 대한 좌표가 없는 경우에는 정적 atlas.layer.ImageLayer.getCoordinatesFromEdges 메서드를 사용할 수 있습니다.
<!DOCTYPE html>
<html>
<head>
    <title></title>
    <meta charset="utf-8" />
    <meta http-equiv="x-ua-compatible" content="IE=Edge" />
    <meta name="viewport" content="width=device-width, initial-scale=1, shrink-to-fit=no" />

    <!-- Add references to the Azure Maps Map control JavaScript and CSS files. -->
    <link rel="stylesheet" href="https://atlas.microsoft.com/sdk/javascript/mapcontrol/3/atlas.min.css" type="text/css" />
    <script src="https://atlas.microsoft.com/sdk/javascript/mapcontrol/3/atlas.min.js"></script>

    <script type='text/javascript'>
        var map;

        function initMap() {
            //Initialize a map instance.
            map = new atlas.Map('myMap', {
                center: [-74.18, 40.740],
                zoom: 12,

                //Add your Azure Maps subscription key to the map SDK. Get an Azure Maps key at https://azure.com/maps
                authOptions: {
                    authType: 'subscriptionKey',
                    subscriptionKey: '<Your Azure Maps Key>'
                }
            });

            //Wait until the map resources are ready.
            map.events.add('ready', function () {

                //Create an image layer and add it to the map.
                map.layers.add(new atlas.layer.ImageLayer({
                    url: 'newark_nj_1922.jpg',
                    coordinates: [
                        [-74.22655, 40.773941], //Top Left Corner
                        [-74.12544, 40.773941], //Top Right Corner
                        [-74.12544, 40.712216], //Bottom Right Corner
                        [-74.22655, 40.712216]  //Bottom Left Corner
                    ]
                }));
            });
        }
    </script>
</head>
<body onload="initMap()">
    <div id='myMap' style='position:relative;width:600px;height:400px;'></div>
</body>
</html>

추가 리소스:
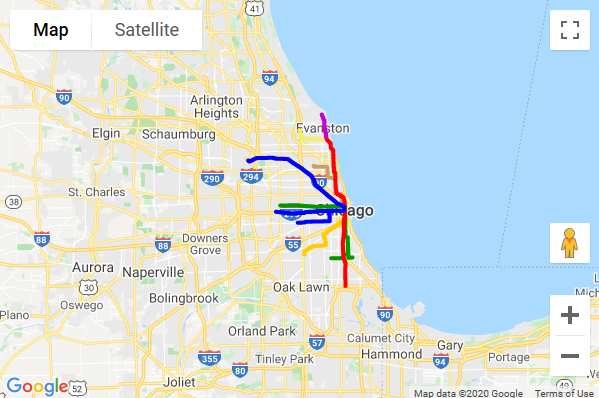
맵에 KML 데이터 추가
Azure와 Google Maps는 모두 KML, KMZ, GeoRSS 데이터를 맵에 가져와 렌더링할 수 있습니다. Azure Maps는 GPX, GML, 공간 CSV 파일, GeoJSON, WKT(Well Known Text), WMS(Web Mapping Services), WMTS(Web Mapping Tile Services) 및 WFS(Web Feature Services)도 지원합니다. Azure Maps는 파일을 로컬 메모리로 읽어 들이며, 대부분의 경우 더 큰 KML 파일도 처리할 수 있습니다.
이전: Google Maps
<!DOCTYPE html>
<html>
<head>
    <title></title>
    <meta charset="utf-8" />
    <meta http-equiv="x-ua-compatible" content="IE=Edge" />
    <meta name="viewport" content="width=device-width, initial-scale=1, shrink-to-fit=no" />

    <script type='text/javascript'>
        var map, historicalOverlay;

        function initMap() {
            map = new google.maps.Map(document.getElementById('myMap'), {
                center: new google.maps.LatLng(0, 0),
                zoom: 1
            });

             var layer = new google.maps.KmlLayer({
              url: 'https://googlearchive.github.io/js-v2-samples/ggeoxml/cta.kml',
              map: map
            });
        }
    </script>

    <!-- Google Maps Script Reference -->
    <script src="https://maps.googleapis.com/maps/api/js?callback=initMap&key={Your-Google-Maps-Key}" async defer></script>
</head>
<body>
    <div id="myMap" style="position:relative;width:600px;height:400px;"></div>
</body>
</html>
이 코드를 브라우저에서 실행하면 다음 이미지와 같은 맵이 표시됩니다.
이후: Azure Maps
Azure Maps에서 GeoJSON은 웹 SDK에서 사용되는 기본 데이터 형식으로, 공간 IO 모듈을 사용하여 더 많은 공간 데이터 형식을 쉽게 통합할 수 있습니다. 이 모듈에는 공간 데이터를 읽고 쓰는 기능이 있으며 이러한 공간 데이터 형식의 데이터를 쉽게 렌더링할 수 있는 간단한 데이터 계층도 포함되어 있습니다. 공간 데이터 파일의 데이터를 읽으려면 URL 또는 문자열 또는 Blob 형태의 원시 데이터를 atlas.io.read 함수에 전달하세요. 이 함수는 맵에 추가할 수 있는, 파싱된 모든 데이터를 반환합니다. KML은 스타일 정보가 훨씬 더 많이 포함되어 있기 때문에 대부분의 공간 데이터 형식보다 조금 더 복잡합니다.
SpatialDataLayer 클래스는 이러한 스타일 대부분을 지원하지만, 아이콘 이미지는 기능 데이터를 로드하기 전에 맵에 로드해야 하며, 그라운드 오버레이는 별도의 레이어로 맵에 추가해야 합니다. URL을 통해 데이터를 로드하는 경우 COR 지원 엔드포인트에 호스팅되거나 프록시 서비스가 읽기 함수에 옵션으로 전달되어야 합니다.
<!DOCTYPE html>
<html>
<head>
    <title></title>
    <meta charset="utf-8" />
    <meta http-equiv="x-ua-compatible" content="IE=Edge" />
    <meta name="viewport" content="width=device-width, initial-scale=1, shrink-to-fit=no" />

    <!-- Add references to the Azure Maps Map control JavaScript and CSS files. -->
    <link rel="stylesheet" href="https://atlas.microsoft.com/sdk/javascript/mapcontrol/3/atlas.min.css" type="text/css" />
    <script src="https://atlas.microsoft.com/sdk/javascript/mapcontrol/3/atlas.min.js"></script>

    <!-- Add reference to the Azure Maps Spatial IO module. -->
    <script src="https://atlas.microsoft.com/sdk/javascript/spatial/0/atlas-spatial.js"></script>

    <script type='text/javascript'>
        var map, datasource, layer;

        function initMap() {
            //Initialize a map instance.
            map = new atlas.Map('myMap', {
                view: 'Auto',

                //Add your Azure Maps subscription key to the map SDK. Get an Azure Maps key at https://azure.com/maps
                authOptions: {
                    authType: 'subscriptionKey',
                    subscriptionKey: '<Your Azure Maps Key>'
                }
            });

            //Wait until the map resources are ready.
            map.events.add('ready', function () {

                //Create a data source and add it to the map.
                datasource = new atlas.source.DataSource();
                map.sources.add(datasource);

                //Add a simple data layer for rendering the data.
                layer = new atlas.layer.SimpleDataLayer(datasource);
                map.layers.add(layer);

                //Read a KML file from a URL or pass in a raw KML string.
                atlas.io.read('https://googlearchive.github.io/js-v2-samples/ggeoxml/cta.kml').then(async r => {
                    if (r) {

                        //Check to see if there are any icons in the data set that need to be loaded into the map resources.
                        if (r.icons) {
                            //For each icon image, create a promise to add it to the map, then run the promises in parallel.
                            var imagePromises = [];

                            //The keys are the names of each icon image.
                            var keys = Object.keys(r.icons);

                            if (keys.length !== 0) {
                                keys.forEach(function (key) {
                                    imagePromises.push(map.imageSprite.add(key, r.icons[key]));
                                });

                                await Promise.all(imagePromises);
                            }
                        }

                        //Load all features.
                        if (r.features && r.features.length > 0) {
                            datasource.add(r.features);
                        }

                        //Load all ground overlays.
                        if (r.groundOverlays && r.groundOverlays.length > 0) {
                            map.layers.add(r.groundOverlays);
                        }

                        //If bounding box information is known for data, set the map view to it.
                        if (r.bbox) {
                            map.setCamera({ bounds: r.bbox, padding: 50 });
                        }
                    }
                });
            });
        }
    </script>
</head>
<body onload="initMap()">
    <div id='myMap' style='position:relative;width:600px;height:400px;'></div>
</body>
</html>

추가 리소스:
더 많은 코드 샘플
다음은 Google Maps 마이그레이션과 관련된 몇 가지 추가 코드 샘플입니다:
서비스:
- Azure Maps 서비스 모듈 사용
- 관심 지점 검색
- 좌표에서 정보 가져오기(역지오코딩)
- A 지점에서 B 지점까지 길찾기 표시
- jQuery UI를 사용하여 Autosuggest 검색
Google Maps v3와 Azure Maps 웹 SDK 클래스 매핑
다음 부록은 Google Maps v3에서 일반적으로 사용되는 클래스와 해당하는 Azure Maps Web SDK에 대한 상호 참조를 제공합니다.
핵심 클래스
| Google Maps | Azure Maps |
|---|---|
google.maps.Map |
atlas.Map |
google.maps.InfoWindow |
atlas.Popup |
google.maps.InfoWindowOptions |
atlas.PopupOptions |
google.maps.LatLng |
atlas.data.Position |
google.maps.LatLngBounds |
atlas.data.BoundingBox |
google.maps.MapOptions |
atlas.CameraOptions atlas.CameraBoundsOptions atlas.ServiceOptions atlas.StyleOptions atlas.UserInteractionOptions |
google.maps.Point |
atlas.Pixel |
오버레이 클래스
| Google Maps | Azure Maps |
|---|---|
google.maps.Marker |
atlas.HtmlMarker atlas.data.Point |
google.maps.MarkerOptions |
atlas.HtmlMarkerOptions atlas.layer.SymbolLayer atlas.SymbolLayerOptions atlas.IconOptions atlas.TextOptions atlas.layer.BubbleLayer atlas.BubbleLayerOptions |
google.maps.Polygon |
atlas.data.Polygon |
google.maps.PolygonOptions |
atlas.layer.PolygonLayer atlas.PolygonLayerOptions atlas.layer.LineLayer atlas.LineLayerOptions |
google.maps.Polyline |
atlas.data.LineString |
google.maps.PolylineOptions |
atlas.layer.LineLayer atlas.LineLayerOptions |
google.maps.Circle |
맵에 원 추가 참조 |
google.maps.ImageMapType |
atlas.TileLayer |
google.maps.ImageMapTypeOptions |
atlas.TileLayerOptions |
google.maps.GroundOverlay |
atlas.layer.ImageLayer atlas.ImageLayerOptions |
서비스 클래스
Azure Maps Web SDK에는 별도로 로드할 수 있는 서비스 모듈이 포함됩니다. 이 모듈은 웹 API를 사용하여 Azure Maps REST 서비스를 래핑하며 JavaScript, TypeScript 및 node.js 애플리케이션에서 사용할 수 있습니다.
| Google Maps | Azure Maps |
|---|---|
google.maps.Geocoder |
atlas.service.SearchUrl |
google.maps.GeocoderRequest |
atlas.SearchAddressOptions [atlas.SearchAddressReverseOptions] atlas.SearchAddressReverseCrossStreetOptions atlas.SearchAddressStructuredOptions atlas.SearchAlongRouteOptions atlas.SearchFuzzyOptions atlas.SearchInsideGeometryOptions atlas.SearchNearbyOptions atlas.SearchPOIOptions atlas.SearchPOICategoryOptions |
google.maps.DirectionsService |
atlas.service.RouteUrl |
google.maps.DirectionsRequest |
atlas.CalculateRouteDirectionsOptions |
google.maps.places.PlacesService |
f |
라이브러리
라이브러리는 맵에 더 많은 기능을 추가합니다. 이러한 라이브러리 대부분은 Azure Maps 핵심 SDK에 포함되어 있습니다. 다음은 이러한 Google Maps 라이브러리 대신 사용할 수 있는 동일한 클래스입니다.
| Google Maps | Azure Maps |
|---|---|
| 그리기 라이브러리 | 그리기 도구 모듈 |
| 기하학 라이브러리 | atlas.math |
| 시각화 라이브러리 | 히트 맵 레이어 |
리소스 정리
정리할 리소스가 없습니다.
다음 단계
Azure Maps로 마이그레이션하는 방법에 대해 자세히 알아보세요: