Note
Access to this page requires authorization. You can try signing in or changing directories.
Access to this page requires authorization. You can try changing directories.
Important
- Heatmap is only displayed on the site pages where the Clarity tracking code is installed. Check the Setup process to know how to install it.
- Currently, Conversion maps are available on projects where Clarity detects purchase events.
Conversion maps provide specific data of key business metrics of your E-Commerce sites. Through Conversion maps, you can understand your website interactions that affect your purchase rate.

Tip
Refer to the Heatmaps overview to learn about different types of Clarity Heatmaps.
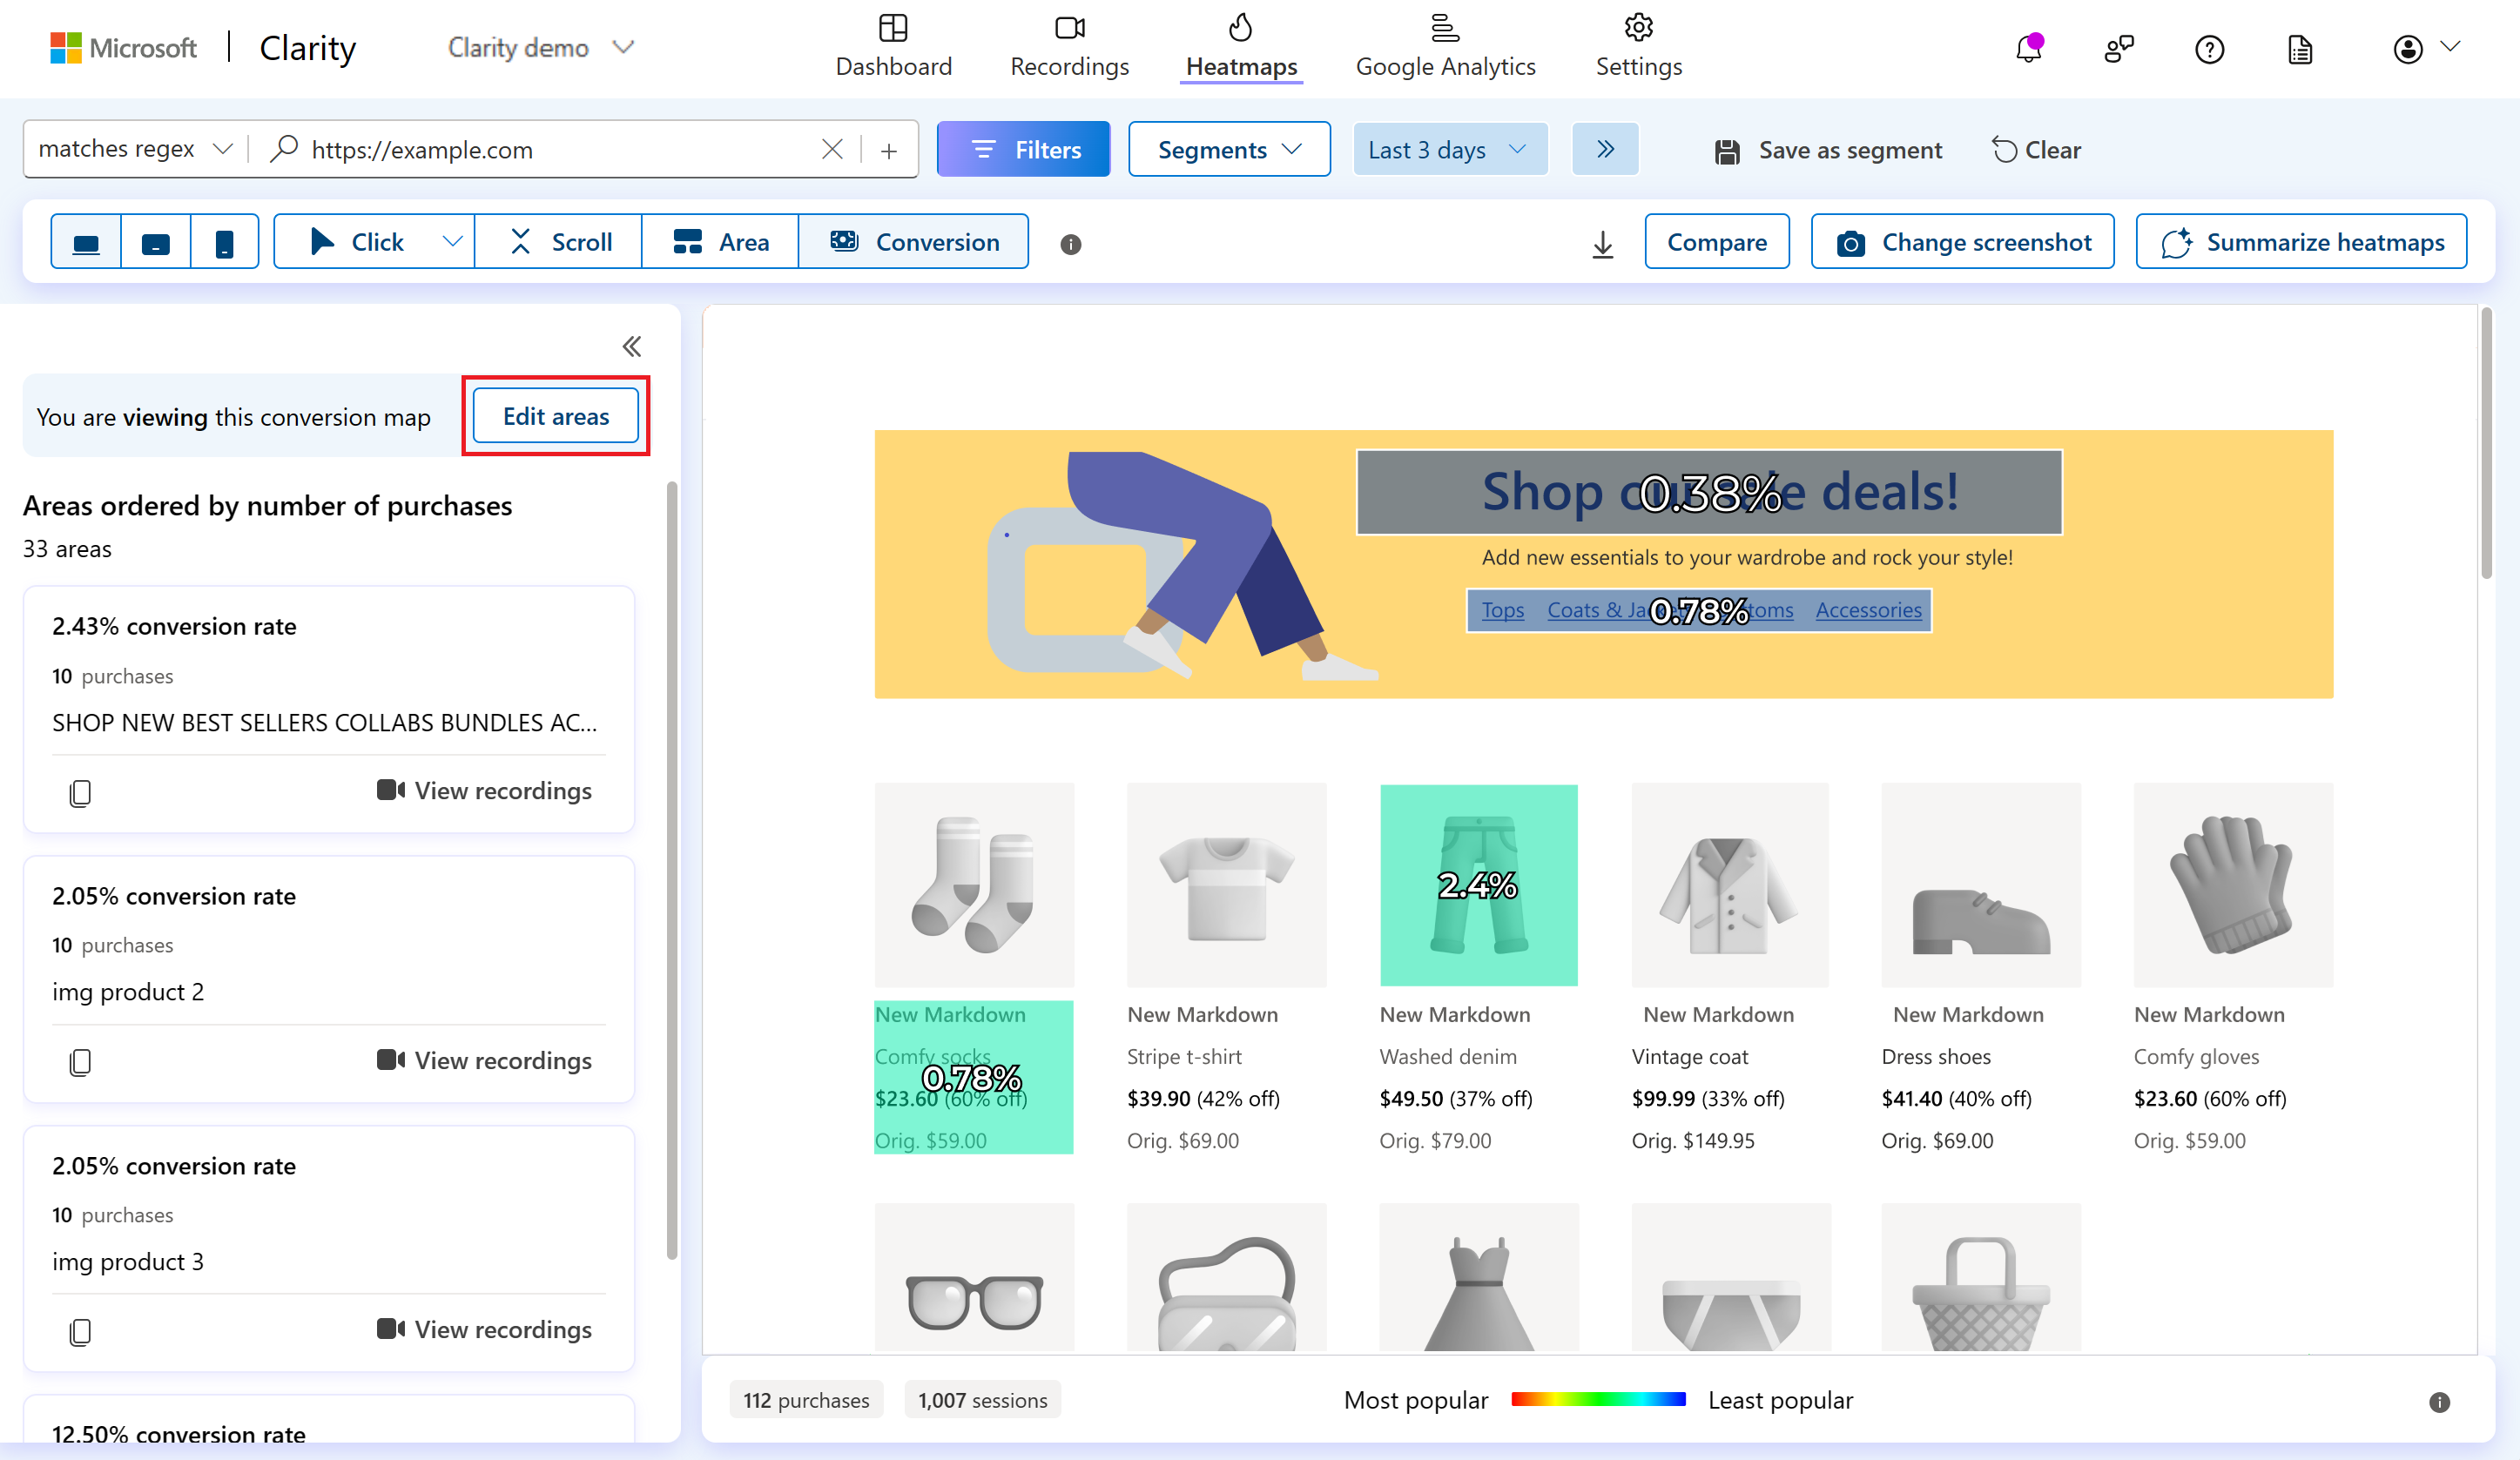
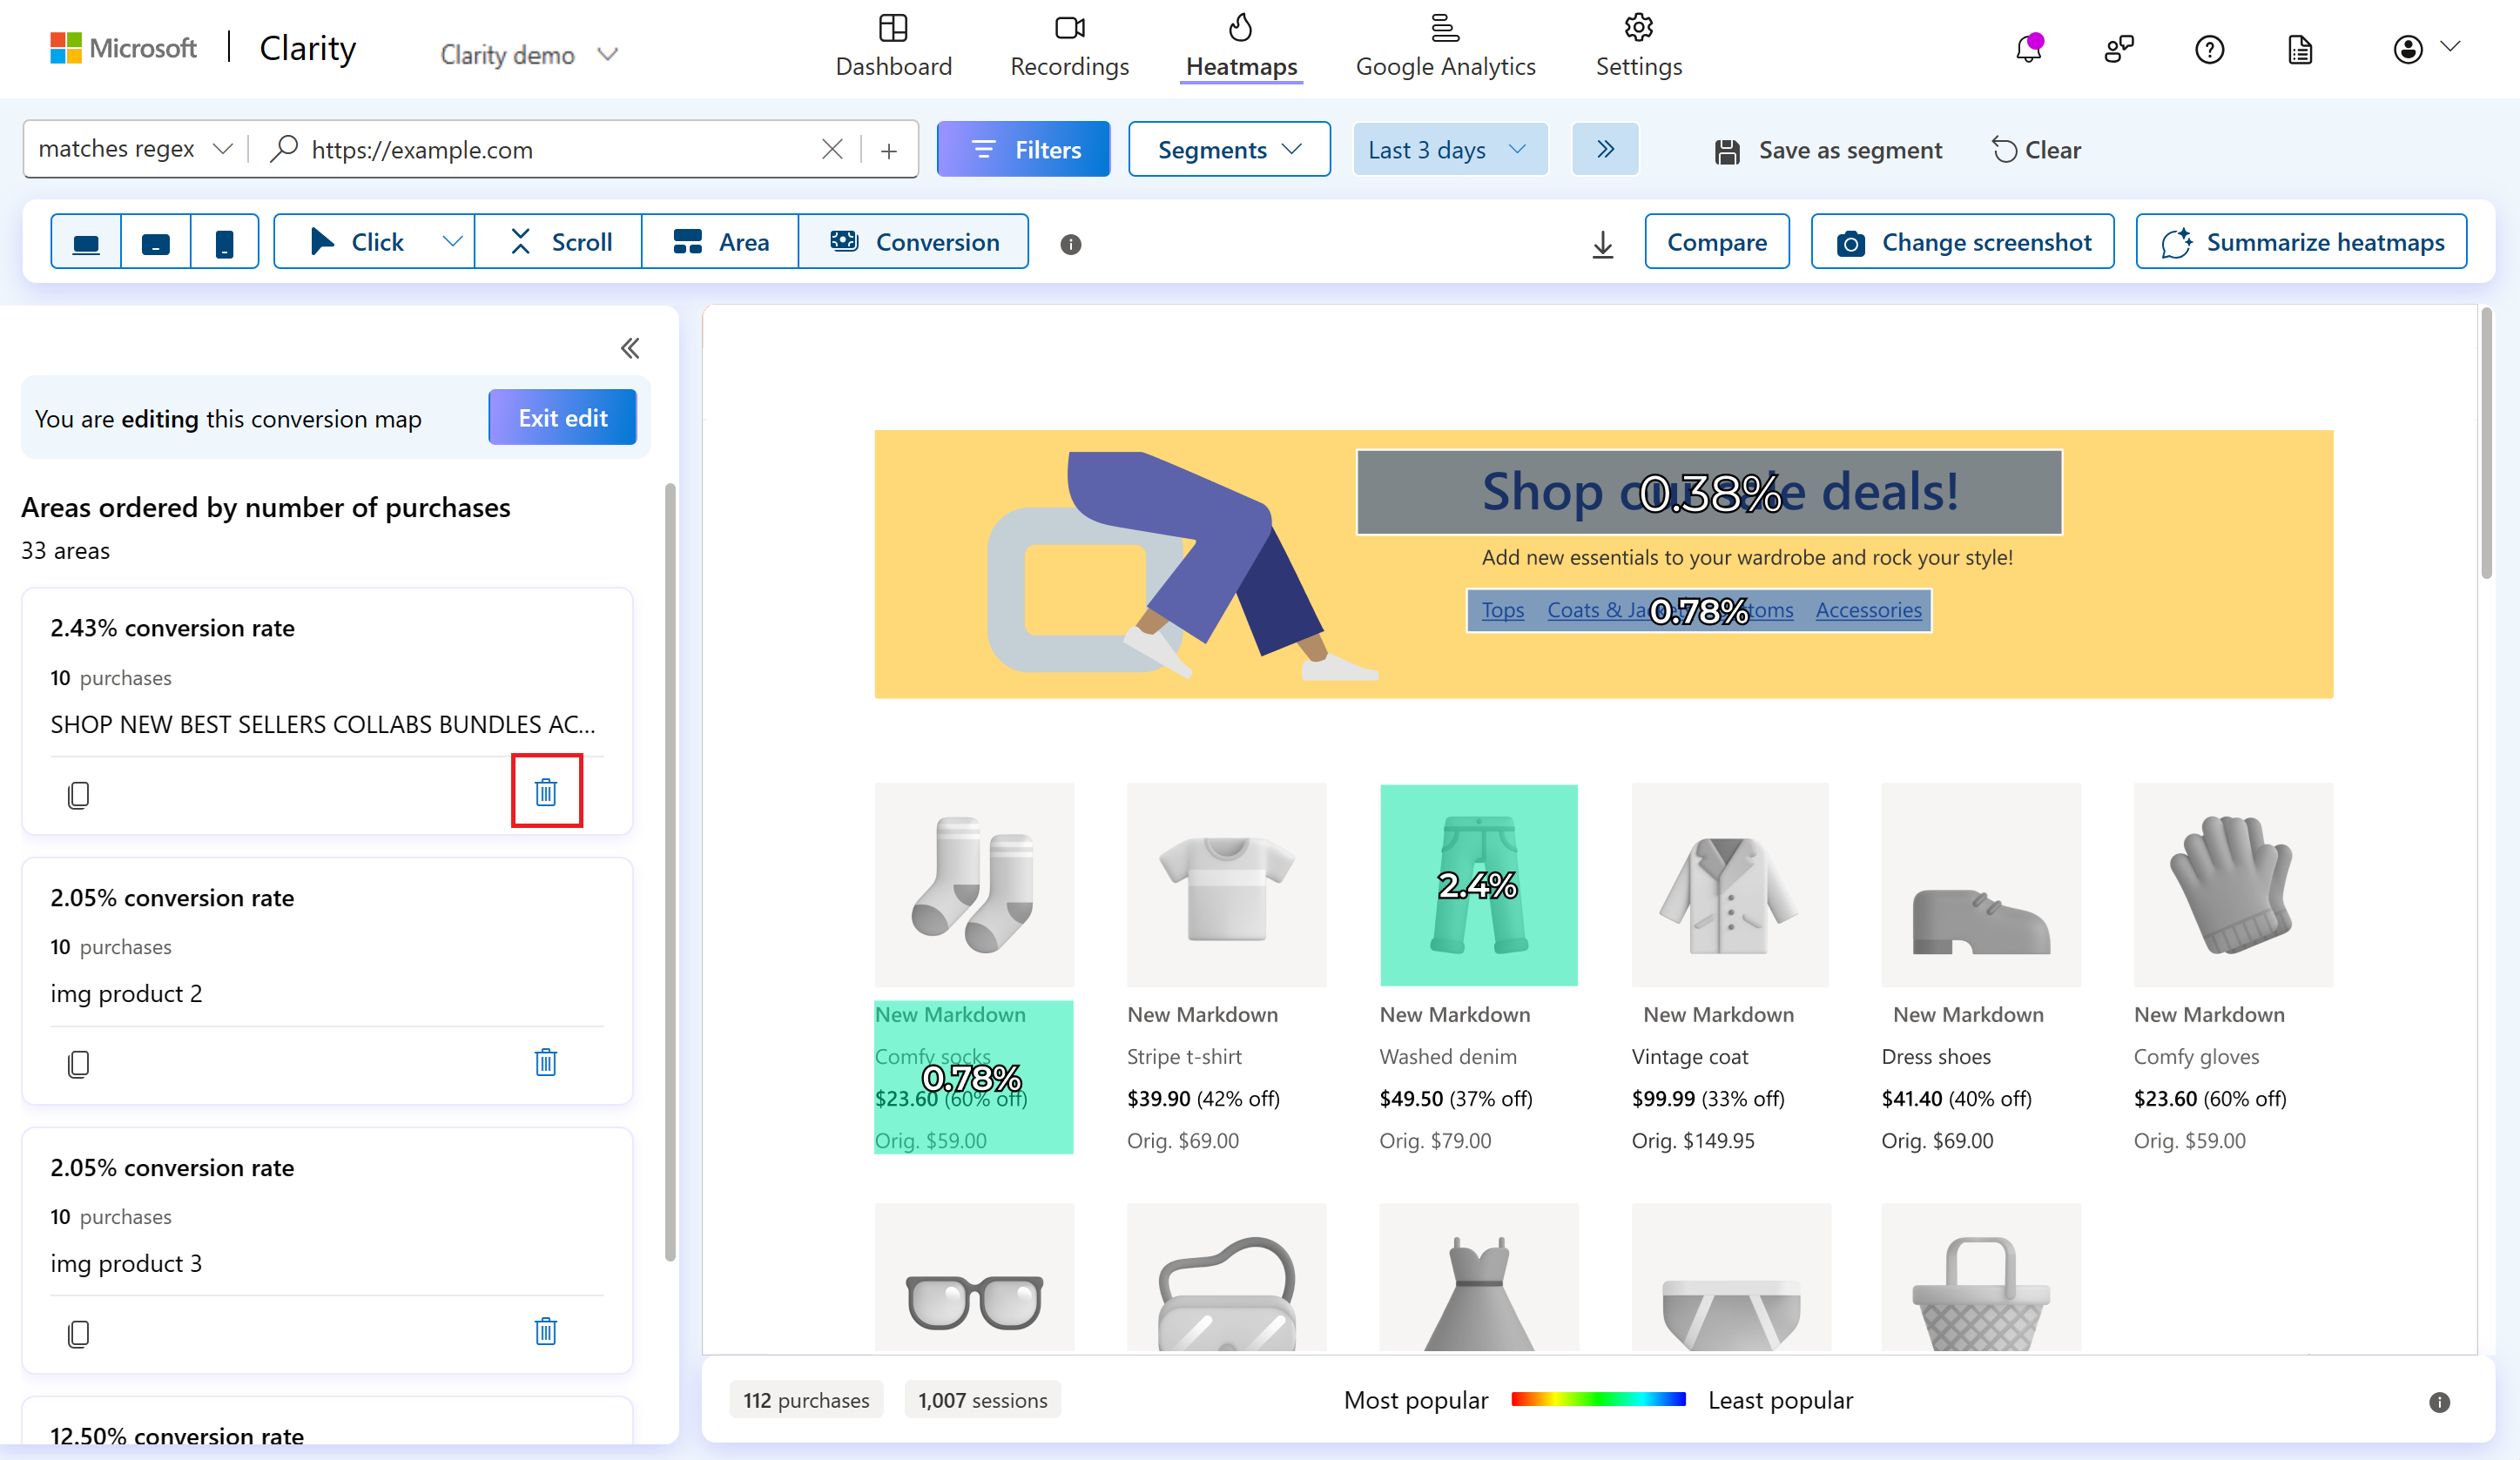
Edit Conversion maps
In this mode, you can select new regions on the maps. Select the Edit areas button to switch from viewing to editing the conversion maps.
Hover over the heatmap to select an area. CTR for the new area is calculated on the fly. View default areas based on the heat activity with applied filters. Distinct areas have a defining boundary, and CTR is visible by default on the area itself.
CTR: Click Through Rate (CTR) is the number of clicks on the area present by the total number of clicks on matched pages.
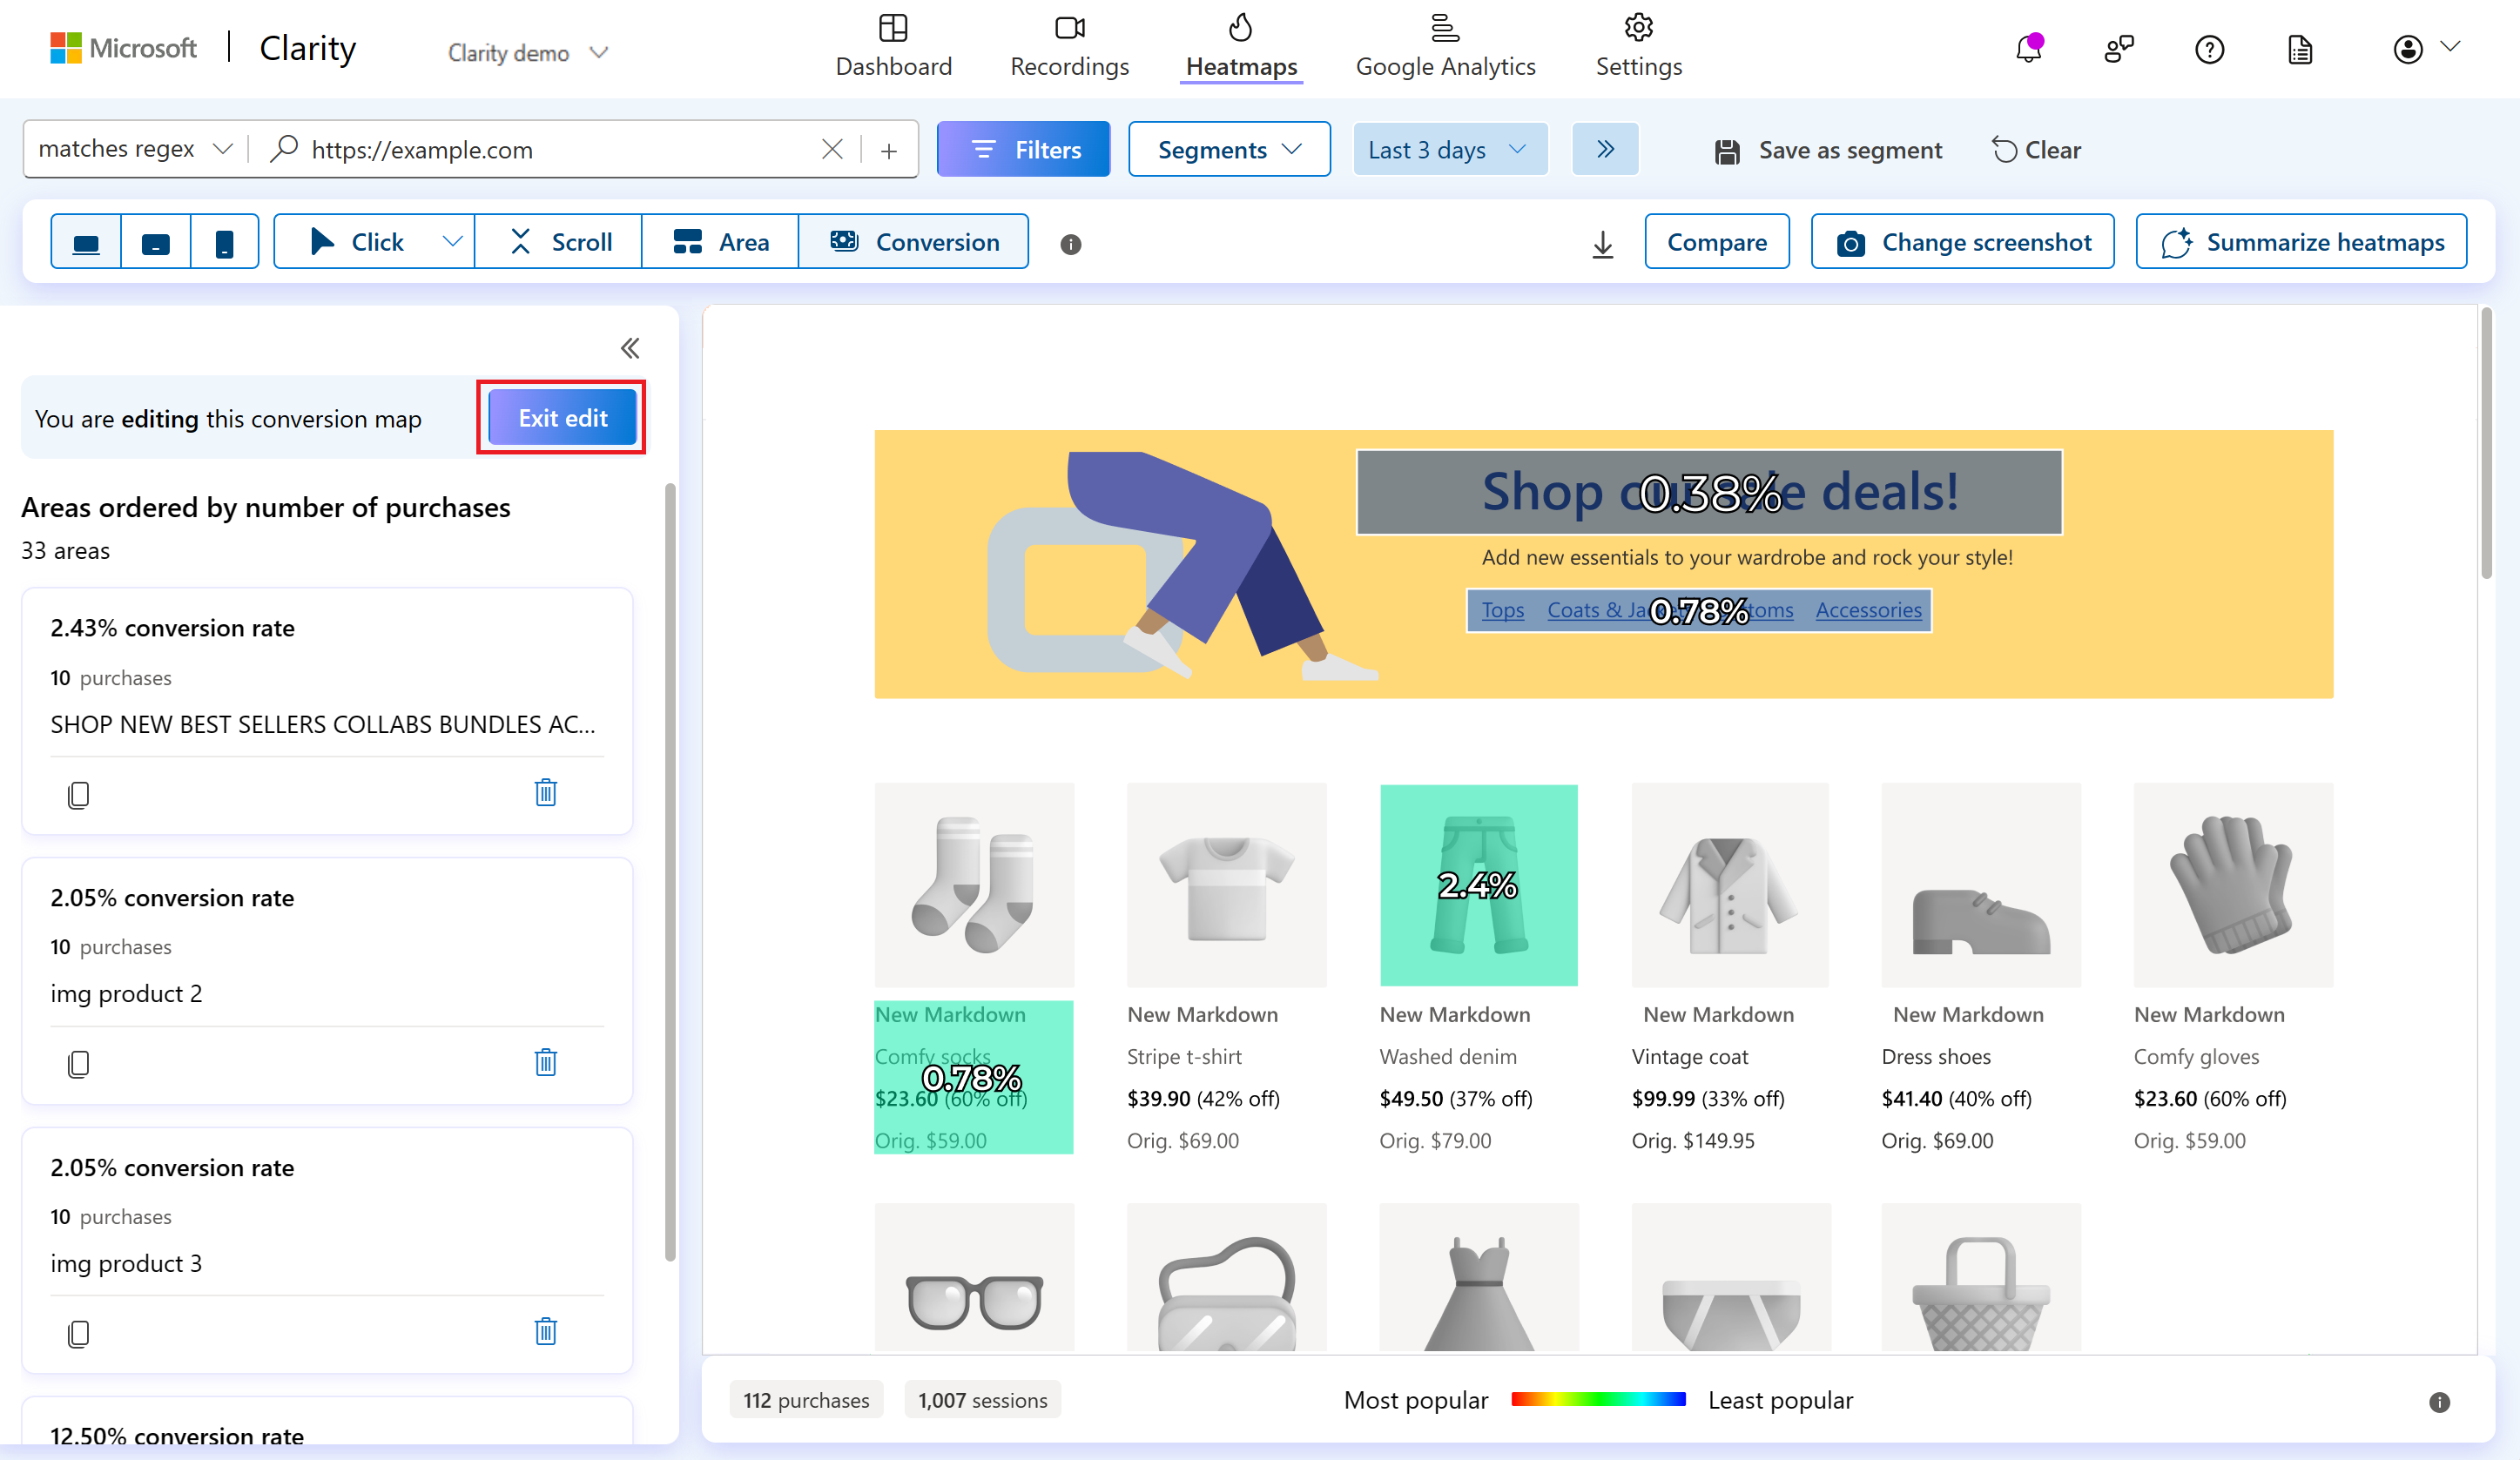
Select Exit edit as you finish editing.
Tip
In addition to team members, guest members can also edit areas in your project.
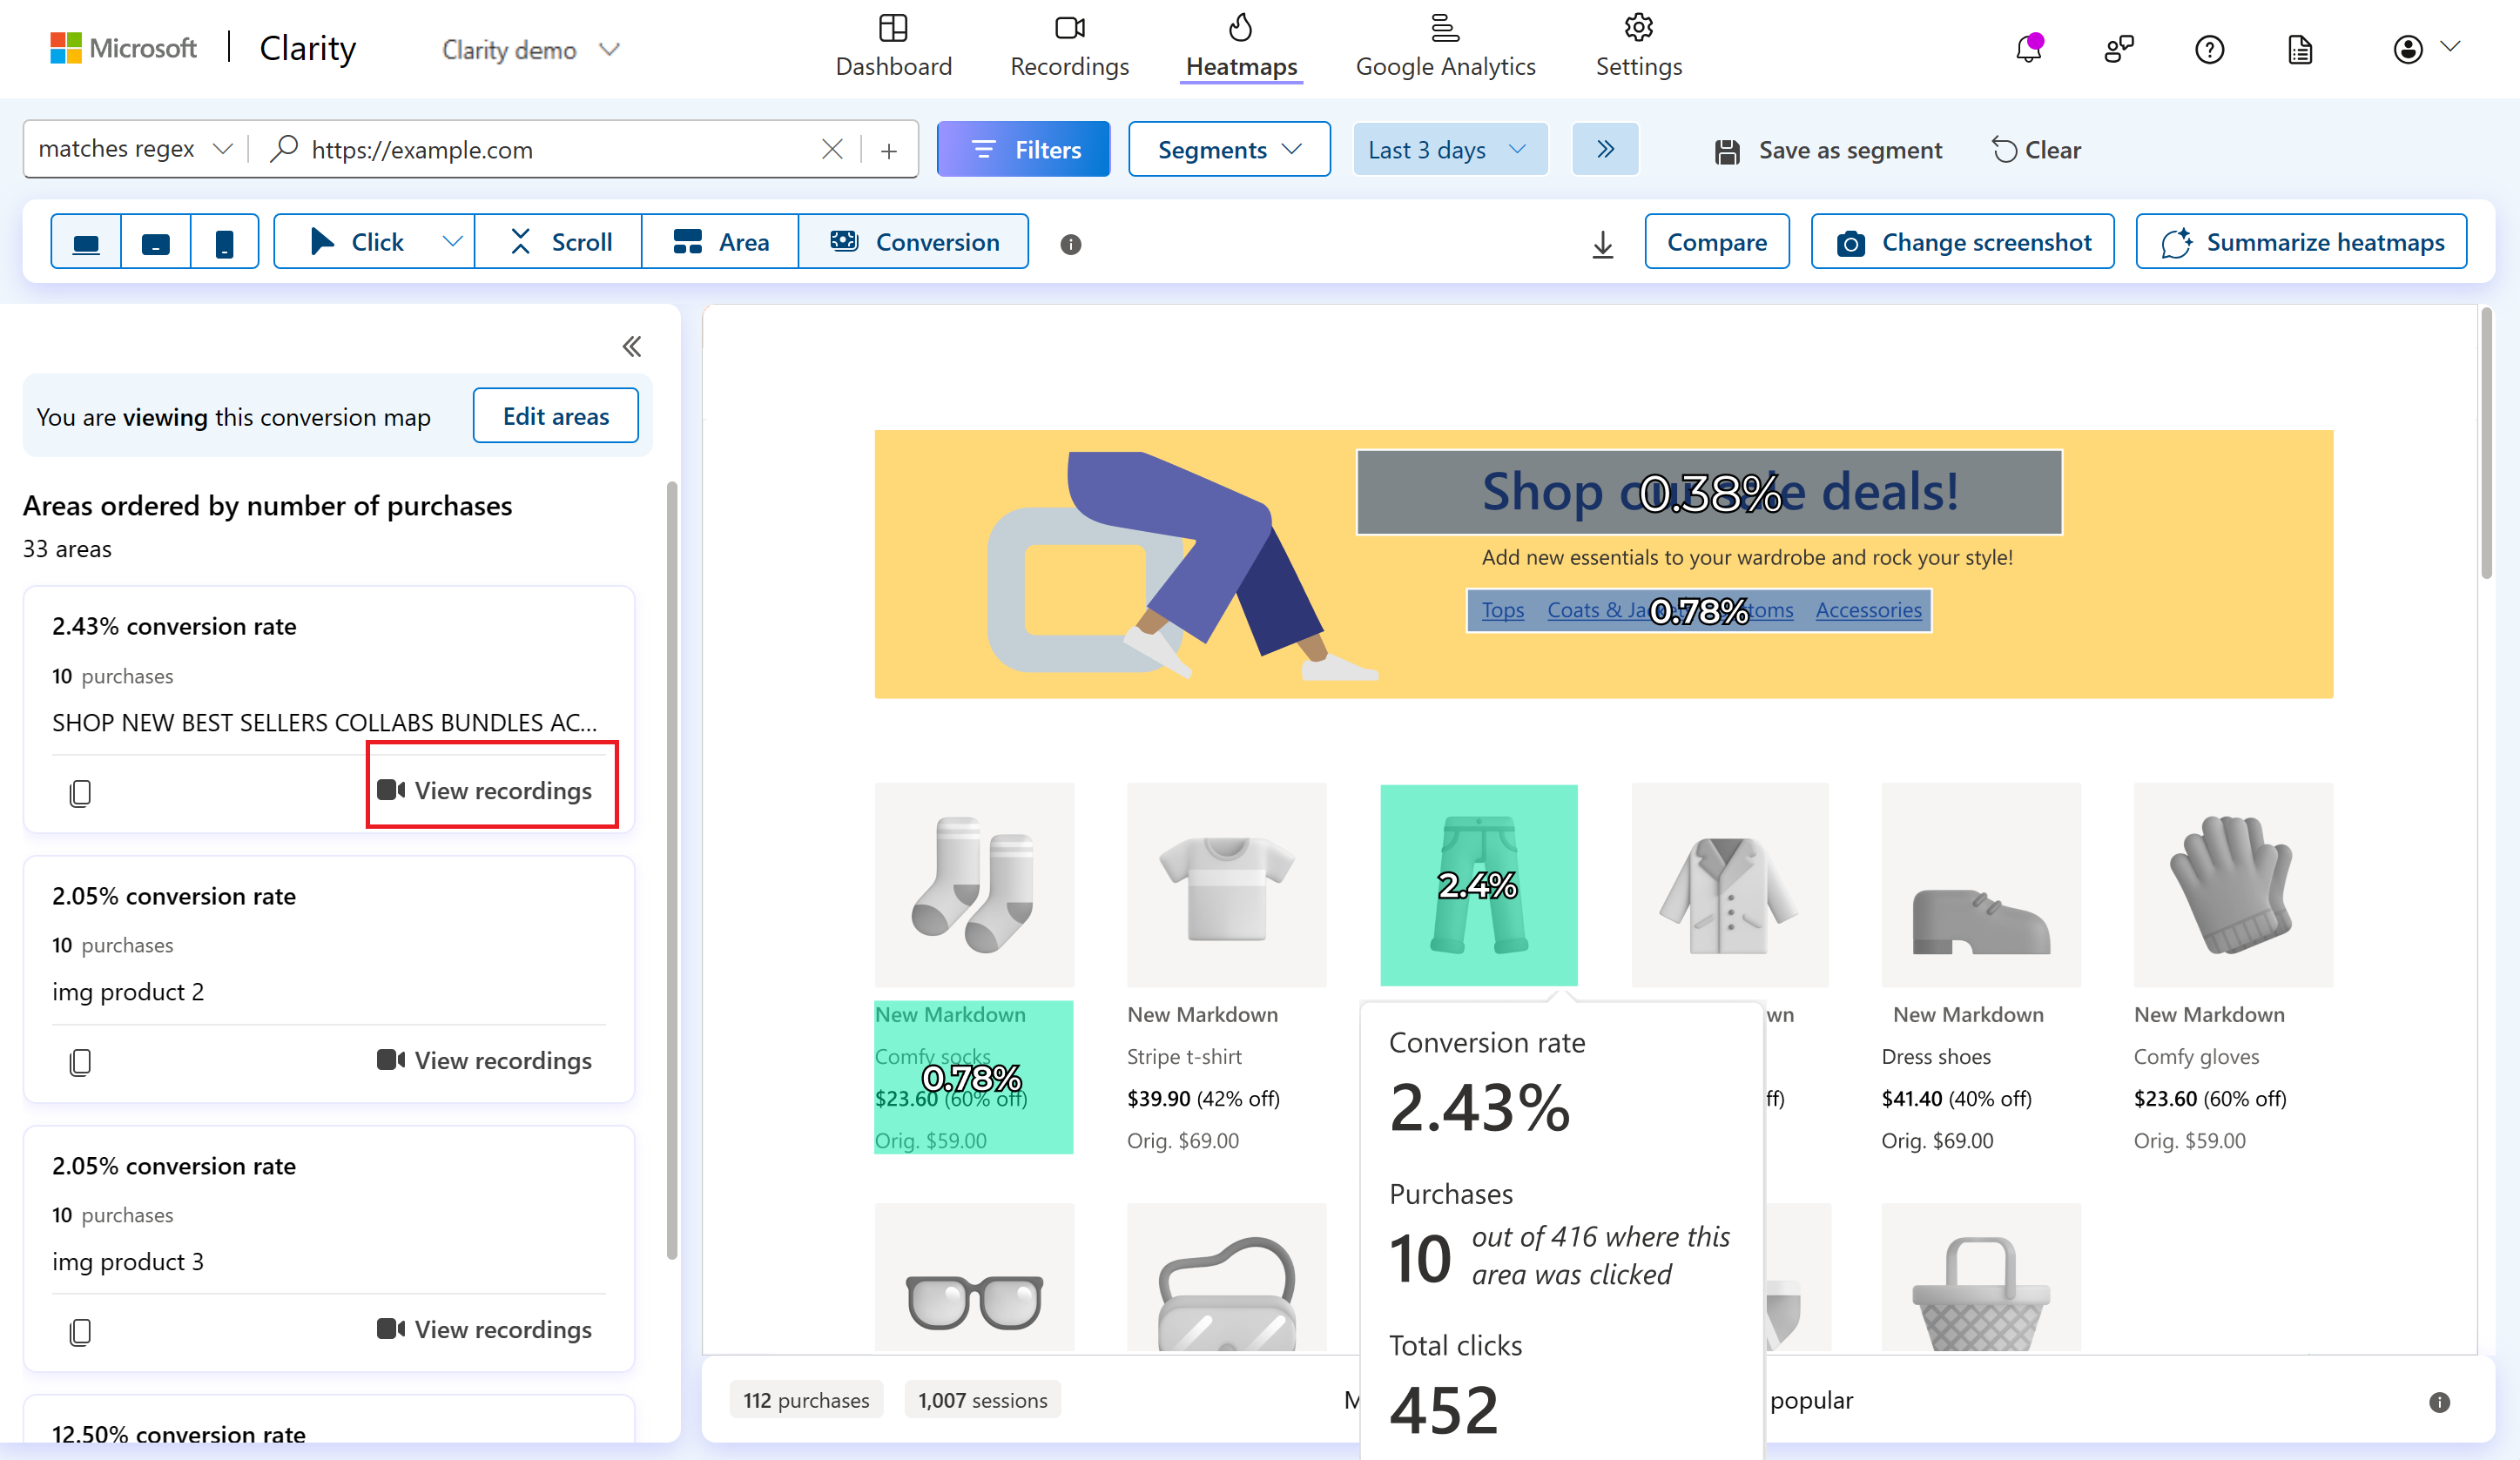
View Conversion maps
Conversion maps show the conversion rate, representing the percentage of all sessions that resulted in a purchase when a user clicks in a selected area.
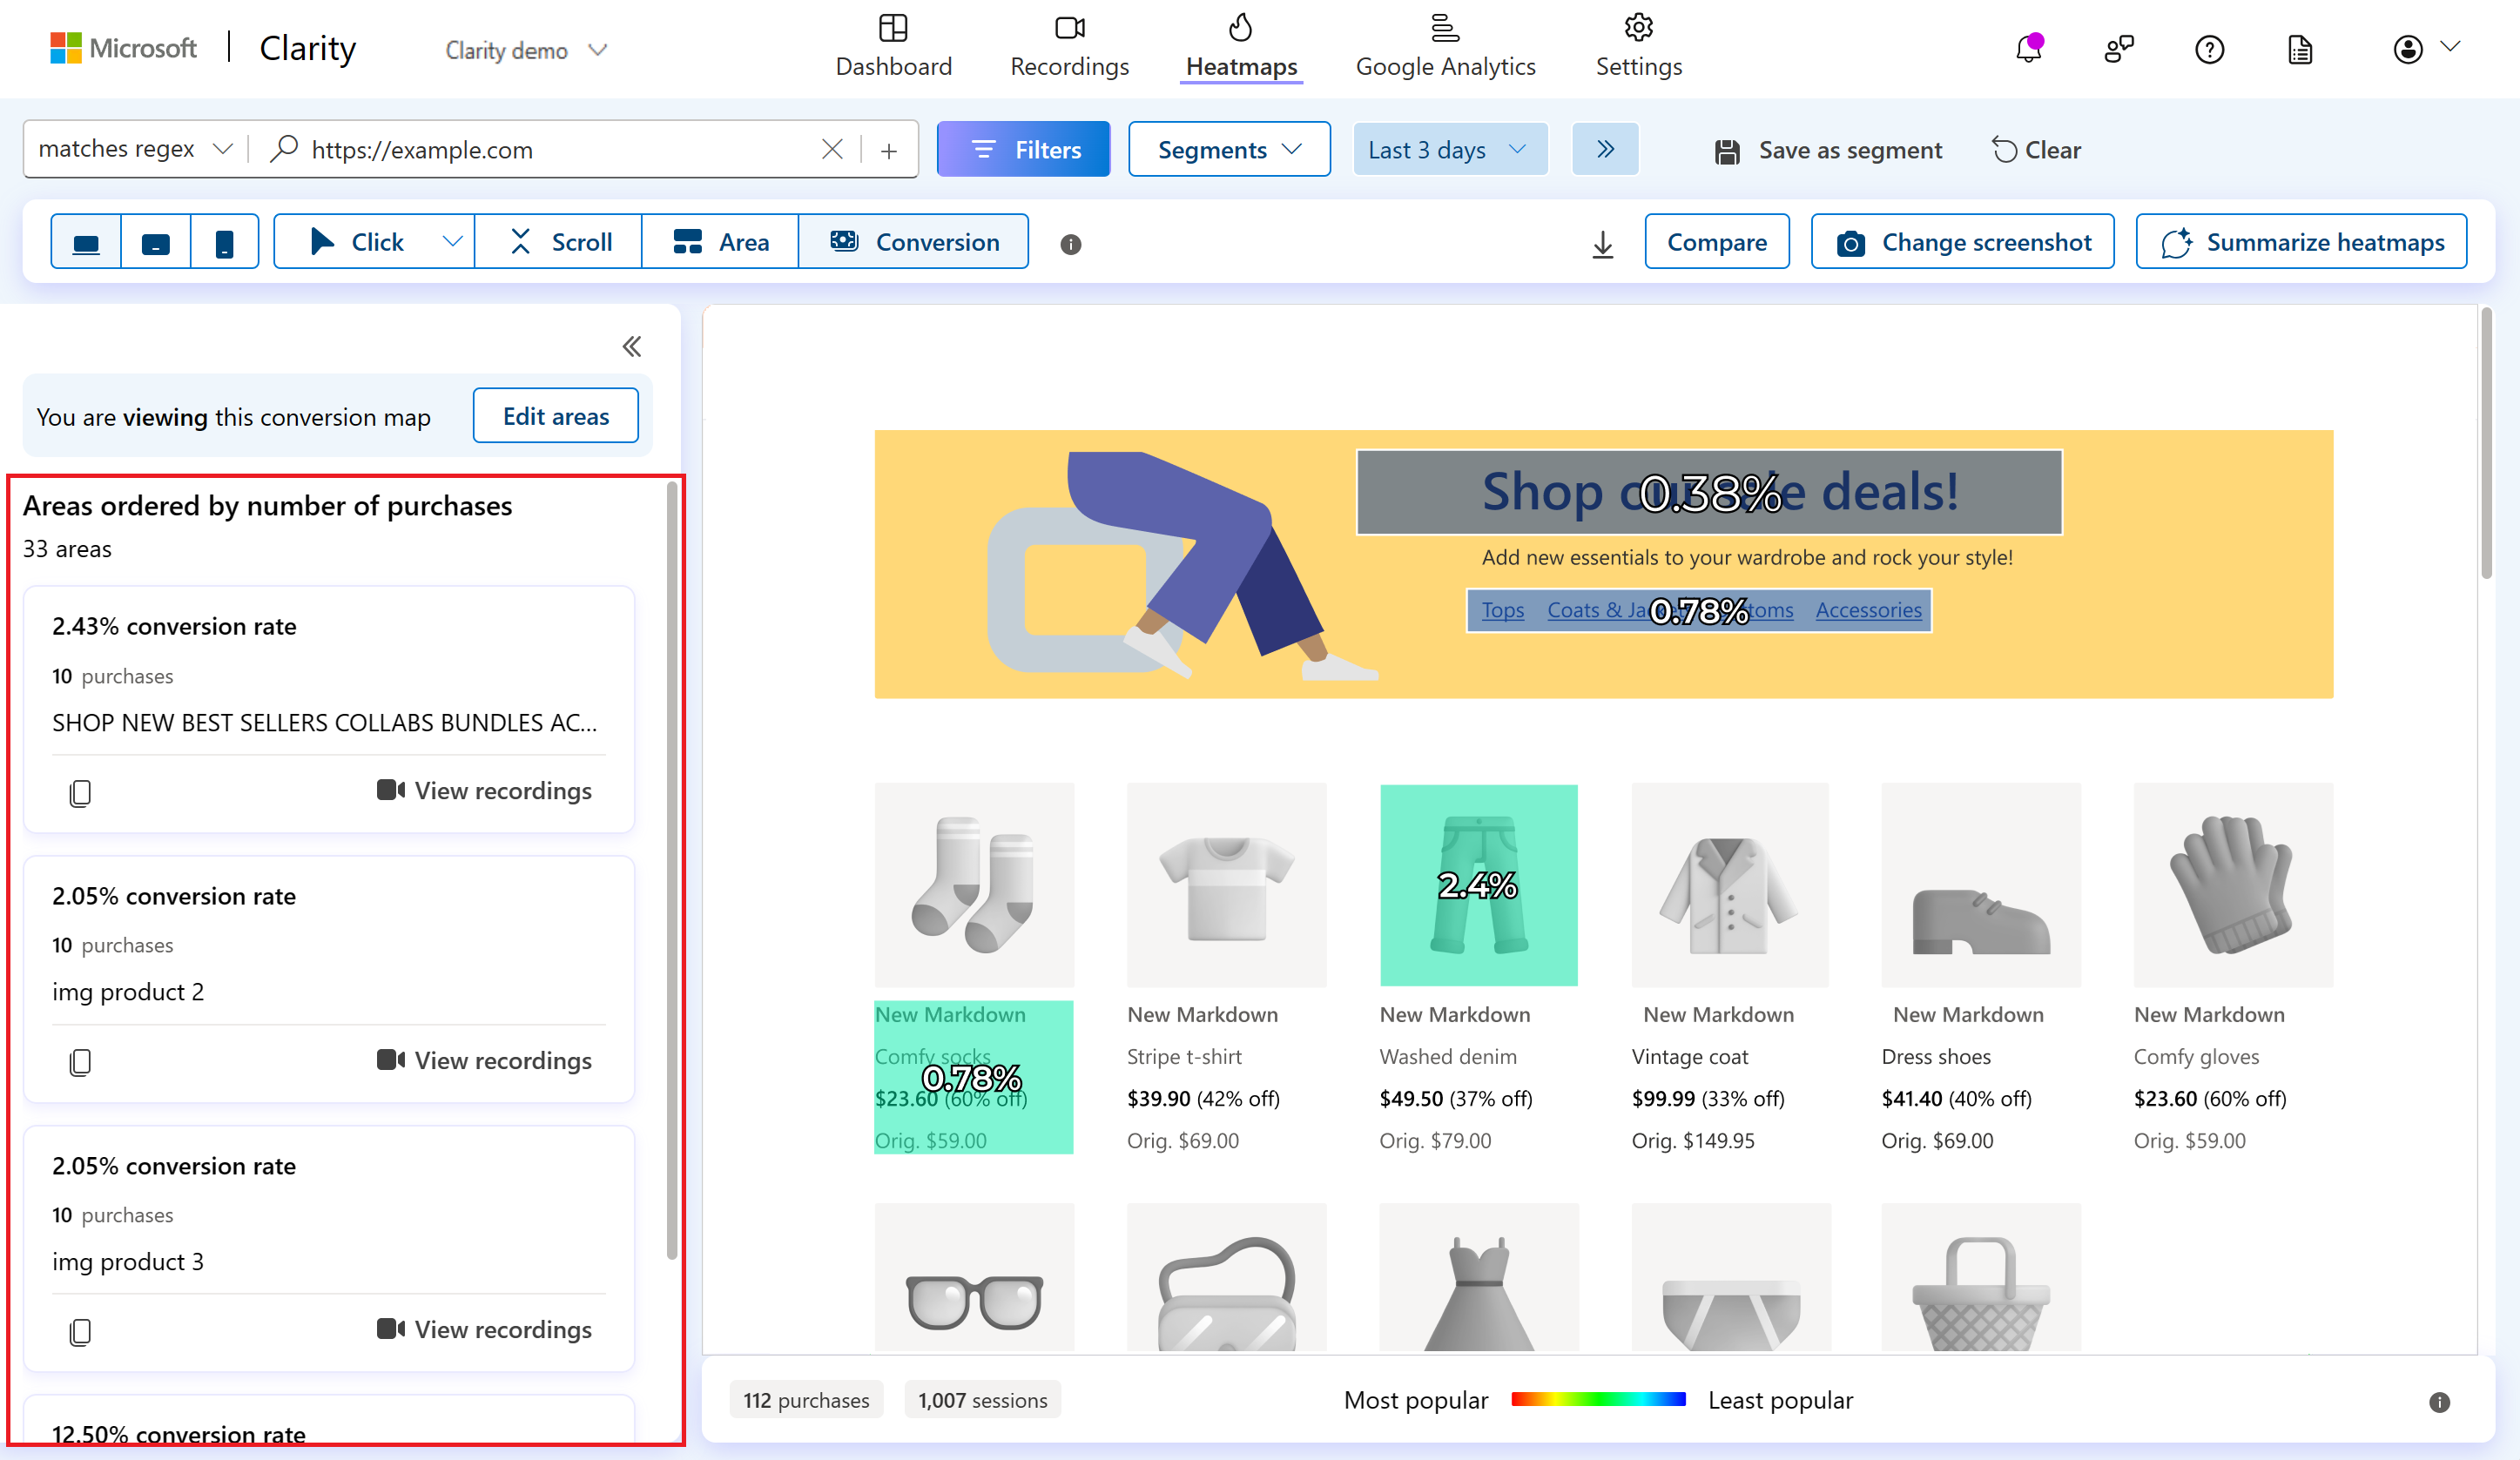
Left panel
The left panel contains the list of areas in order of appearance on a page. Select a new area between two zones in Edit mode to add from top to bottom and left to right. Expand (>>) to view or collapse (<<) to close the areas.
Note
By default, the area is connected to a single URL or group of URLs with applied filters. These areas can't be transferred to another heat map.
As you scroll to the bottom, you can see list of areas ordered by number of purchases. Select any element to view the CTR for the entire area.
As a new area is selected in Edit mode, it appears in the left panel. Deselect the area by selecting the delete icon in the left panel.
View recordings
You can also view the recordings either by selecting the recordings icon or by selecting View recordings. View recordings help you watch recordings where the element was clicked.
Notice a clicked element badge as an applied filter on selecting this button. Learn more about badge labels.
Note:
- Once applied, this filter appears on Recordings, Dashboard, and Heatmaps verticals.
- You can access it later by saving it as a segment or sharing it.
Badge label limitations:
- This filter can only be set through a heat map and can't be selected from filters.
- If you close the filter, you have to set it through Heatmaps again.
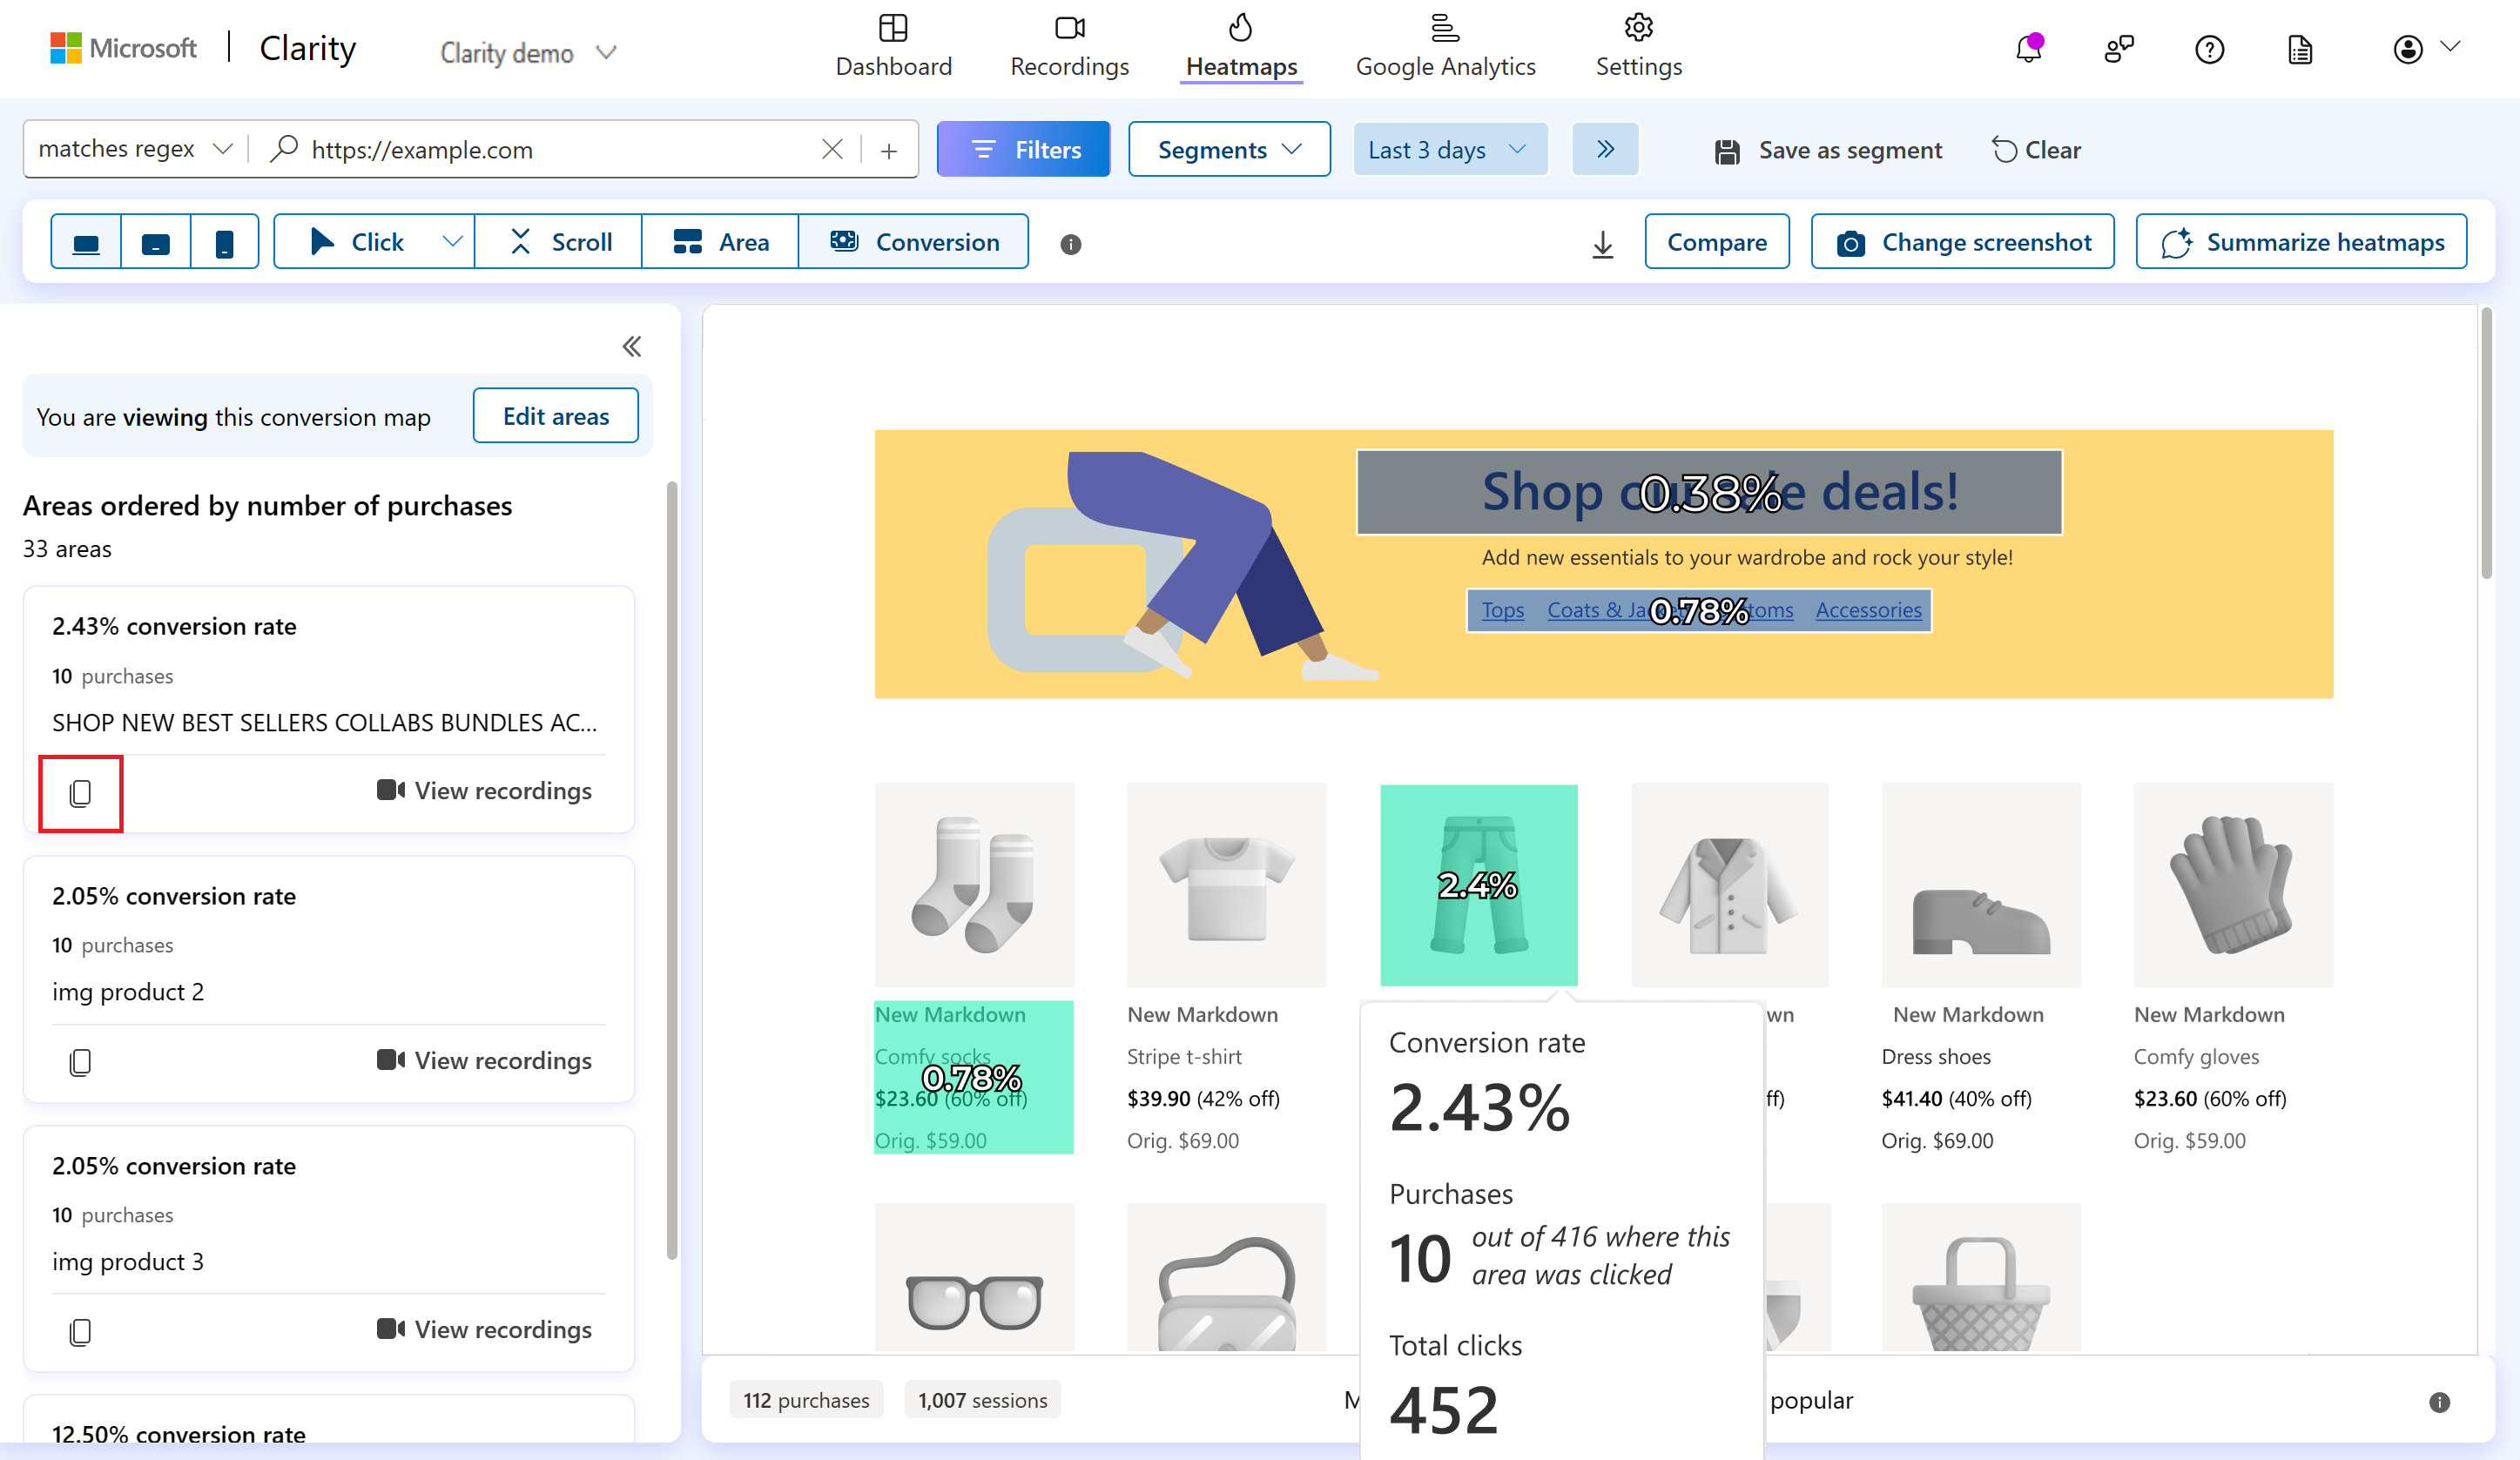
Copy Element
You can copy the element to the clipboard by selecting the copy icon. This copies the CSS selector of an element that allows you to identify the exact element in the UI. You can use it to change the style of an element.
Top panel
The top panel helps you customize the Conversion maps visualization:

Filters: Refer to Filters overview to learn more.
Segments: Refer to Segments to learn more.
Time frame: Edit the time frame to better view the heatmaps. You can select from today, yesterday, or custom days or time frame.
Visited URL: This autofill search bar along with regex match contains all the websites that are part of Clarity's project. You can add multiple path filters to view heatmaps for group of pages. The other applied filters are also shown here. You can also save the filters as a segment or clear it.
Supported devices: Choose PC/Tablet/Mobile view to understand user behavior on these devices.
Heatmaps types: You can switch between click map types, scroll maps, attention maps, and area maps.
Sharing: Share the area map with others.
Tip
As you share a Heatmap, in addition to team members, guest members can also edit areas in your project.
Download: Download the area maps.
Compare: Compare two same or different heatmaps.
Change screenshot: Select another screenshot to view area maps.
Summarize heatmaps: Summarize heatmaps to easily understand the user behaviors and trends of your website pages.
Bottom panel

Purchases and Sessions: The total number of purchases and the total number of sessions for applied filters. The purchases are limited to up to 100,000 per Heatmap.
Color scale: Colors get warmer as the popularity of a section increases. The warmer the colors, the denser the CTR. Red indicates high CTR and blue indicates low CTR.
Limitations
- Though you select areas in Edit mode, it won't retain if you switch to any other vertical.
- The Conversion maps data is retained until the session expires.
- Unlike segments, the selected areas can't be saved.
FAQ
For more answers, refer to Heatmap FAQ.