你当前正在访问 Microsoft Azure Global Edition 技术文档网站。 如果需要访问由世纪互联运营的 Microsoft Azure 中国技术文档网站,请访问 https://docs.azure.cn。
将符号连接到数据源,并使用它在给定时间点呈现图标或文本。
符号层是使用 WebGL 呈现的。 使用符号层可在地图上呈现较大的点集。 与 HTML 标记相比,符号层在地图上呈现大量的点数据,从而提高性能。 但是,符号层不支持使用传统的 CSS 和 HTML 元素来设置样式。
提示
默认情况下,符号层将呈现数据源中所有几何图形的坐标。 若要限制该层以便仅呈现点几何功能,请将该层的 filter 属性设置为 ['==', ['geometry-type'], 'Point'] 或 ['any', ['==', ['geometry-type'], 'Point'], ['==', ['geometry-type'], 'MultiPoint']](如果需要,则可以包含 MultiPoint 特征)。
地图图像子画面管理器加载符号层使用的自定义图像。 它支持以下图像格式:
- JPEG
- PNG
- SVG
- BMP
- GIF(非动画)
添加符号层
在可以将符号层添加到地图之前,你需要先执行几个步骤。 首先,创建一个数据源,并将其添加到地图。 创建符号层。 然后,将数据源传入符号层以从数据源中检索数据。 最后,将数据添加到数据源,便可呈现一些内容。
下面的代码演示了在加载地图后应添加到地图的内容。 此示例使用符号层在地图上呈现单个点。
//Create a data source and add it to the map.
var dataSource = new atlas.source.DataSource();
map.sources.add(dataSource);

//Create a symbol layer to render icons and/or text at points on the map.
var layer = new atlas.layer.SymbolLayer(dataSource);

//Add the layer to the map.
map.layers.add(layer);

//Create a point and add it to the data source.
dataSource.add(new atlas.data.Point([0, 0]));
有四种可添加到地图的不同类型的点数据:
- GeoJSON 点几何 - 此对象仅包含点的坐标,而不包含其他任何内容。
atlas.data.Point帮助程序类可用于轻松创建这些对象。 - GeoJSON 多点几何 - 此对象仅包含多点的坐标,而不包含其他任何内容。
atlas.data.MultiPoint帮助程序类可用于轻松创建这些对象。 - GeoJSON 功能 - 此对象包含任何 GeoJSON 几何和一组属性,其中包含与几何关联的元数据。
atlas.data.Feature帮助程序类可用于轻松创建这些对象。 atlas.Shape类类似于 GeoJSON 功能。 两者都包含 GeoJSON 几何和一组属性,其中包含与几何关联的元数据。 如果将 GeoJSON 对象添加到数据源,则可以轻松地在层中呈现该对象。 但是,如果更新了该 GeoJSON 对象的坐标属性,则数据源和地图不会发生更改。 这是因为 JSON 对象中没有用于触发更新的机制。 shape 类提供用于更新其包含的数据的函数。 进行更改时,将自动通知和更新数据源和地图。
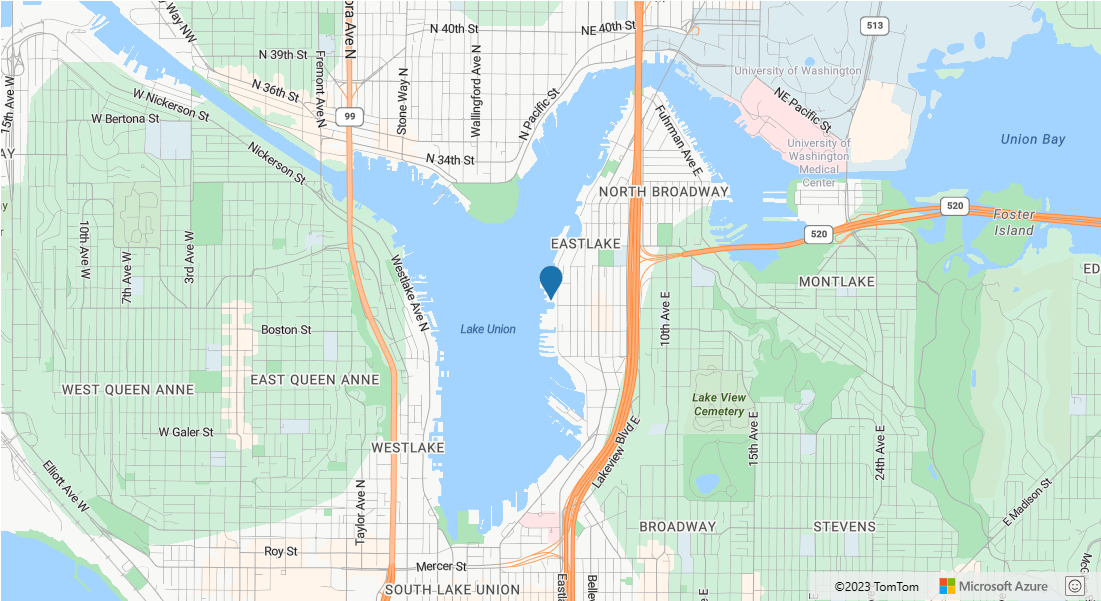
下面的代码示例创建 GeoJSON 点几何,并将其传入 atlas.Shape 类以使其易于更新。 地图的中心最初用于呈现符号。 将 Click 事件添加到地图,以便在该事件触发时,鼠标坐标与形状 setCoordinates 函数一起使用。 鼠标坐标在触发 Click 事件时记录。 然后,setCoordinates 在地图上更新符号的位置。
function InitMap()
{
    var map = new atlas.Map('myMap', {
        center: [-122.33, 47.64],
        zoom: 13,
        view: "Auto",

        //Add authentication details for connecting to Azure Maps.
        authOptions: {
            authType: 'subscriptionKey',
            subscriptionKey: '{Your-Azure-Maps-Subscription-key}'
        }
    });

    //Wait until the map resources are ready.
    map.events.add('ready', function () {

      /*Create a data source and add it to the map*/
      var dataSource = new atlas.source.DataSource();
      map.sources.add(dataSource);
      var point = new atlas.Shape(new atlas.data.Point([-122.33, 47.64]));
      //Add the symbol to the data source.
      dataSource.add([point]);

      /* Gets co-ordinates of clicked location*/
      map.events.add('click', function(e){
        /* Update the position of the point feature to where the user clicked on the map. */
        point.setCoordinates(e.position);
      });

      //Create a symbol layer using the data source and add it to the map
      map.layers.add(new atlas.layer.SymbolLayer(dataSource, null));
    });
}
提示
默认情况下,符号层通过隐藏重叠的符号来优化符号的呈现。 放大时,隐藏的符号将变为可见。 若要禁用此功能并始终呈现所有符号,请将 iconOptions 选项的 allowOverlap 属性设置为 true。
将自定义图标添加到符号层
符号层是使用 WebGL 呈现的。 因此,所有资源(例如图标图像)必须载入 WebGL 上下文。 此示例演示如何将自定义图标添加到地图资源。 然后,此图标用于使用自定义符号在地图上呈现点数据。 符号层的 textField 属性要求指定一个表达式。 在本例中,我们希望呈现温度属性。 由于温度为数字,因此需要将其转换为字符串。 此外,我们还需要在其后追加“°F”。 表达式可用于执行此串联;['concat', ['to-string', ['get', 'temperature']], '°F']。
function InitMap()
{
    var map = new atlas.Map('myMap', {
        center: [-73.985708, 40.75773],
        zoom: 12,
        view: "Auto",

        //Add authentication details for connecting to Azure Maps.
        authOptions: {
            authType: 'subscriptionKey',
            subscriptionKey: '{Your-Azure-Maps-Subscription-key}'
        }
    });

    map.events.add('ready', function () {

      //Load the custom image icon into the map resources.
      map.imageSprite.add('my-custom-icon', '/images/icons/showers.png').then(function () {

        //Create a data source and add it to the map.
        var datasource = new atlas.source.DataSource();
        map.sources.add(datasource);

        //Create a point feature and add it to the data source.
        datasource.add(new atlas.data.Feature(new atlas.data.Point([-73.985708, 40.75773]), {
          temperature: 64
        }));

        //Add a layer for rendering point data as symbols.
        map.layers.add(new atlas.layer.SymbolLayer(datasource, null, {
          iconOptions: {
            //Pass in the id of the custom icon that was loaded into the map resources.
            image: 'my-custom-icon',

            //Optionally scale the size of the icon.
            size: 0.5
          },
          textOptions: {
            //Convert the temperature property of each feature into a string and concatenate "°F".
            textField: ['concat', ['to-string', ['get', 'temperature']], '°F'],

            //Offset the text so that it appears on top of the icon.
            offset: [0, -2]
          }
        }));
      });
    });
}
![]()
注意
有关上述示例中使用的图像文件的副本,请参阅 GitHub 中的 showers.png。
提示
Azure Maps Web SDK 提供了多个可与符号层一起使用的可自定义的图像模板。 有关详细信息,请参阅如何使用图像模板文档。
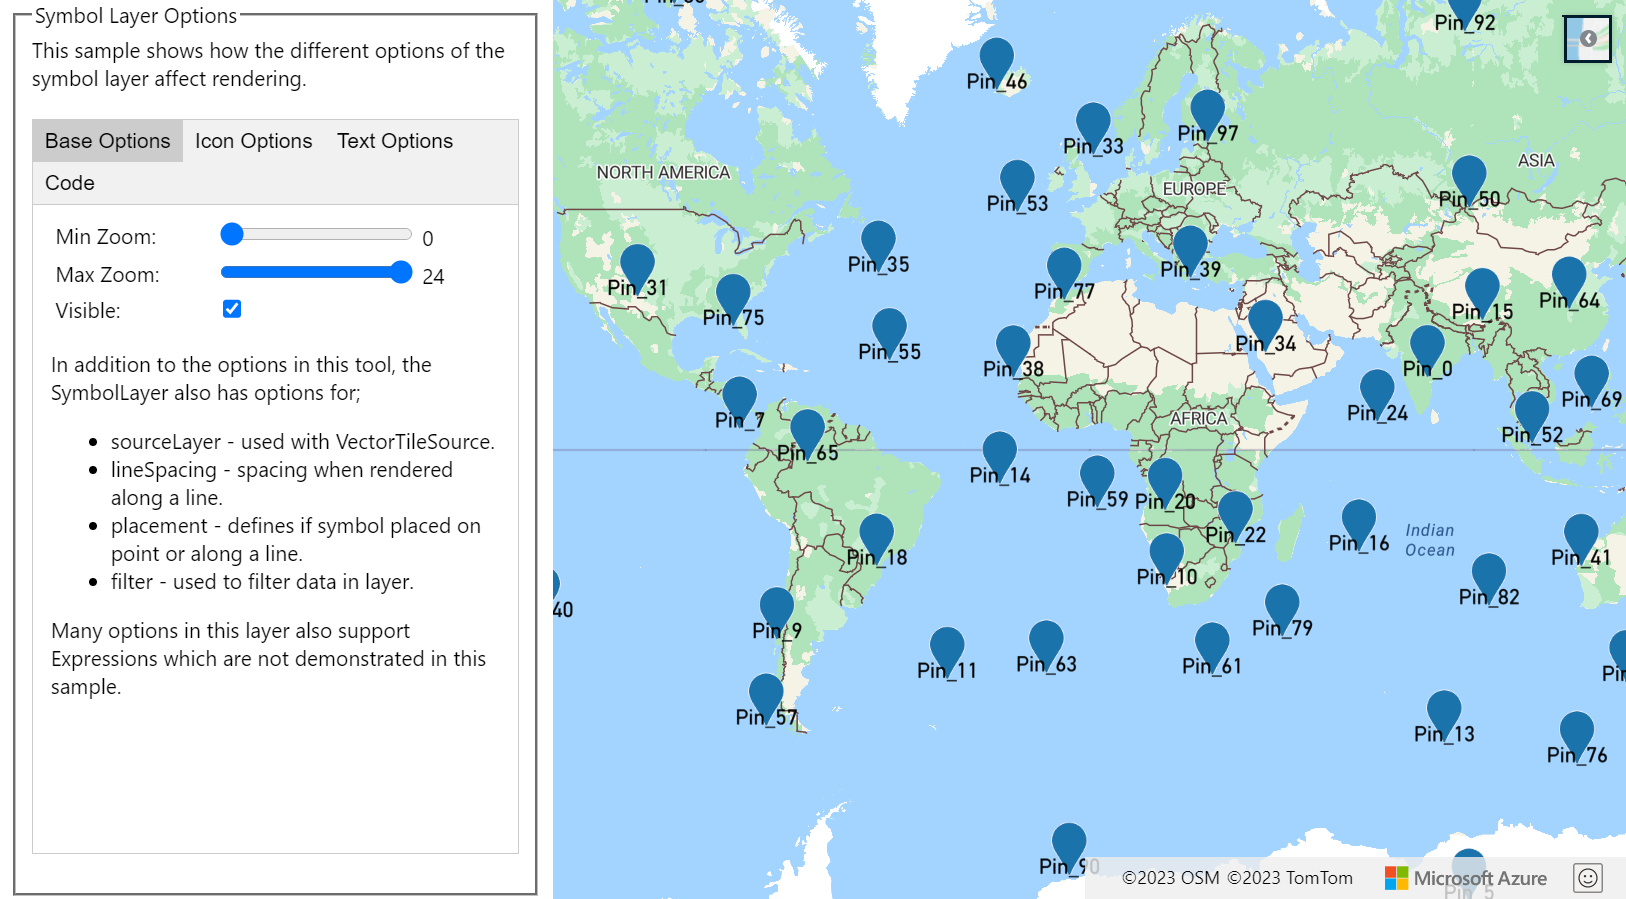
自定义符号层
符号层有许多样式选项。 符号层选项示例显示了符号层的不同选项对呈现效果的影响。 有关此示例的源代码,请参阅符号层选项源代码。
提示
如果希望使用符号层仅呈现文本,则可以通过将图标选项的 image 属性设置为 'none' 来隐藏该图标。
后续步骤
详细了解本文中使用的类和方法:
有关可向地图添加的更多代码示例,请参阅以下文章: