Note
Access to this page requires authorization. You can try signing in or changing directories.
Access to this page requires authorization. You can try changing directories.
The Background
About 3 months ago as some colleagues and I were working on the "Advanced Debugging Hands On Lab for Windows Azure" (for more info contact me via this blog) we identified an interesting opportunity within the Azure MMC. If you've worked with this tool you may have seen that the default export option for the performance counters log is an Excel file. More specifically a CSV file. This is fine for getting a dump of event log data or native Azure infrastrucutre logs but for performance counter data this is not ideal.
The Problem
The format of the data exported in the Azure MMC made it impossible to use our existing Performance Monitor tool on Windows (perfmon) or our Performance Analysis of Logs tool from codeplex. These tools are essential for us in support as we do initial problem analysis. Issues like managed or unmanaged memory leaks, high and low CPU hangs, and process restarts are just a few examples of issues that start with perfmon analysis. These issues do not go away in the cloud!
The Solution
The Azure MMC team made an outstanding design decision that allowed us to very quickly build a plug-in that could provide additional options for exporting those performance counters however we want. Because the team decided to take advantage of the Managed Extensibility Framework (aka MEF) it was easy to extend the capabilies of the MMC with our own functionality. Here are the steps that were required to code up the solution:
- Start from a new WPF User Control Library project.
- Next you'll want to set your project to target .NET Framework 3.5 if you are using Visual Studio 2010 because the version of MEF that the Azure MMC uses is pre .NET 4.0
- Add References to the following assemblies located in your %InstallRoot%\WindowsAzureMMC\release folder
- Microsoft.Samples.WindowsAzureMmc.Model
- Microsoft.Samples.WindowsAzureMmc.ServiceManagement
- MicrosoftManagementConsole.Infrastructure
- System.ComponentModel.Composition
- WPFToolkit
- Next, the implementation decision made in the Azure MMC base classes meant we had to follow the MVVM pattern for WPF to create a ViewModel that would bind to the controls rendered as part of the dialog when the "Show" button is clicked. This ViewModel class must inherit from ViewerViewModelBase<T> which is found in the WindowsAzureMmc.ServiceManagement dll referenced above. T in this case will be your actual view with all of the XAML markup.
- The next part was easy, to get the perfmon counter data we just needed to override the OnSearchAsync and OnSearchAsyncCompleted methods from the ViewerViewModelBase type which takes care of making the calls to the Azure APIs and retrieving the data.
- Now for the fun part, we still had to get the data in the proper structure to be readable by perfmon and PAL. To do this we wrote an Export command (see Code Snippet 1) that would be triggered from the pop up in the same way it is triggered to export to excel. The only difference is in this case we take all the incoming performance counter data and group it first by tickcount and then map that back to the unique columns which are created as "RoleName\RoleInstance\CounterID" (see Code Snippet 2).
- Now that we had all the data restructured we needed to come up with a way to to take the new CSV output and get it into the native BLG perfmon format. Big thanks to my colleague Greg Varveris for the design approach here. All we needed to do was use a Process.Start command to run a conversion of the CSV file to BLG using relog.exe and then launch the resulting file with perfmon directly!
The Result
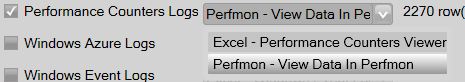
Once this DLL is built and dropped into the WindowsAzureMMC\release folder it is automatically picked up by the MMC and you will see a new option in the "Performance Counters Logs" drop down (note: if you drop the DLL in the release folder when the Azure MMC is already running you need to do a "refresh plugins" to get the new option to show up)
Now when you click on "Show" there will be a new dialog that opens and allows you to open the data directly in perfmon.

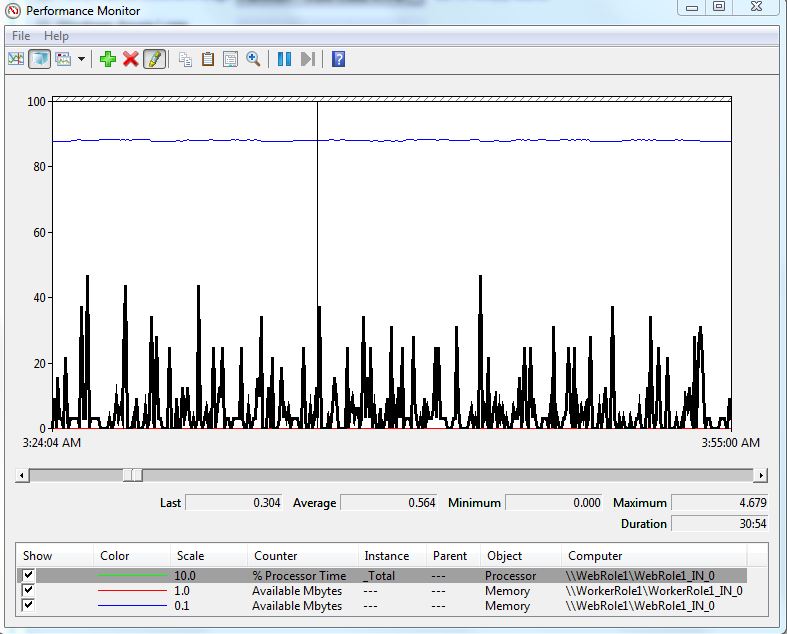
Here's a quick snapshot of the perfmon data. Notice it shows multiple roles, multiple instances, and multiple counters. There is no limitation to the amount of data you want to pull down from the MMC and show in perfmon!
On top of getting to open the data directly in perfmon you also will find that the data is being saved on disk for you to collect and store for later viewing or feed into a tool like PAL to determine if you have any bad resource usage trends. All you need to do is go to your C:\Users\%username%\AppData\Local\Temp and you will see the files there.
What Next?
We'd love to get feedback on this plug in and whether or not it was useful to you for reviewing your Azure application performance data. You can download it here: Windows Azure MMC Downloads Page
The Code
| Code Snippet 1: PerfmonFriendlyAzureLogViewModel.OnExport() |
private void OnExport() { string separator = base.ViewModels.ShowDialog<ListSeparatorSelectionViewModel, string>(new object[0]); if (separator != null) { string path = Path.Combine(Path.GetTempPath(), string.Format("PerfCountersLog-{0:yyyyMMdd-hhmmss}.csv", DateTime.Now)); string outputPath = Path.Combine(Path.GetTempPath(), string.Format("PerfCountersLog-{0:yyyyMMdd-hhmmss}.blg", DateTime.Now)); ObservableCollection<PerformanceCounterData> rows = PerfmonLogEntries; WritePerfLogCSV(rows, path, separator); //Use relog to convert the CSV into a BLG file that can be viewed by Perfmon Process.Start("relog.exe", path + " -f BIN -o " + outputPath); //This logic is necessary to avoid a condition where relog hasn't finished and perfmon tries to launch int timeout = 100; int running = 0; while (!File.Exists(outputPath)) { if (running > timeout) { throw new ApplicationException(string.Format("Unable to export to perfmon native blg format. Timeout of {0} occurred.", timeout)); } else { running += 1; System.Threading.Thread.Sleep(1000); } }
//Just launch the default program that uses .blg files and perfmon will show up Process.Start(outputPath); } } |
| Code Snippet 2: PerfmonFriendlyAzureLogViewModel.WritePerfLogCSV() |
internal struct PerfCounterDataElement { internal string counterID; internal double value; internal string roleName; internal string roleInstance; } public void WritePerfLogCSV(ObservableCollection<PerformanceCounterData> rows, string path, string separator) { using (StreamWriter writer = new StreamWriter(path)) { //The data will need to be restructured by the tick count from the Azure perf table to make it readable by perfmon Dictionary<Int64, List<PerfCounterDataElement>> reStructuredPerfLog = new Dictionary<Int64, List<PerfCounterDataElement>>(); PerfCounterDataElement pData; foreach (PerformanceCounterData d in rows) { pData = new PerfCounterDataElement(); pData.counterID = d.CounterId; pData.value = d.Value; pData.roleName = d.RoleName; pData.roleInstance = d.RoleInstance; List<PerfCounterDataElement> perfDataElementRow; if (reStructuredPerfLog.TryGetValue(d.EventTickCount, out perfDataElementRow)) { perfDataElementRow.Add(pData); } else { reStructuredPerfLog.Add(d.EventTickCount, new List<PerfCounterDataElement>()); reStructuredPerfLog[d.EventTickCount].Add(pData); } } //First we need to determine all of the unique headers available from all Roles, Role Instances, and //counter ids and add them to a dictionary that we will use to align column data with later. While //we are retrieving these unique headers we will write the first line of the CSV. string notImportant = string.Empty; Dictionary<string,string> counterHeadersLookupMap = new Dictionary<string,string>();
StringBuilder headerBuilder = new StringBuilder(); headerBuilder.Append("\""); headerBuilder.Append("(PDH-CSV 4.0) (GMT Daylight Time)(-60)"); headerBuilder.Append("\""); headerBuilder.Append(separator); foreach (KeyValuePair<Int64, List<PerfCounterDataElement>> kvpItem in reStructuredPerfLog) { foreach (PerfCounterDataElement pElem in kvpItem.Value) { string columnHeader = @"\\" + pElem.roleName + @"\" + pElem.roleInstance + pElem.counterID; if (!counterHeadersLookupMap.TryGetValue(columnHeader, out notImportant)) { counterHeadersLookupMap.Add(columnHeader, string.Empty); headerBuilder.Append("\""); headerBuilder.Append(columnHeader); headerBuilder.Append("\""); headerBuilder.Append(separator); } } } writer.WriteLine(headerBuilder.ToString()); //Now that we have all the columns positioned we can do nested loop to align the data by the header //lookup map foreach (KeyValuePair<Int64,List<PerfCounterDataElement>> kvp in reStructuredPerfLog) { StringBuilder rowBuilder = new StringBuilder(); rowBuilder.Append("\""); rowBuilder.Append(string.Format("{0:MM/dd/yyyy hh:mm:ss.fff}", new DateTime(kvp.Key))); rowBuilder.Append("\""); rowBuilder.Append(separator); foreach (KeyValuePair<string, string> columnMap in counterHeadersLookupMap) { foreach (PerfCounterDataElement pElem in kvp.Value) { if (columnMap.Key == @"\\" + pElem.roleName + @"\" + pElem.roleInstance + pElem.counterID) { rowBuilder.Append("\""); rowBuilder.Append(pElem.value.ToString()); rowBuilder.Append("\""); } } rowBuilder.Append(separator); } writer.WriteLine(rowBuilder.ToString()); }
writer.Flush(); writer.Close(); } } |