Tabbed View Report using SSRS
SQL Server Reporting Services (SSRS) is an excellent reporting tool for various business needs. It provides a unified, server-based, extensible, and scalable platform from which to deliver and present information. Its scope extends from traditional paper reports to web-based delivery and interactive content. This article will explain about creating a SSRS report with tabbed view. Tabbed controls are not available as out of the box controls in SSRS report builder.
Suppose take an example employee database which stores their professional summary, salary information, personal information, etc. The end user will search for an Employee by Emp ID as the parameter only one time and the result will be displayed in a tabbed view like professional summary in one tab, salary in another tab and personal information in another tab. Each tab should be clickable and when a Tab1 is clicked, other Tab result should be hidden. In the similar way, show and hide data should work for all the other tabs.
It will be cool to implement this feature in SSRS without writing single line of code. Let's implement it!
- SSRS installed in SharePoint Integrated Mode (you can choose SSRS in SQL native mode as well)
- Sample Database (I will use Adventure Works DW 2012 database, "DimEmployee" table)
- Report Builder for designing the report
Open the report builder, create data connection to the Adventure Works DW 2012 database and create a data set as shown below:

The SQL code used in the dataset is:
/****** Script for  SelectTopNRows command from SSMS  ******/

DECLARE @EMPLOYEE_ID AS VARCHAR(20)
SET @EMPLOYEE_ID = '690627818'

SELECT EmployeeNationalIDAlternateKey
      ,SalesTerritoryKey
      ,FirstName
      ,LastName
      ,MiddleName
      ,Title
      ,HireDate
      ,BirthDate
      ,LoginID
      ,EmailAddress
      ,Phone
      ,MaritalStatus
      ,EmergencyContactName
      ,EmergencyContactPhone
      ,SalariedFlag
      ,Gender
      ,PayFrequency
      ,BaseRate
      ,VacationHours
      ,SickLeaveHours
      ,CurrentFlag
      ,SalesPersonFlag
      ,DepartmentName
      ,StartDate
      ,EndDate
      ,Status
  FROM AdventureWorksDW2012.dbo.DimEmployee
  WHERE EmployeeNationalIDAlternateKey = @EMPLOYEE_ID
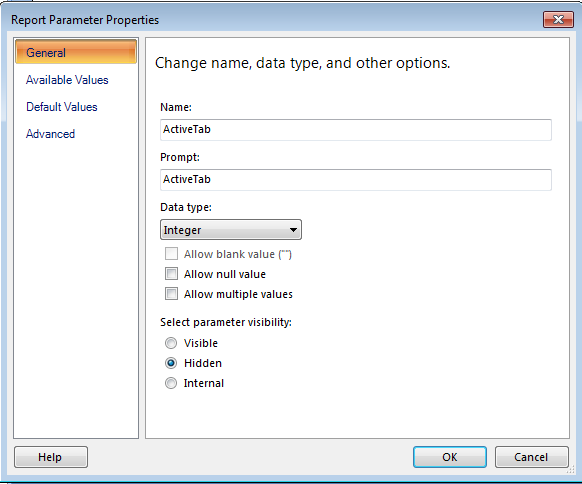
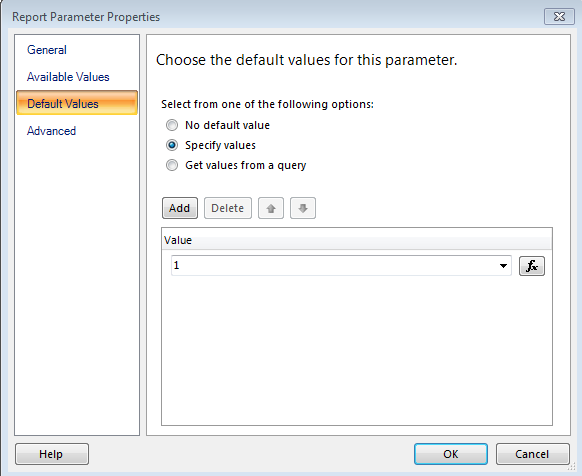
Comment the variable declaration and assignment while adding to the dataset in report builder. When you comment the variable declaration and assignment and save the dataset, it will automatically create the parameter in the Parameters section. Create another parameter named “ActiveTab” with Integer as Data Type which is hidden parameter and it will be used to store the value of the tab which is active in the report. Set the default value to “1” for this parameter.
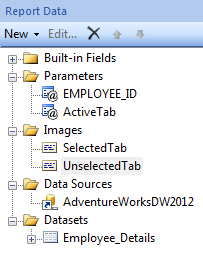
Let’s add two images (Unselected Tab and Selected Tab) in the images section for adding it for the Tab backgrounds.


Now, the report data in the designer should look this:
Let’s create three tabs for this example:
- Tab1 –Personal Info (First Name, Middle Name, Last Name, DOB, Email Address, Phone, Marital Status, Phone, Emergency Contact)
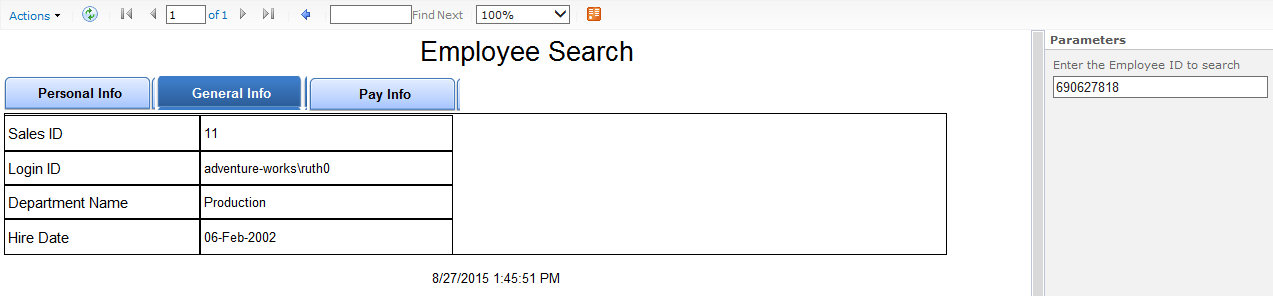
- Tab2 –General Info(Sales Territory Key, Title, Hire Date, Login ID, Department Name )
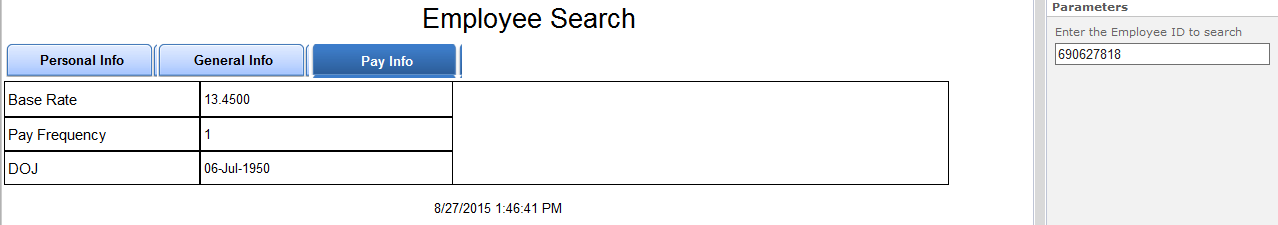
- Tab3 –Pay Info(Base Rate, Pay Frequency, DOJ)
Note: If you have more than one dataset, you can display different datasets in different tabs with the Employee ID as the primary key in all datasets. To illustrate the example, I am using a single dataset
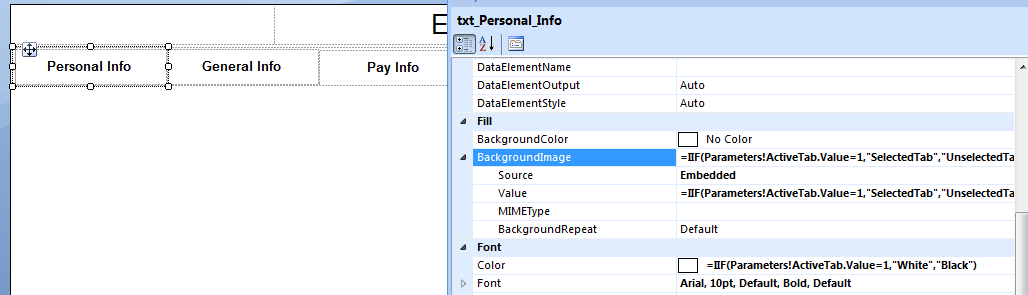
Add a rectangle in the report design and then add three text boxes within it. In each text box – Background Image property, add the below expression as the value. If the tab is active, then the tab should highlight with Selected Tab Image and others should be Unselected Tab Image. Follow the same steps for the other two text boxes.
IIF(Parameters!ActiveTab.Value=1,"SelectedTab","UnselectedTab")
      IIF(Parameters!ActiveTab.Value=2,"SelectedTab","UnselectedTab")
      IIF(Parameters!ActiveTab.Value=3,"SelectedTab","UnselectedTab")
In the same way, add the following expression for color:
      IIF(Parameters!ActiveTab.Value=1,"White","Black")
      IIF(Parameters!ActiveTab.Value=2,"White","Black")
      IIF(Parameters!ActiveTab.Value=3,"White","Black")
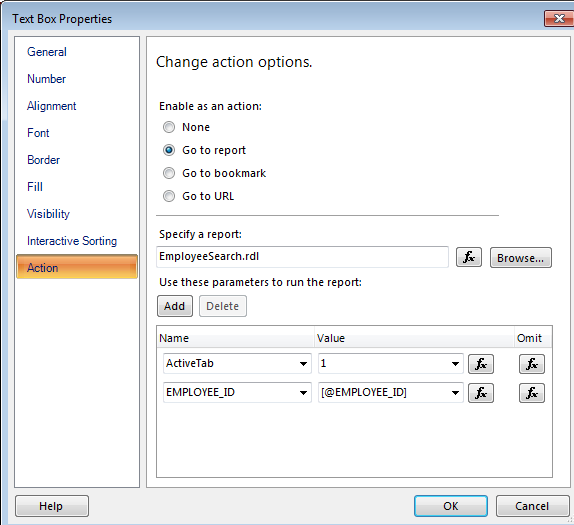
To make Personal Info tab clickable, click on Personal Info properties -> Action -> Change action options -> Go to report -> Specify the report name (in my case it is EmployeeSearch).
Then add two parameters one is Active Tab with the value as ‘1’ and other Employee ID with Employee ID parameter created as shown below:
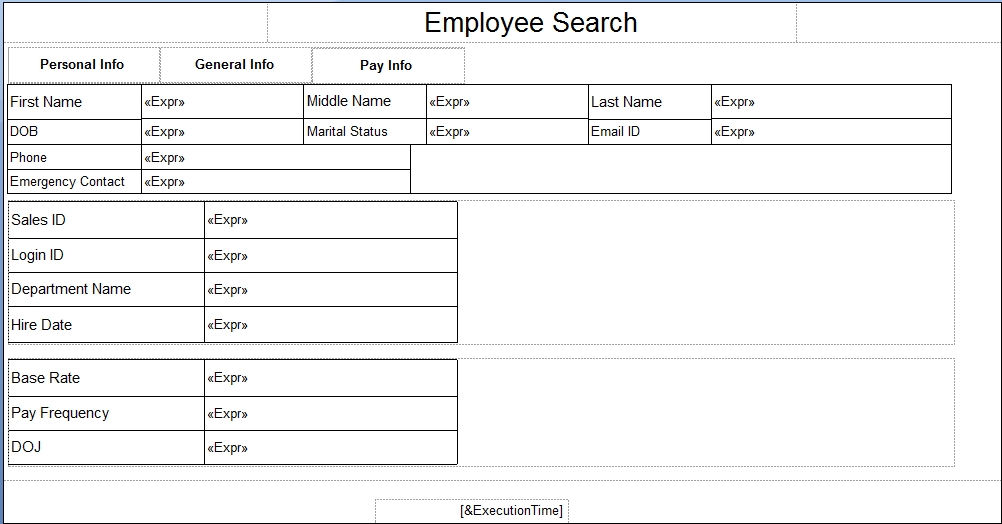
Follow the same steps for the other two tabs with Active Tab values 2 and 3.Now, add the data for the tab 1. Insert a rectangle and add the data for tab 1. In the same way, add the data for tab 2 and 3 respectively. The entire design will look as shown below:
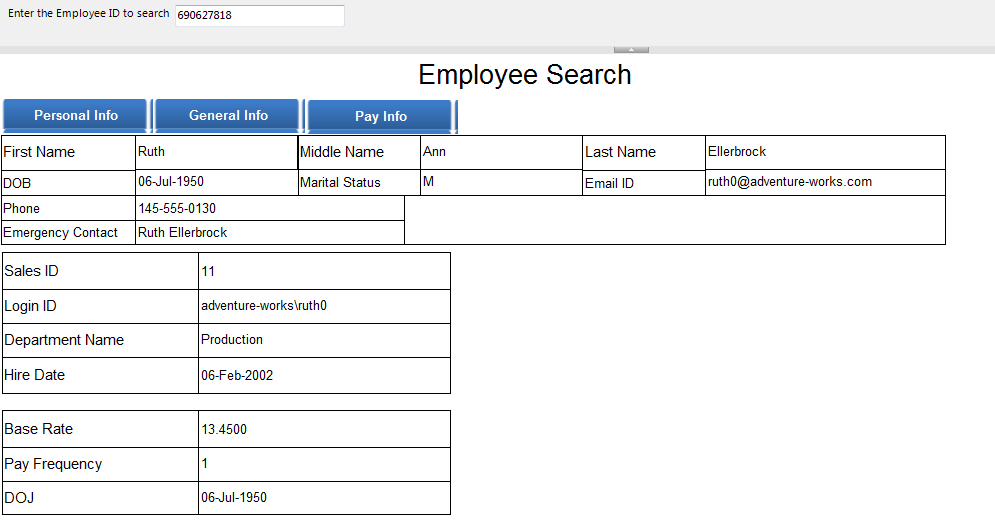
If you run the report by entering the Emp ID in the search parameter, it will display all the grids in a same page as shown below:
We need to add an expression in each grid to hide and show the grids depending upon the selected tab. Click on the first grid and select properties and add the following expression for hide and show as shown below:
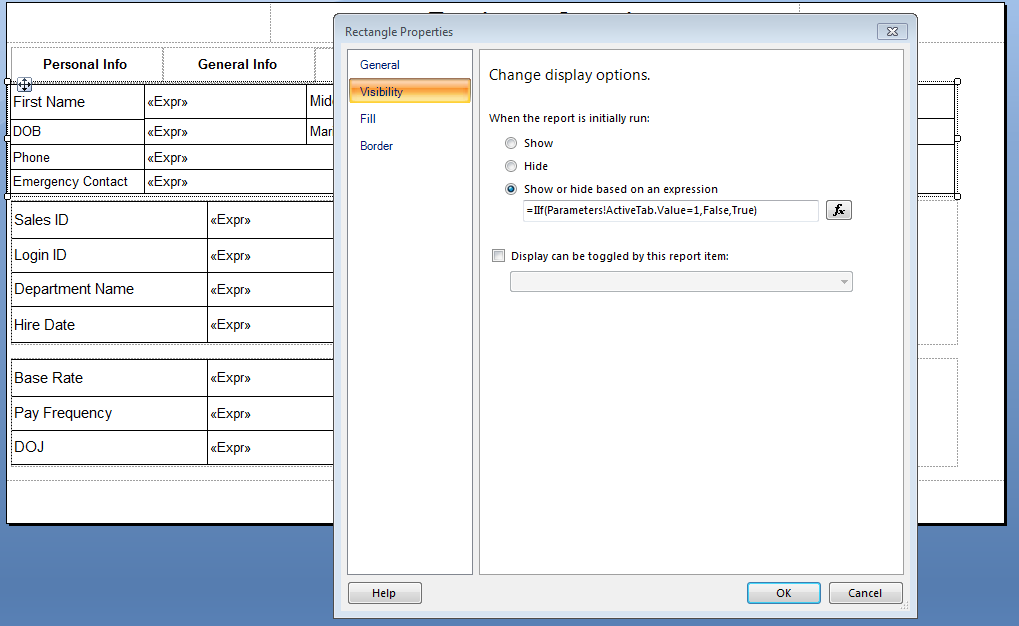
All the three expressions are as follows:
IIf(Parameters!ActiveTab.Value=1,False,True)
IIf(Parameters!ActiveTab.Value=2,False,True)
IIf(Parameters!ActiveTab.Value=3,False,True)
Let’s format the report and now search for an EMP ID:
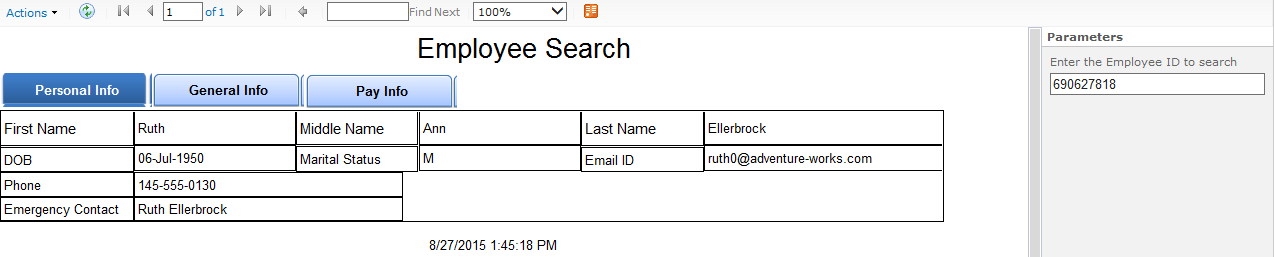
Not a single piece of code is written but we were able to create a tabbed view of data in SSRS. Cool isn’t it? This shows one of the capabilities of SQL Server Reporting Services (SSRS) in Business Intelligence.
If the data is from different data sources / business objects, then this solution will be more powerful.