Gantt Viewer
Message Analyzer provides the Gantt viewer, which is currently a preview feature. If you wish to use the Gantt viewer, you will need to select its check box on the Features tab of the Options dialog, which is accessible from the global Tools menu, and then restart Message Analyzer. It will then be available for selection in the New Viewer drop-down list on the global Message Analyzer toolbar.
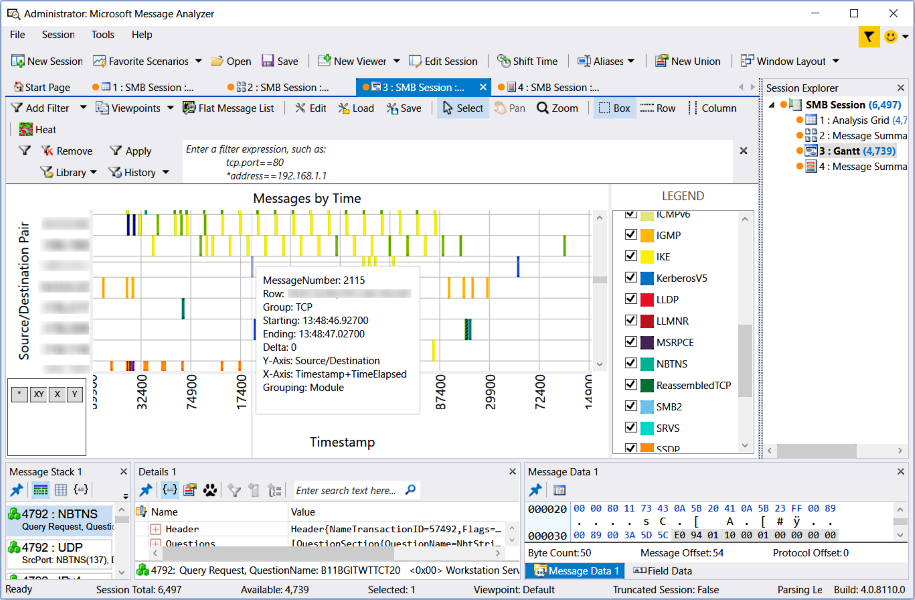
The Gantt viewer is an alternate graphic data visualizer that you can select when analyzing your message data. The Gantt viewer provides an at-a-glance view of message dispersion across a trace timeline that is presented as color-coded protocol module identifiers, with source/destination address message pairs in the y-axis orientation and timestamps in the x-axis orientation. The Gantt viewer also provides axis expansion and contraction controls to facilitate zooming into and out of data points. The Gantt viewer enables you to determine how long any operation takes to complete with respect to Timestamp axis values in the display and provides this data in the context of the completion times of other operations. The figure that follows shows an example of the Gantt viewer.

Figure 45: Gantt Viewer
To enhance data analysis capabilities the Gantt viewer toolbar provides the following features:
Edit — click this button to open the Gantt Configuration Editor dialog, from where you can reconfigure the viewer layout, which includes the Horizontal Axis and Vertical Axis Label and Layout configuration; and the Legend and Heatmap configurations.
Load — enables you to load data into the current Gantt viewer display from a previously saved .gantt file.
Save — enables you to save data from the current Gantt viewer display to a .gantt file.
Select mode — click this button to select single messages in the Gantt analysis surface, for example, to display message field information in the Details Tool Window. The Select mode works together with the Box, Row, and Column toolbar items, which you can click individually to alter the highlighting orientation of the selection feature, as described in Using the Context Menu Commands.
Pan — not used.
Zoom mode — after clicking this button, you can zoom into one or more displayed messages by dragging a selection box around them, for example, to select a message and view Details and other data.
Box, Row, and Column options — see the descriptions under Selection Mode in Using the Context Menu Commands.
Heat — click this button to display the Heatmap Configuration dialog, from where you can specify the following settings:
Use Heatmap — when you select this check box in the Heatmap Configuration dialog, the settings you make in the dialog take effect after you click OK to exit the dialog.
Field — by clicking the ellipsis (…) to the right of the Field text box, you can display the Field Chooser Tool Window, from where you can select an annotation, property, flag, or other data field for any message in the dialog that you want to highlight with Heatmap settings in the analysis surface.
Observed — provides an indication of the number of messages highlighted with the specified Heatmap settings.
Minimum/Maximum Heat — provides writeable text boxes in which you can specify Minimum and Maximum values for the Heatmap highlight settings.
The Gantt viewer also provides several context menu commands that are available by right-clicking anywhere on the main analysis surface. The commands that display and the functions they perform are described as follows:
Mouse Mode — provides a submenu that contains the Select and Zoom items, where one of these modes will always be selected.
Selection Mode — provides a submenu that has the following options that you can use as indicated:
Box — sets the selection mode to the box shape for selecting one or more messages nodes.
Row — sets the selection mode to enable you to select messages in a Source/Destination Pair row orientation.
Column — sets the section mode to enable you to select messages in a Timestamp column orientation.
Zoom — provides several Zoom presets that enable you to alter the data presentation to focus on one or more messages.
Settings — enables you to change the data presentation format by alternately enabling or disabling various chart elements from submenu items that include Fixed Grid, Auto Scroll, and Display Limit settings.
View Message Range in ‘Analysis Grid’ — opens a selected range of messages in a separate instance of the Analysis Grid viewer.
View Time Range in ‘Analysis Grid’ — opens selected messages that fall within Gantt Timestamp column lines in a separate instance of the Analysis Grid viewer.
Add Rows to Filter — enables you to create a view Filter from selected messages in particular rows.
Opaque Items — enables you to alter the data presentation format by alternately applying and removing an opaque value to all message colors in the Gantt chart grid.
The Gantt viewer also contains a Legend that provides a list of check boxes that correspond to the protocols or modules for which messages were captured in the trace results displayed in the Gantt analysis surface. To focus on messages from one or more particular protocols or modules, unselect all the ones for which you do not want to view data.