Note
Access to this page requires authorization. You can try signing in or changing directories.
Access to this page requires authorization. You can try changing directories.
These are the latest features in the Stable release of Microsoft Edge DevTools.
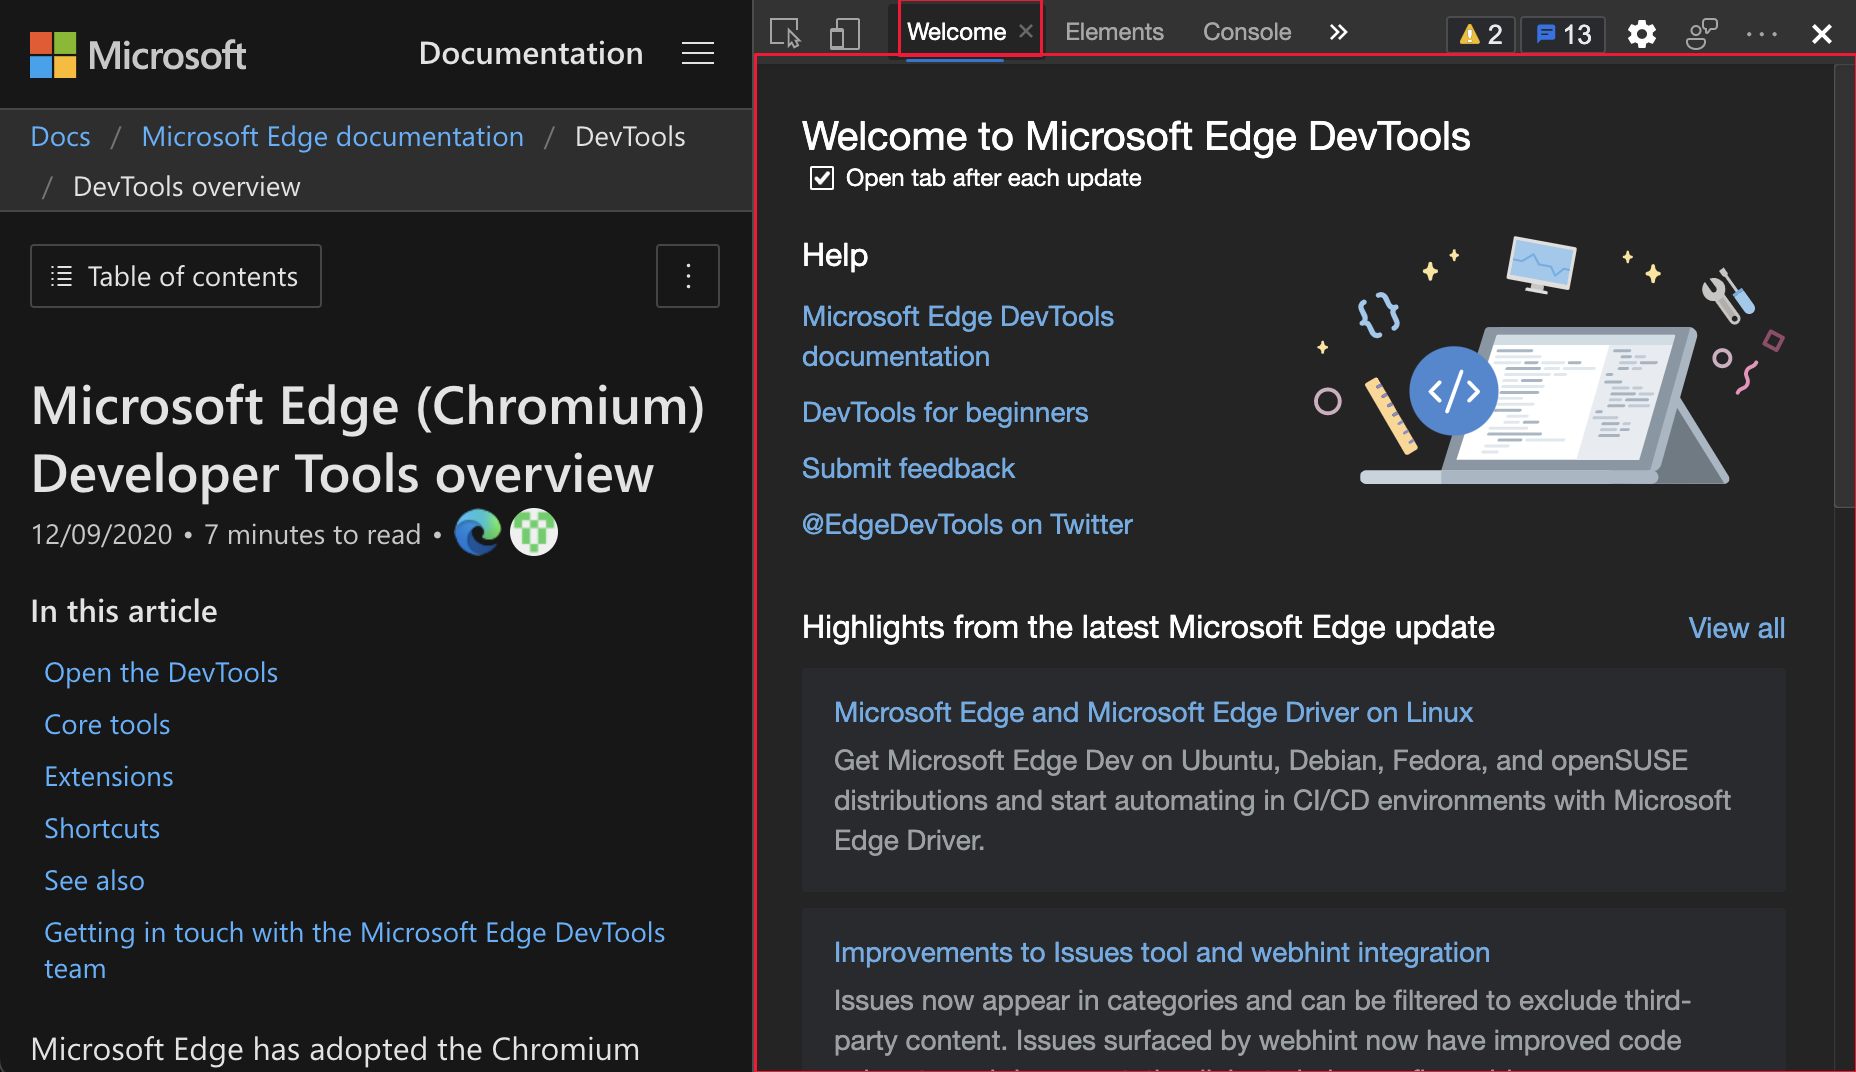
What's New is now Welcome
The What's New tool in the Microsoft Edge DevTools now has a new appearance and a new name: Welcome. The Welcome tool still displays the latest DevTools news and updates. It now also includes links to Microsoft Edge DevTools documentation, ways to submit feedback, and more. To display the Welcome tool after each update to Microsoft Edge, select the checkbox next to Open tab after each update under the title.
To close the Welcome tool, click the X on the right-side of the tab title.
Update: This feature has been released and is no longer experimental.
See also:
Visual Font Editor in the Styles pane

When you work with fonts in CSS, use the new visual Font Editor. You can define fallback fonts, and use sliders to define font weight, size, line-height, and spacing:
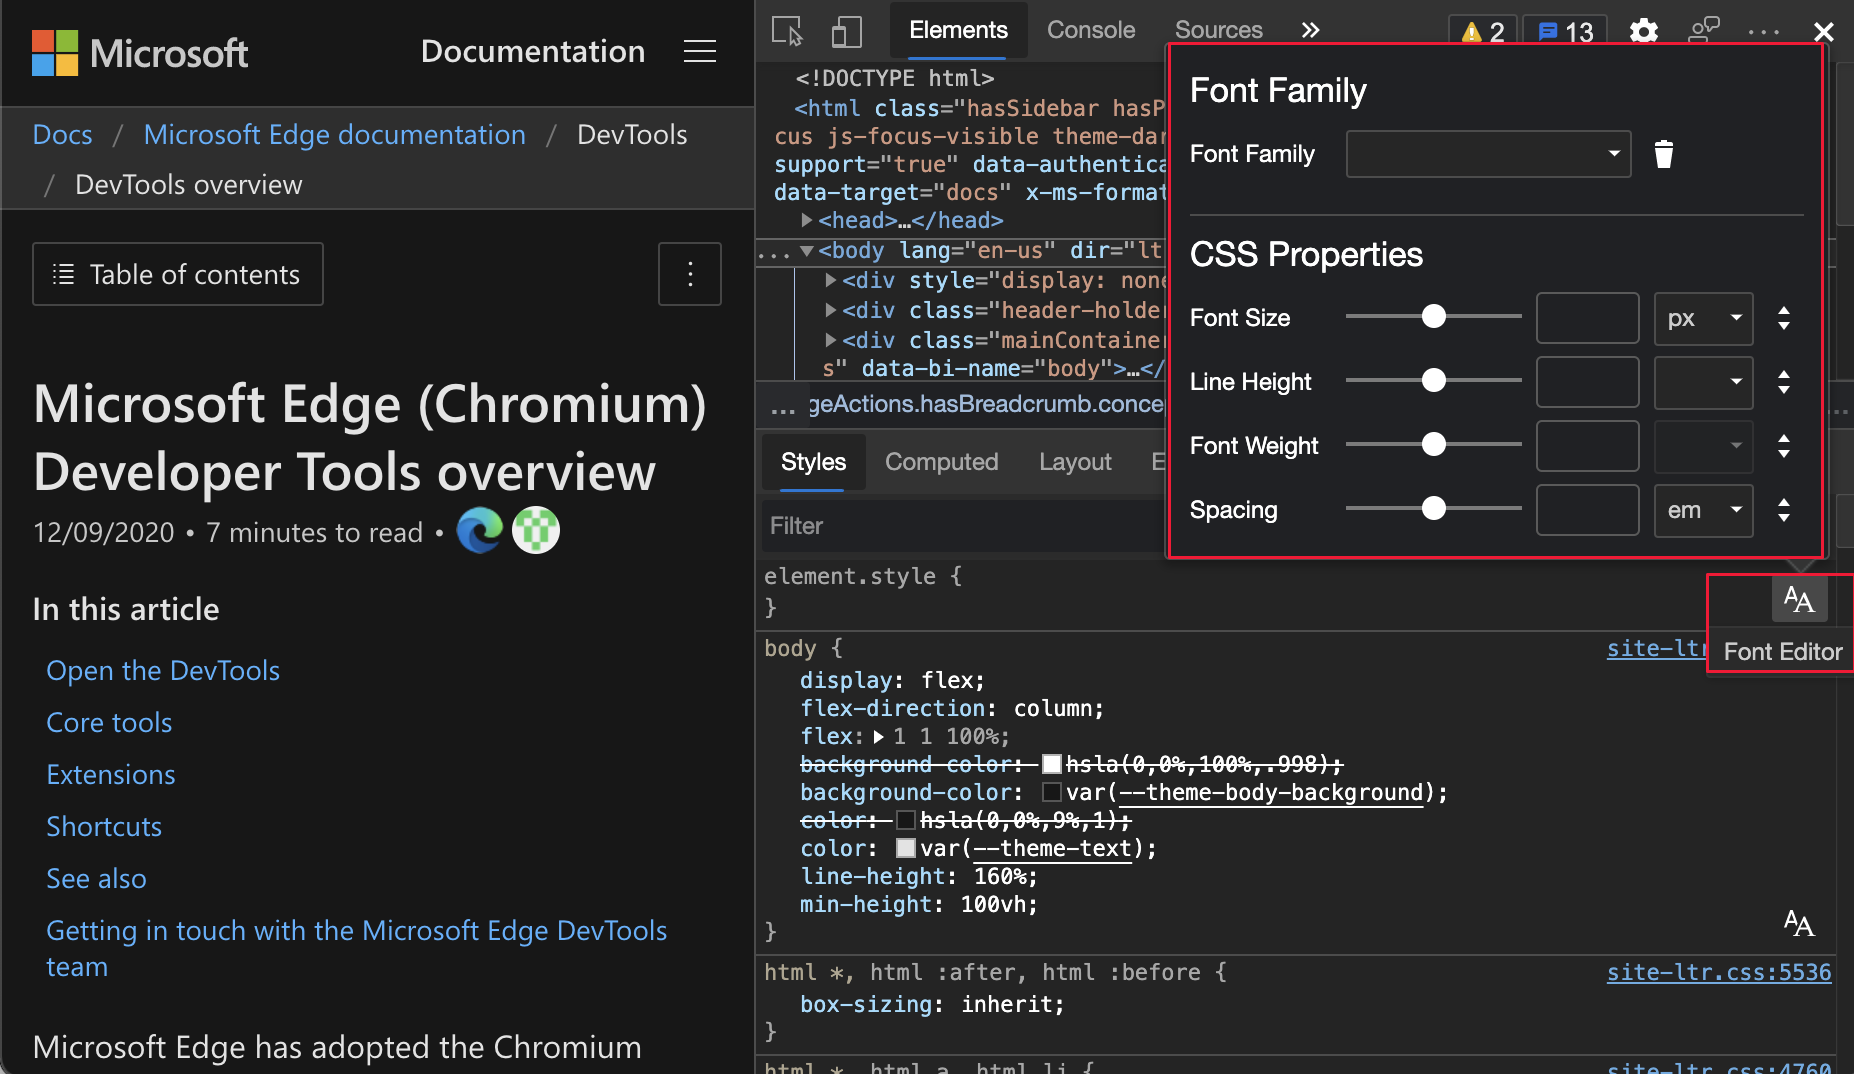
The Font Editor helps you to:
- Switch between units for different font properties.
- Switch between keywords for different font properties.
- Convert units.
- Generate accurate CSS code.
To turn on this experiment, see Settings > Experiments and select the checkbox next to Enable new Font Editor tools within Styles pane.
For the history of this feature in the Chromium open-source project, see Issue 1093229.
See also:
- Enable new font editor within the Styles tab in Experimental features in Microsoft Edge DevTools.
- Edit CSS font styles and settings in the Styles pane in DevTools.
CSS Flexbox debugging tools
DevTools now support Flexbox layout, as well as Grid layout.
Update: This feature has been released and is no longer experimental.
See also:
- Getting element information from the Inspect overlay in Analyze pages using the Inspect tool.
- Use the Inspect tool to detect accessibility issues by hovering over the webpage.
- Update .css files from within the Styles tab (CSS mirror editing).
Grid:
- CSS grids
- Improved CSS Grid tooling in What's new in DevTools (Microsoft Edge 87).
MDN:
For history, in the Chromium open-source project, see Issues 1136394 and 1139949.
New Flexbox (flex) icon helps identify and display flex containers
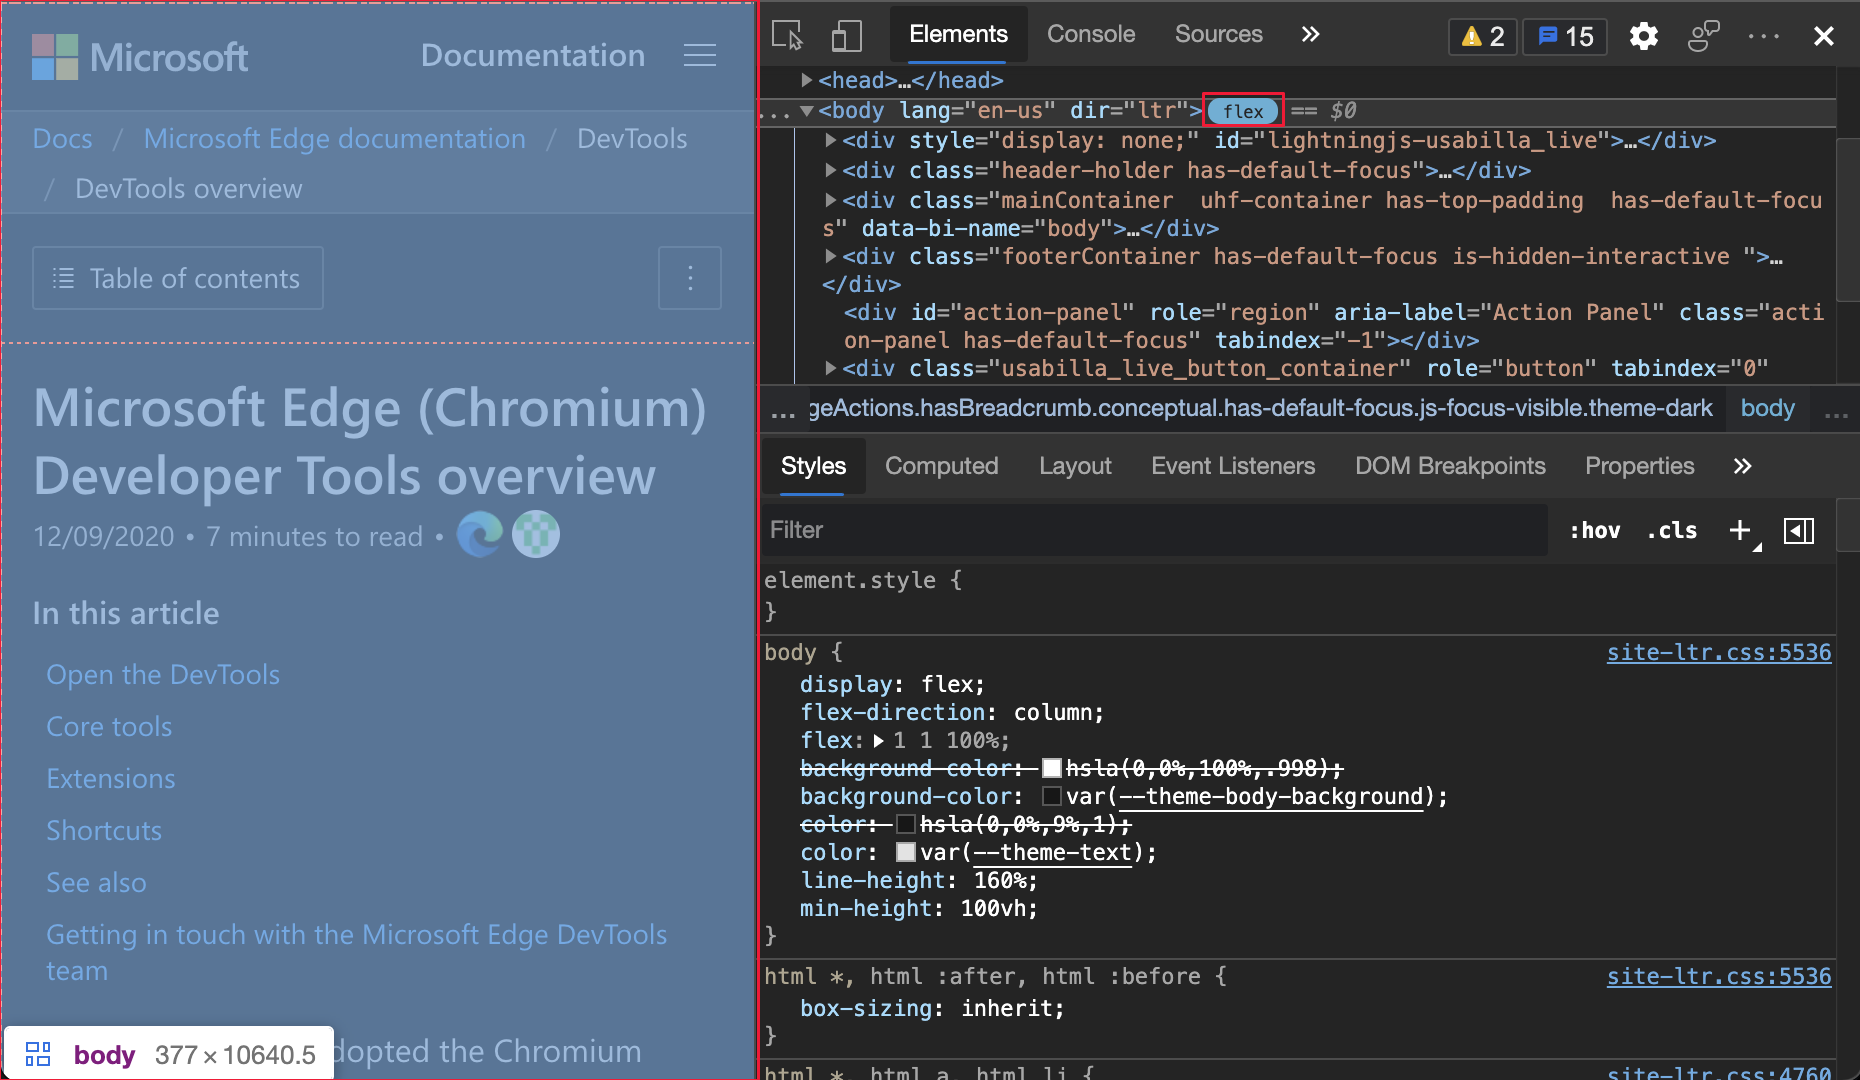
In the Elements tool, the new Flexbox (flex) icon helps you identify Flexbox containers in your code. Click the Flexbox (flex) icon to turn on or off the overlay effect that outlines a Flexbox container. You can customize the color of the overlay in the Layout pane, which is located next to Styles and Computed.
To turn on and off the overlay effect that outlines the Flexbox container, click the Flexbox (flex) icon.
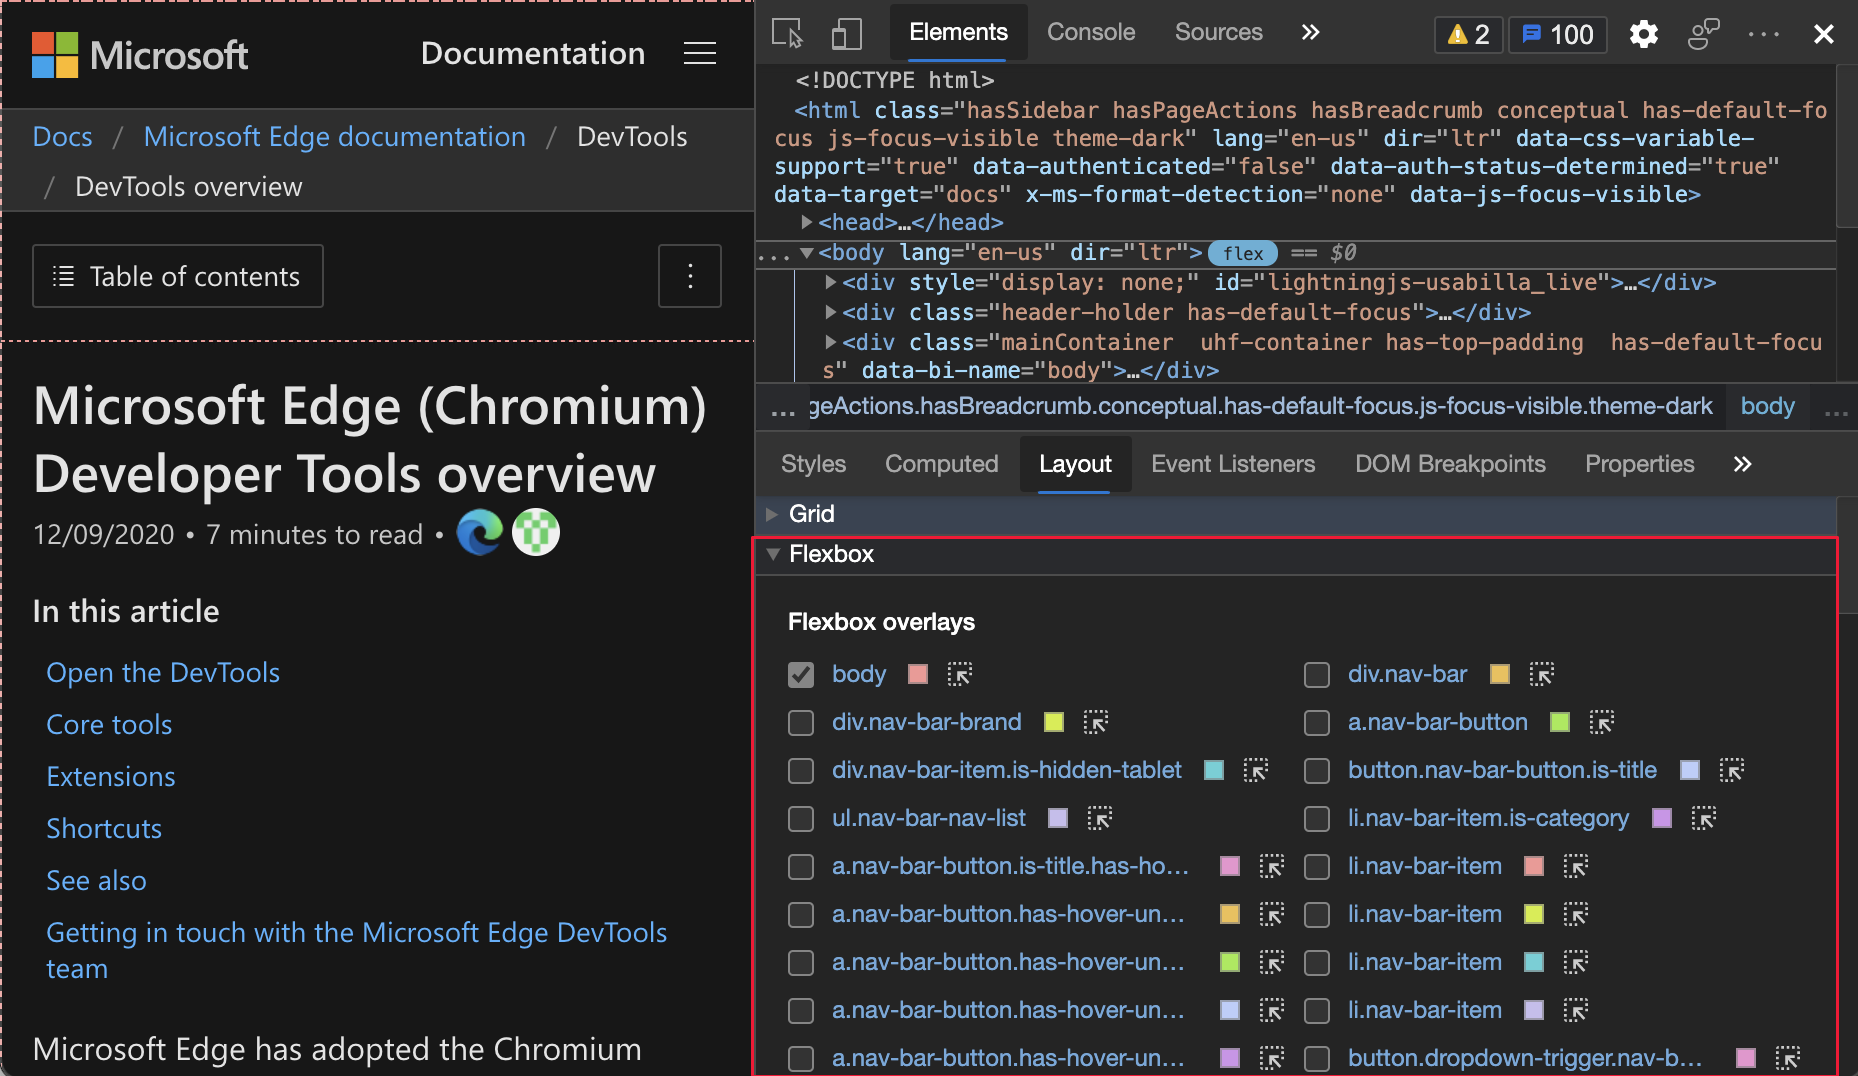
You can customize the color of the overlay in the Layout pane next to Styles and Computed.
The Flexbox (flex) icon and webpage highlighted:
The Flexbox overlays highlighted in the Layout pane:
Update: This feature has been released and is no longer experimental.
See also:
- Getting element information from the Inspect overlay in Analyze pages using the Inspect tool.
- Inspect CSS Grid layouts.
Display alignment icons and visual guides when Flexbox layouts change using CSS properties
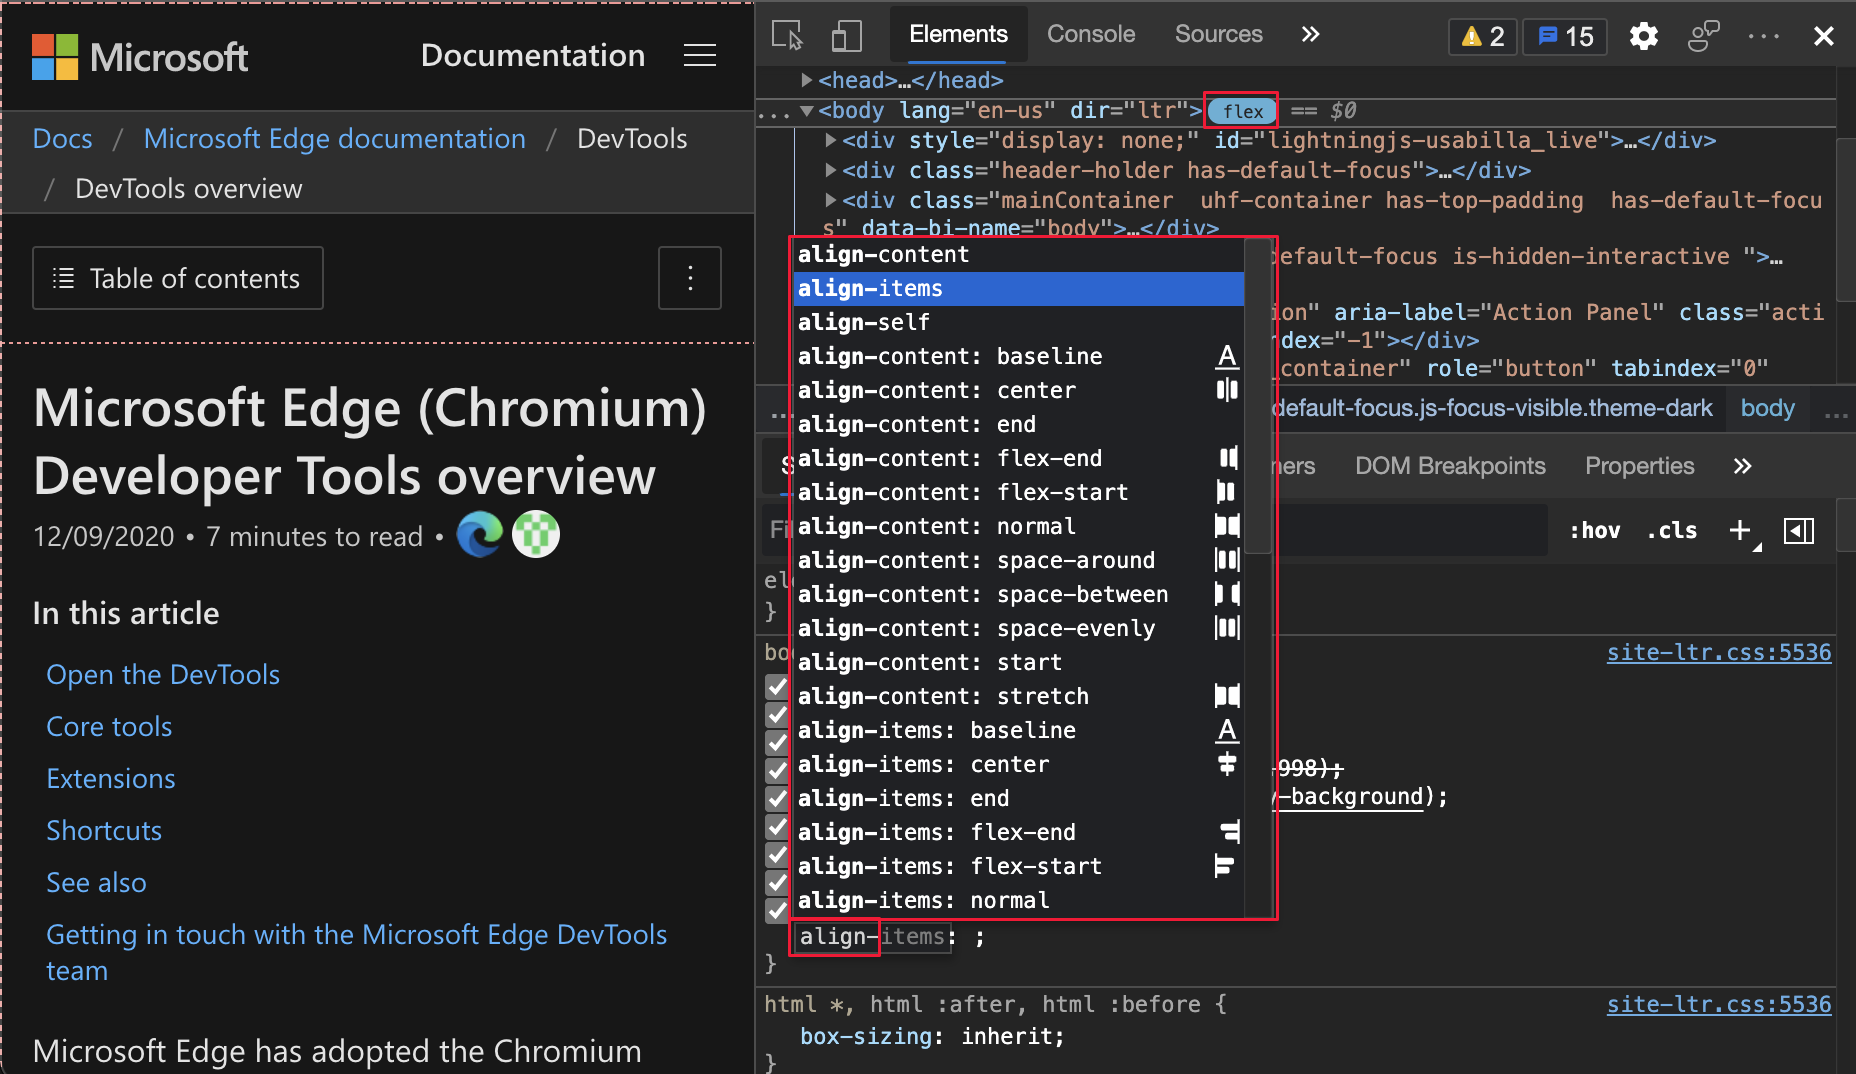
When you edit CSS for your Flexbox layout, CSS autocompletes in the Styles pane now displays helpful icons next to relevant Flexbox properties. To try this new feature, open the Elements tool and select a flex container. Then add or change a property on that container in the Styles pane.
The autocomplete menu now displays icons that indicate the effect of alignment properties such as align-content and align-items.
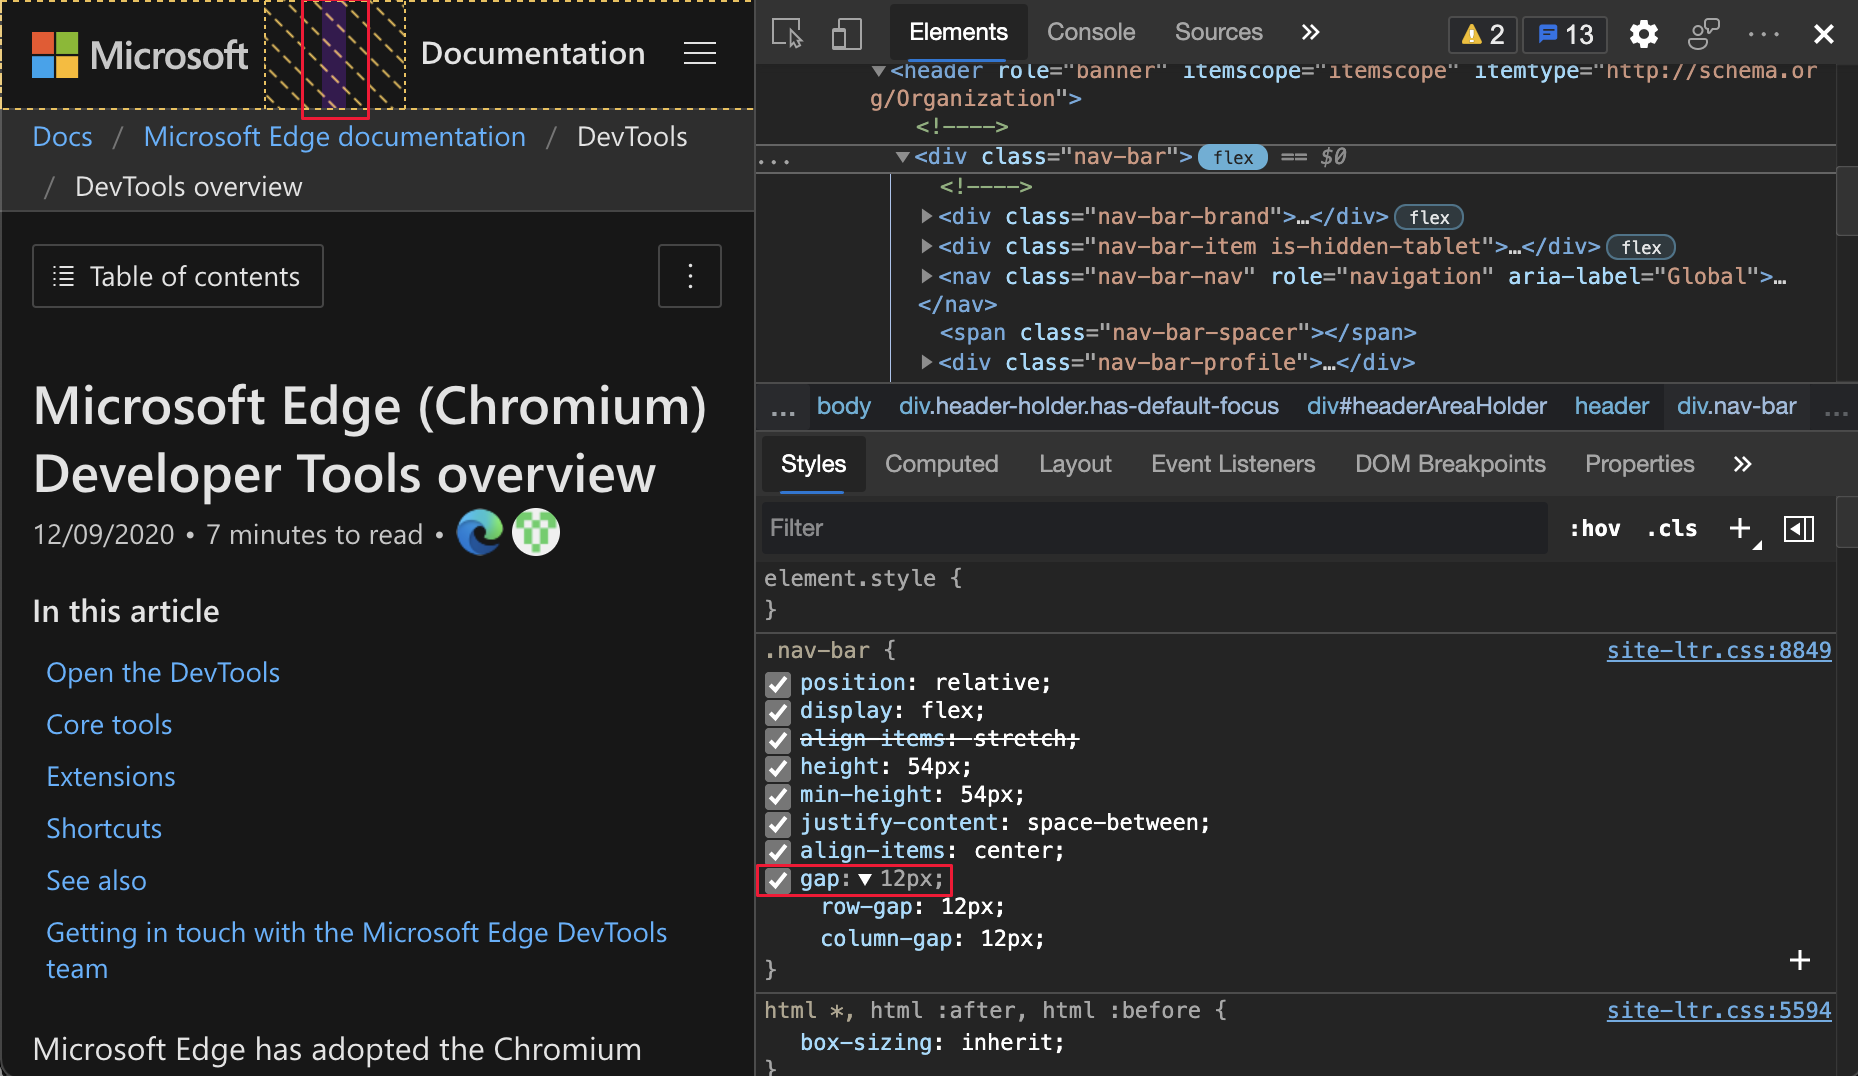
Additionally, DevTools now displays a guiding line to help you better see the align-items CSS property. The gap CSS property is supported as well. In the following figure, the gap CSS property is set to gap: 12px; and the hatching pattern for each gap is displayed.
Autocomplete menu highlighted for CSS properties that start with align-:
Flexbox gap in CSS properties and webpage highlighted:
Update: This feature has been released and is no longer experimental.
See also:
- Getting element information from the Inspect overlay in Analyze pages using the Inspect tool.
- Inspect CSS Grid layouts.
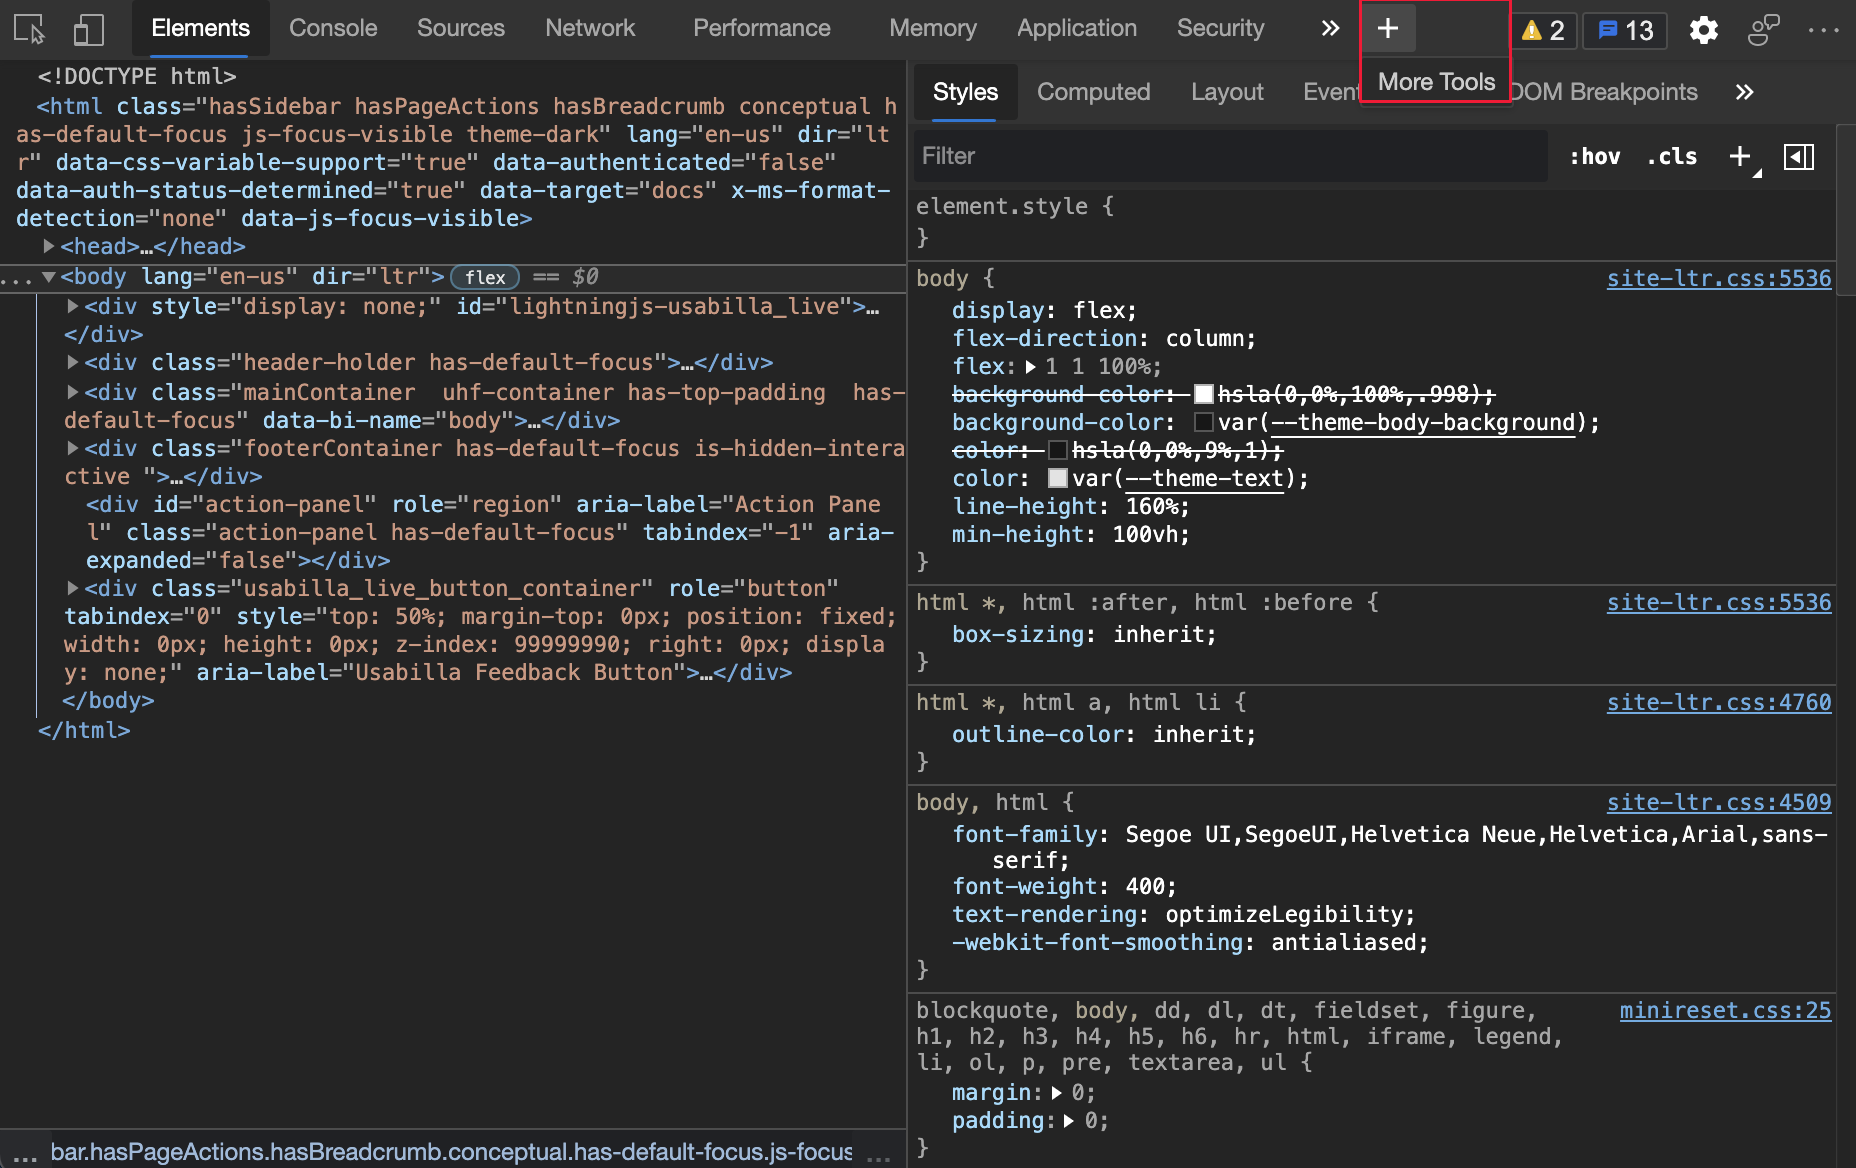
Add tools quickly with new More Tools button
You now have a new way to open more tools in Microsoft Edge DevTools. The More Tools icon is a plus sign (+) to the right of the main panel. To show a list of other tools that you can add to the main panel, click the More Tools (+) icon:
Update: This feature has been released and is no longer experimental.
See also:
Assistive technologies now announce position and count of CSS suggestions
When you edit CSS rules, you get a dropdown list of features. This feature wasn't available to users of assistive technologies, since it is announced in Microsoft Edge version 89. A user of assistive technologies can now navigate CSS suggestions in the Styles pane. In Microsoft Edge version 88 and earlier, assistive technology announced Suggestion as a user navigated through the list of suggestions when editing CSS in the Styles pane.
In Microsoft Edge version 89, a user of assistive technology now hears the position and count of the current suggestion. Each suggestion is announced as the user navigates through the list of suggestions, such as Suggestion 3 of 5. To learn more about writing CSS in DevTools, see CSS features reference. To view the history of this feature in the Chromium open-source project, see Issue 1157329.
To view a video that displays and reads aloud several suggestions with this experiment turned on, see Voiceover announcing devtools options on YouTube.
See also:
- Navigate the Styles pane in Navigate DevTools with assistive technology.
- CSS features reference
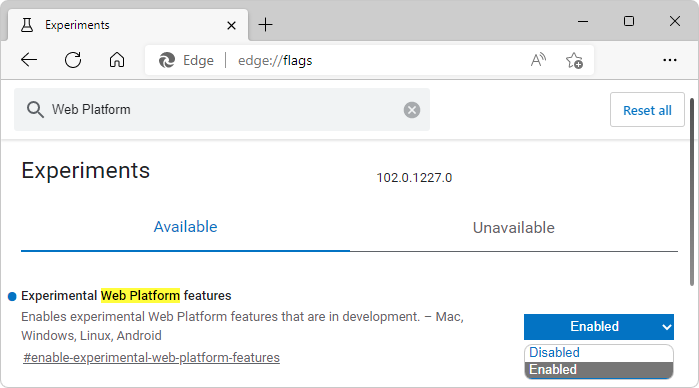
Emulate Surface Duo and Samsung Galaxy Fold
Test the appearance of your website or app on the following devices in Microsoft Edge.
- Surface Duo
- Samsung Galaxy Fold
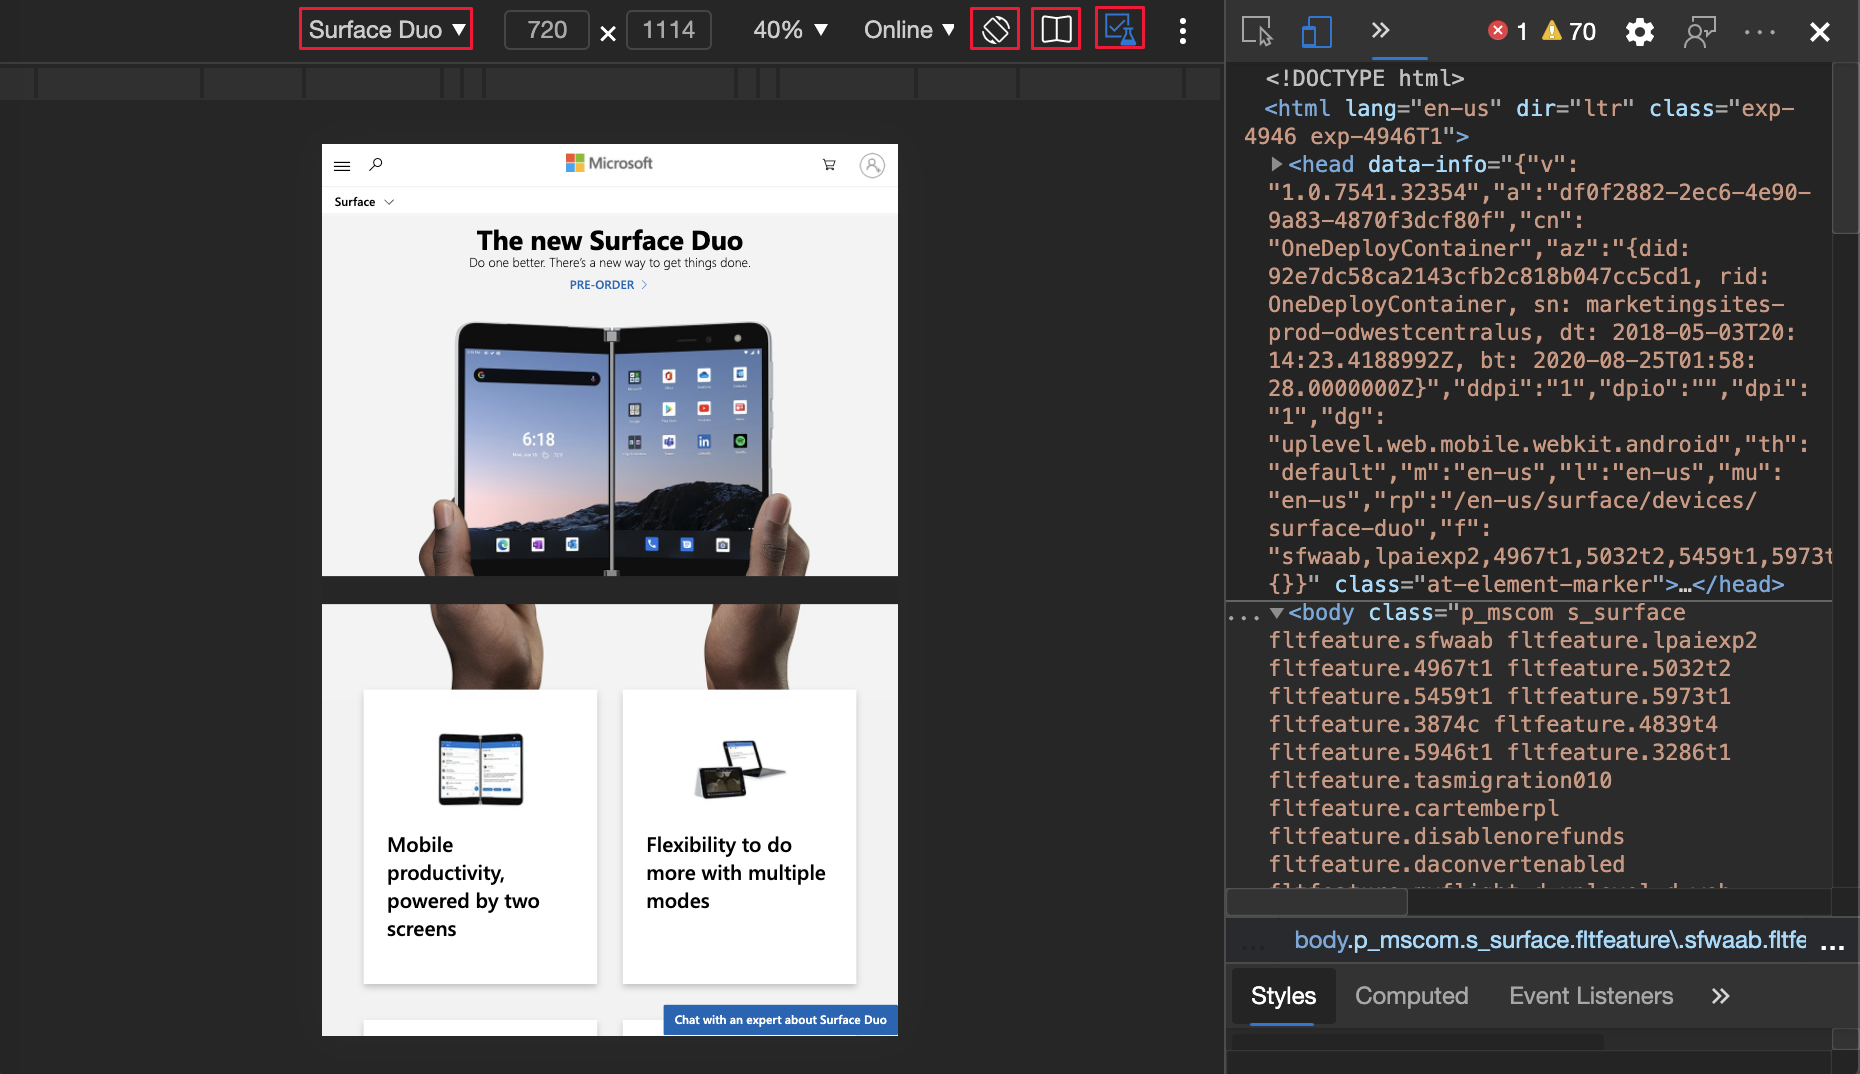
To access the new CSS media screen-spanning feature and the getWindowSegments (now visualViewport.segments) JavaScript API, go to edge://flags and toggle the flag next to Experimental Web Platform features:
To help enhance your website or app for the dual-screen and foldable devices, use the following features when emulating the device:
- Spanning, which is when your website (or app) appears across both screens.
- Rendering the seam, which is the space between the two screens.
For the history of this feature in the Chromium open-source project, see Issue 1054281.
See also:
- Emulate mobile devices (Device Emulation).
- CSS viewport segments media query for dual-screen detection - CSS media screen-spanning feature.
- JavaScript visualViewport.segments API for dual-screen devices.
Microsoft Edge Developer Tools for Visual Studio Code version 1.1.2
The Microsoft Edge Developer Tools for Visual Studio Code extension version 1.1.2 for Microsoft Visual Studio Code has the following changes since the previous release. Microsoft Visual Studio Code updates extensions automatically. To manually update to version 1.1.2, see Update an extension manually.
- Added a Close instance button to each item on the target list (#248)
- Bumped Microsoft Edge DevTools version from 84.0.522.63 to 85.0.564.40 (#235)
- Included "Debugger for Microsoft Edge" as a dependency (#233).
- Implemented settings option to change extension themes (#229)
You can file issues and contribute to the extension on the vscode-edge-devtools GitHub repo.
See also:
Announcements from the Chromium project
The following sections announce additional features available in Microsoft Edge that were contributed to the open-source Chromium project.
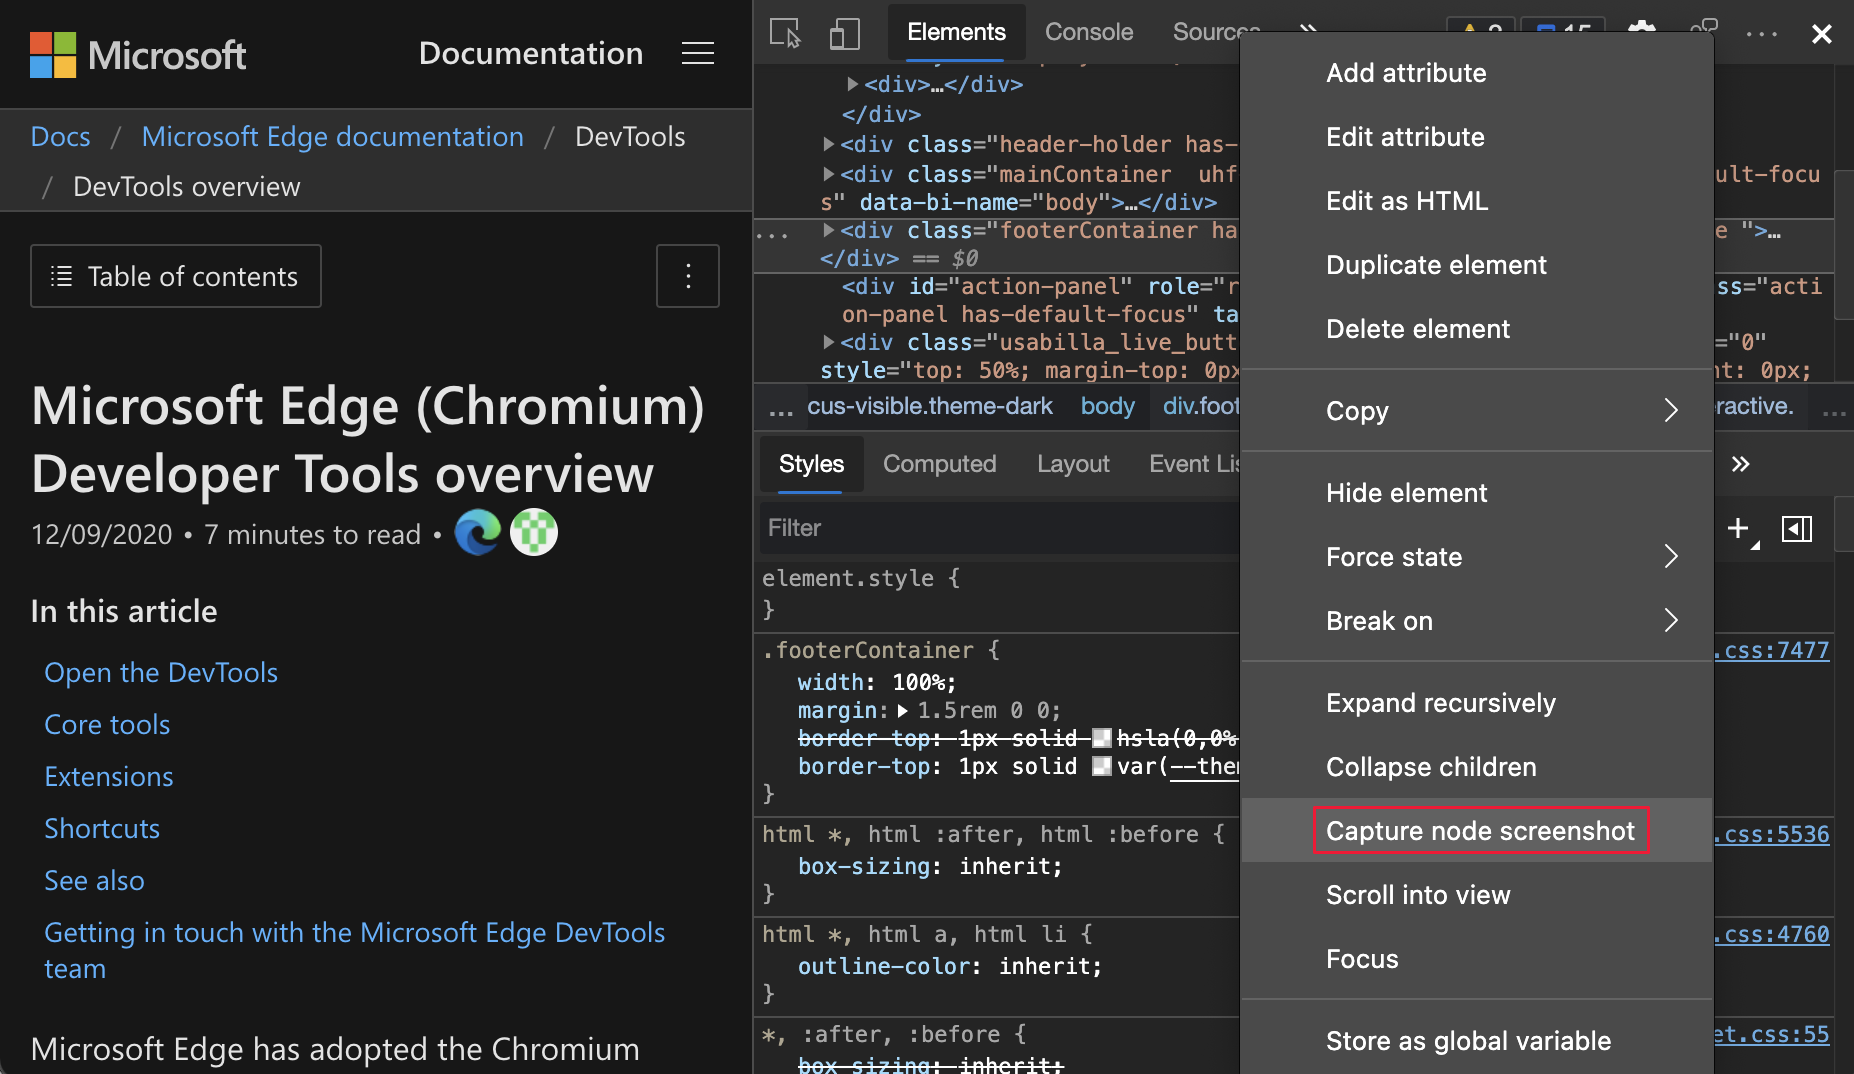
Capture node screenshot beyond viewport
In Microsoft Edge version 89, node screenshots are more accurate, capturing the full node even if content from the node isn't visible in the viewport. In the Elements tool, right-click an element, and then select Capture node screenshot.
For the history of this feature in the Chromium open-source project, see Issue 1003629.
See also:
- Capture node screenshots using the Elements tool context menu in What's new in DevTools (Microsoft Edge 86)
Elements tool updates
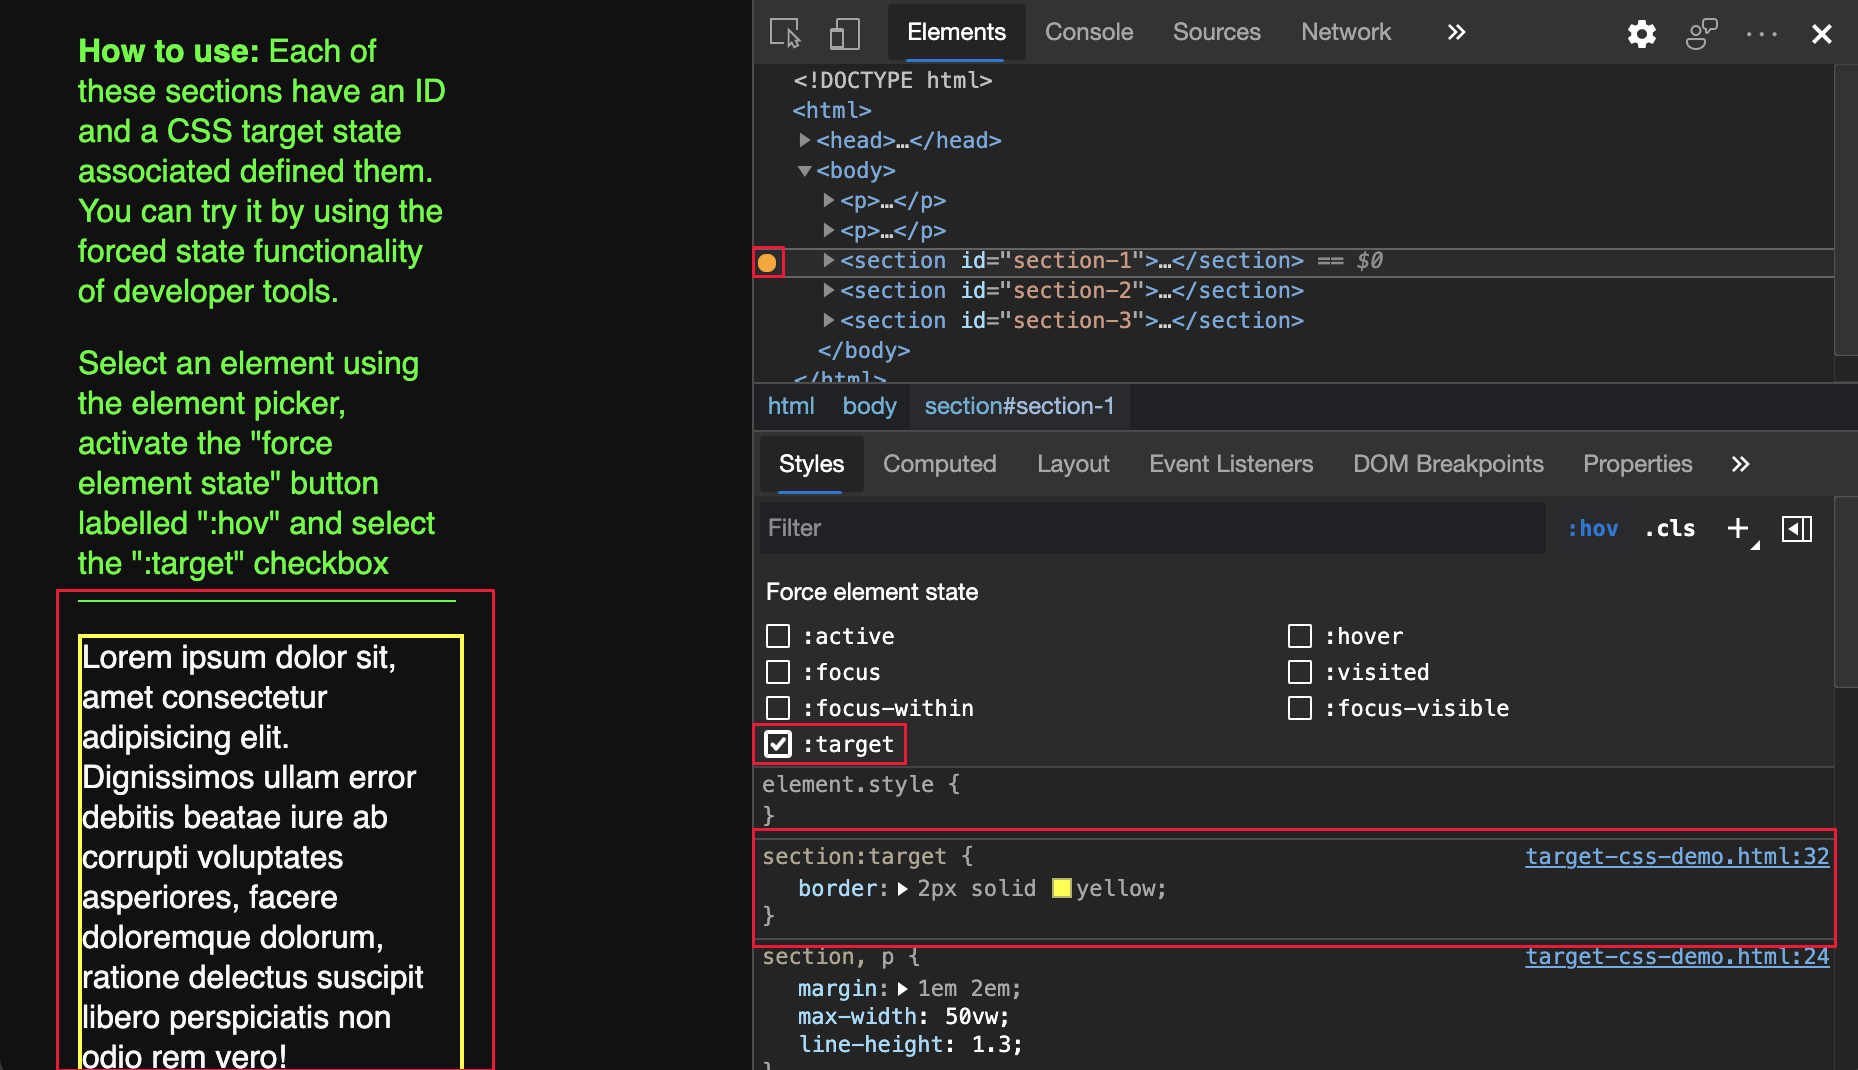
Support forcing the :target CSS state
In the Elements tool, you can now force the :target CSS pseudo-class. The :target pseudo-class is triggered when a unique element (the target element) has an id that matches a fragment of the URL. For example, the http://www.example.com/index.html#section1 URL triggers the :target pseudo-class on an HTML element with id="section1". To try a demo with section 1 highlighted, see CSS :target demo.
Webpage highlighted with no forced CSS:
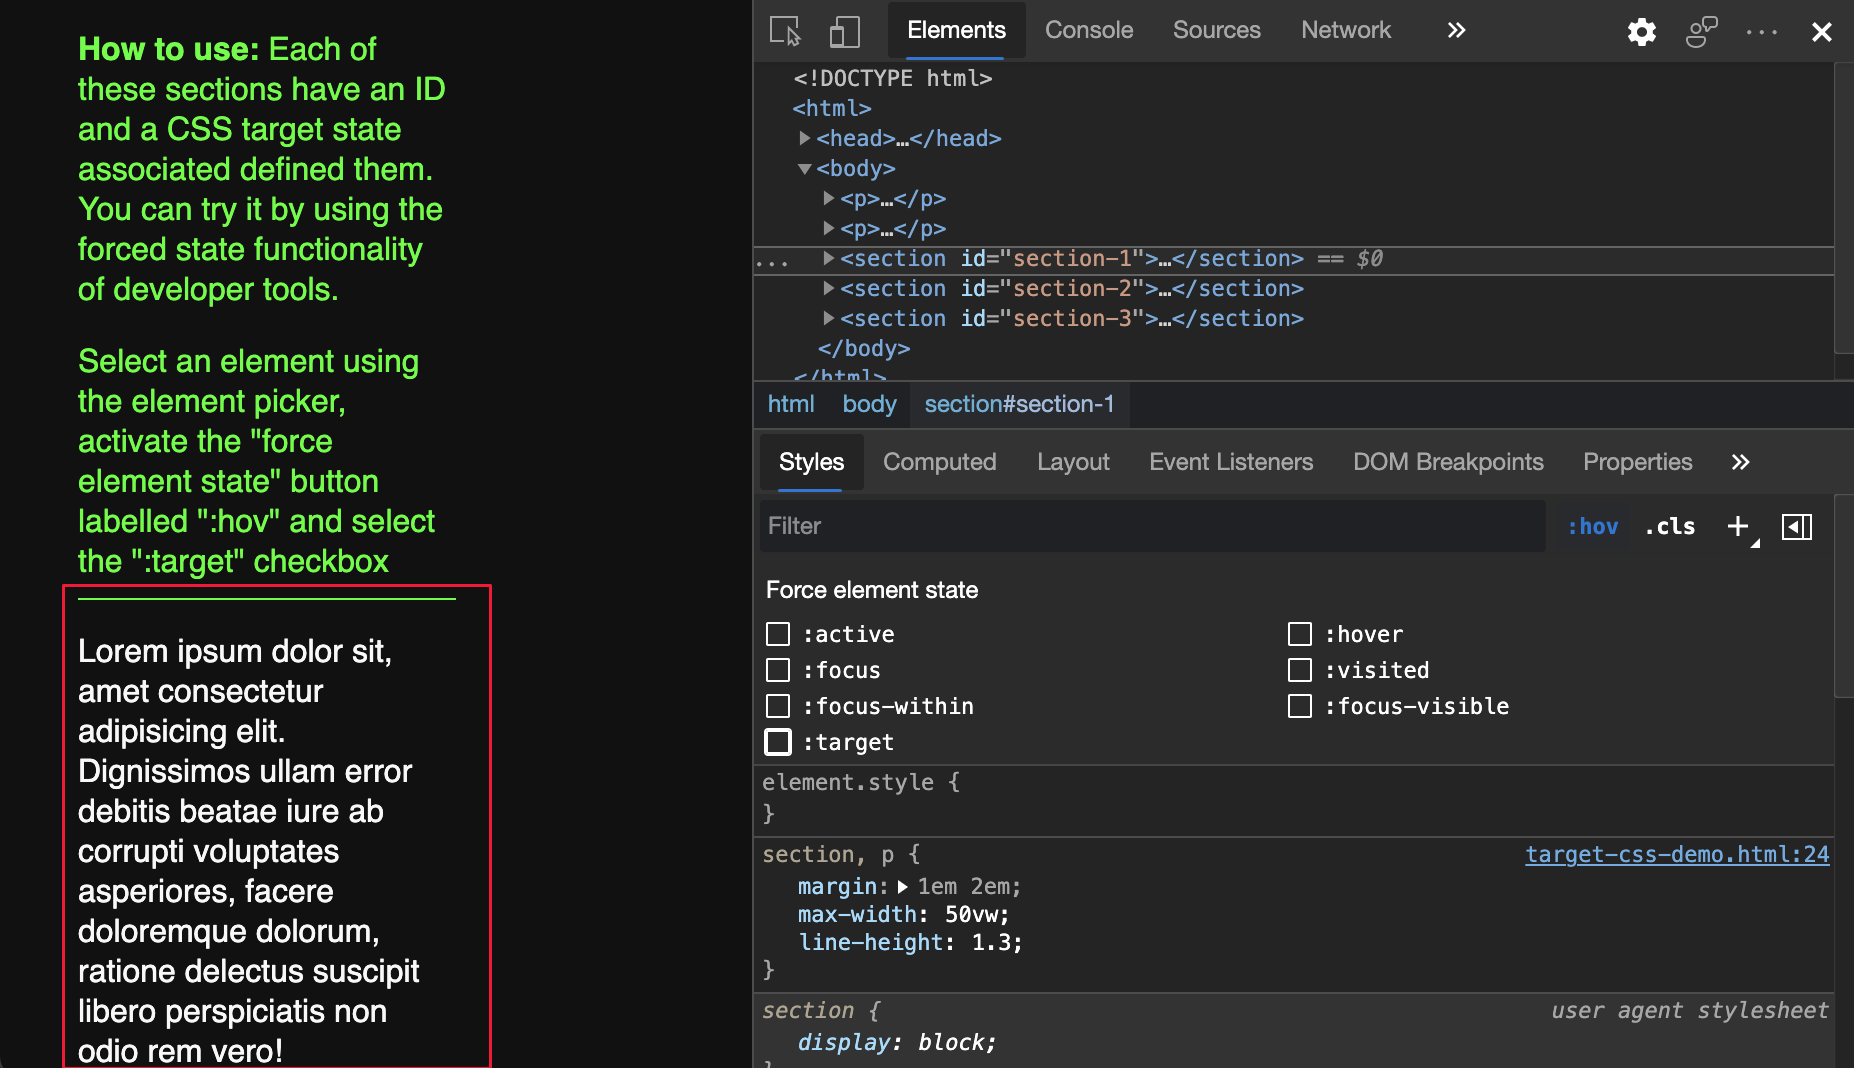
:target CSS forced and webpage highlighted:
For the history of this feature in the Chromium open-source project, see Issue 1156628.
See also:
- Use state simulation to simulate the hover state of an animated menu item in Verify accessibility of all states of elements.
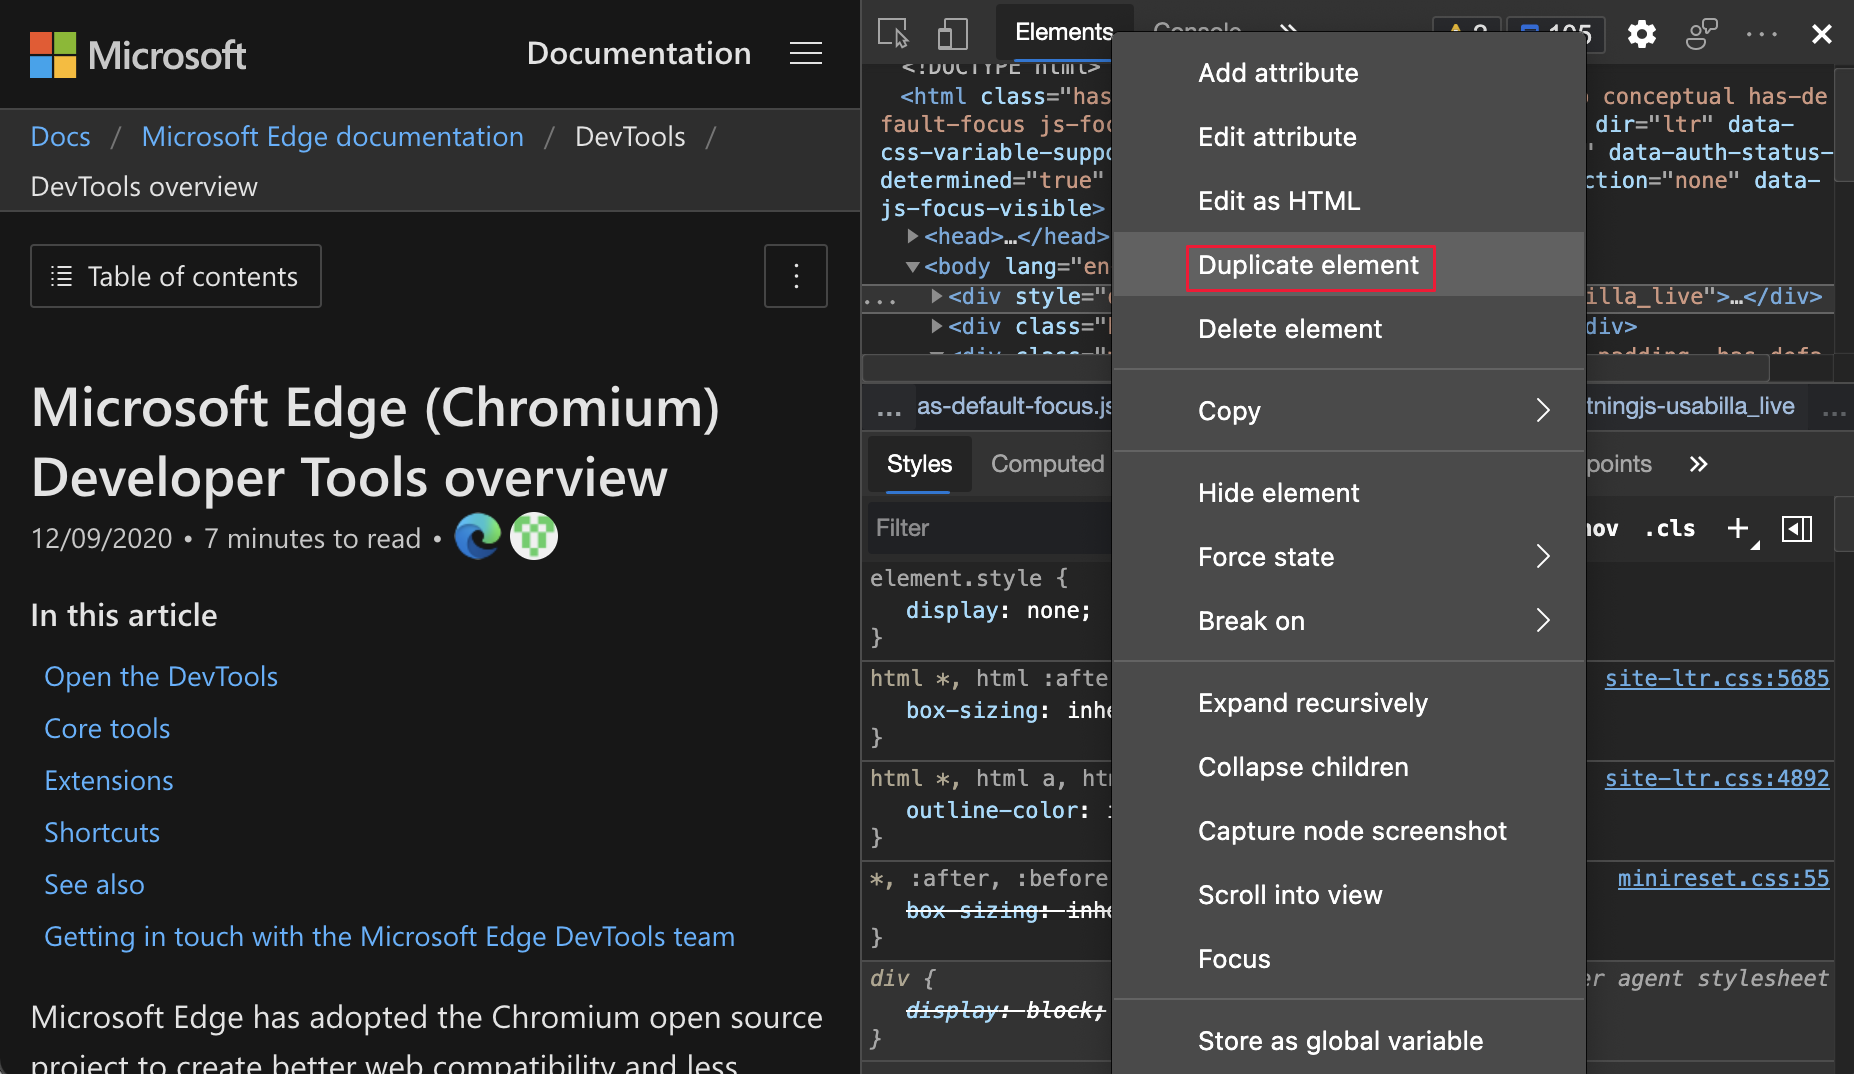
Use Duplicate elements to copy elements
Use the new Duplicate element shortcut to clone an element. In the Elements tool, right-click an element, and then select Duplicate element. A new element is created under the selected element. To duplicate the element by using the keyboard, press Shift+Alt+Down Arrow (Windows, Linux) or Shift+Option+Down Arrow (macOS).
For the history of this feature in the Chromium open-source project, see Issue 1150797.
See also:
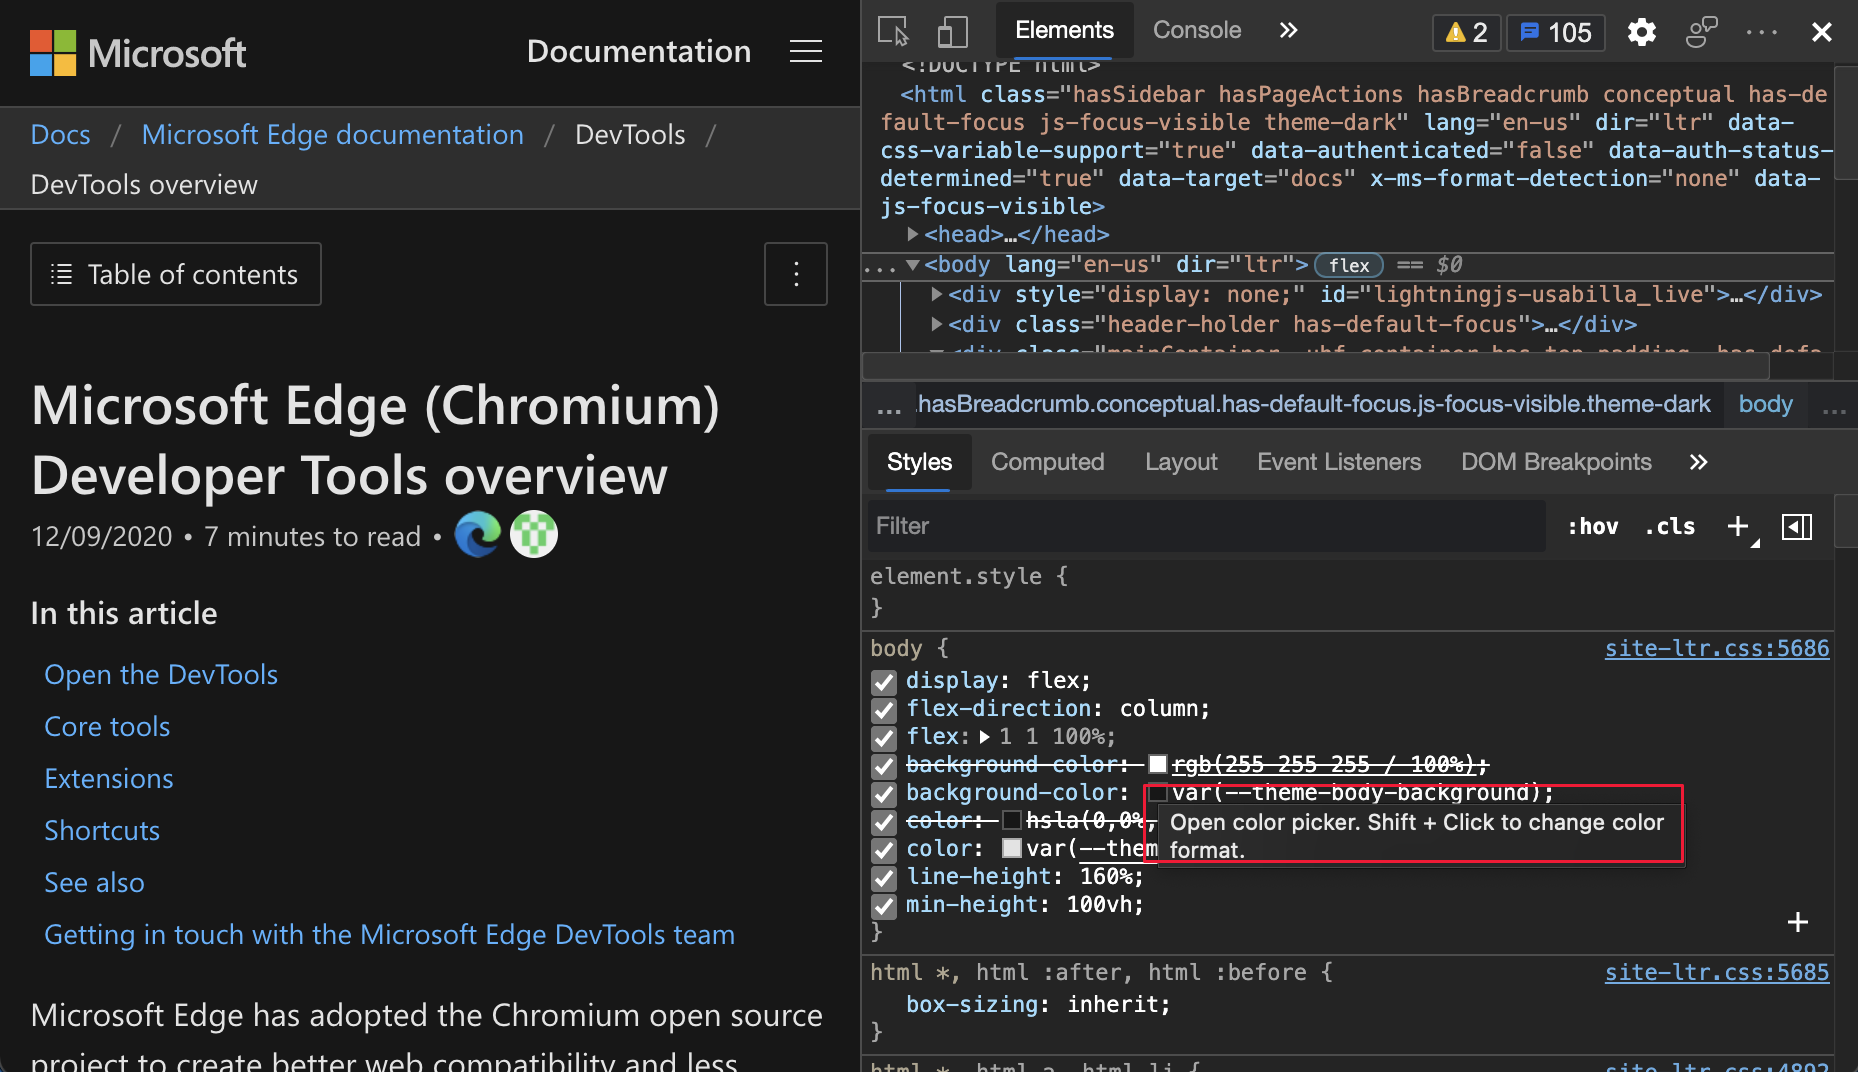
Color pickers for custom CSS properties
The Styles pane now displays Color Pickers for custom CSS properties. To cycle through the RGBA, HSLA, and Hex formats of the color value, press and hold Shift and then click the Color Picker:
For the history of this feature in the Chromium open-source project, see Issue 1147016.
See also:
- Change colors with the Color Picker in CSS features reference
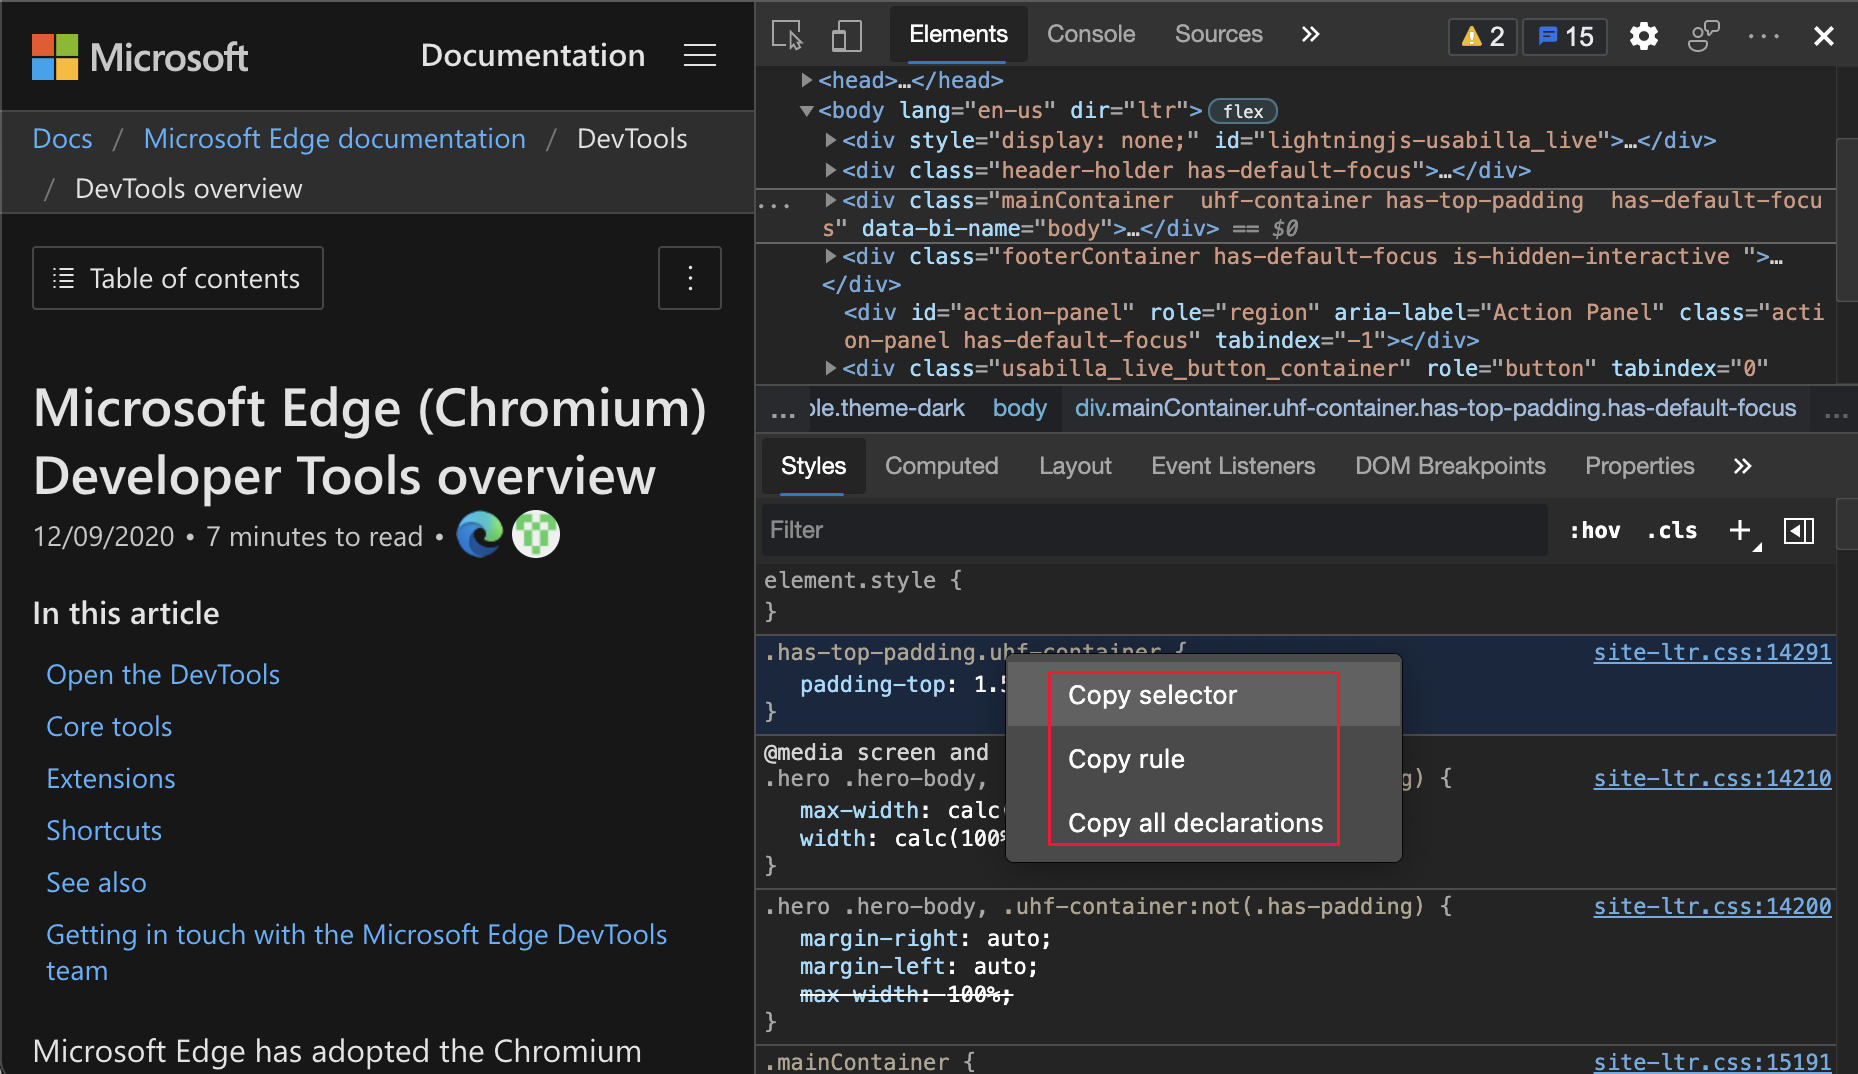
Copy CSS classes and properties
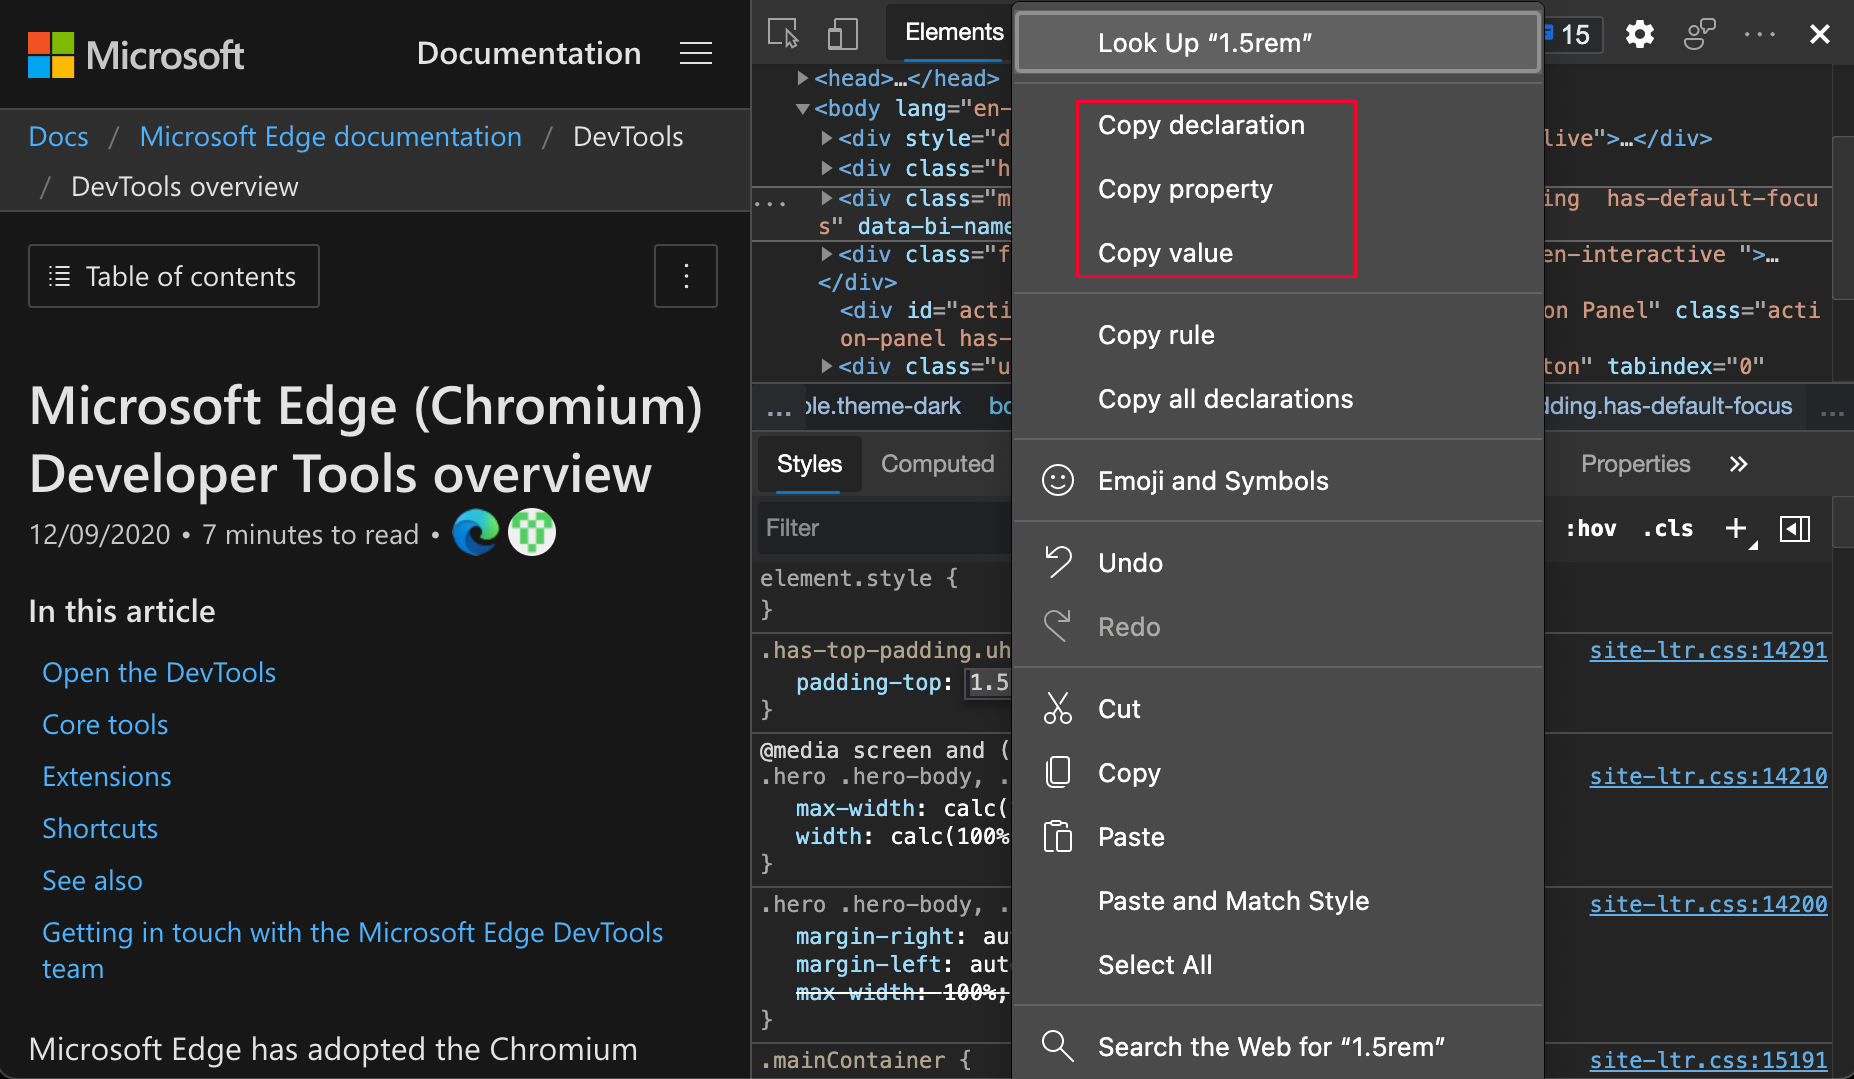
You can now copy CSS properties quicker with a few new options in the right-click menu. In the Elements tool, select an element. To copy the value, in the Styles pane, right-click a CSS class or a CSS property, and then select a copy option.
Copy options for a CSS class in the right-click menu:
| Option | Details |
|---|---|
| Copy selector | Copy the current selector name. |
| Copy rule | Copy the rule of the current selector. |
| Copy all declarations | Copy all declarations under the current rule, including non-valid and prefixed properties. |
Copy options for a CSS property in the right-click menu:
| Option | Details |
|---|---|
| Copy declaration | Copy the declaration of the current line. |
| Copy property | Copy the property of the current line. |
| Copy value | Copy the value of the current line. |
For the history of this feature in the Chromium open-source project, see Issue 1152391.
See also:
Cookies updates
New option to display URL-decoded cookies
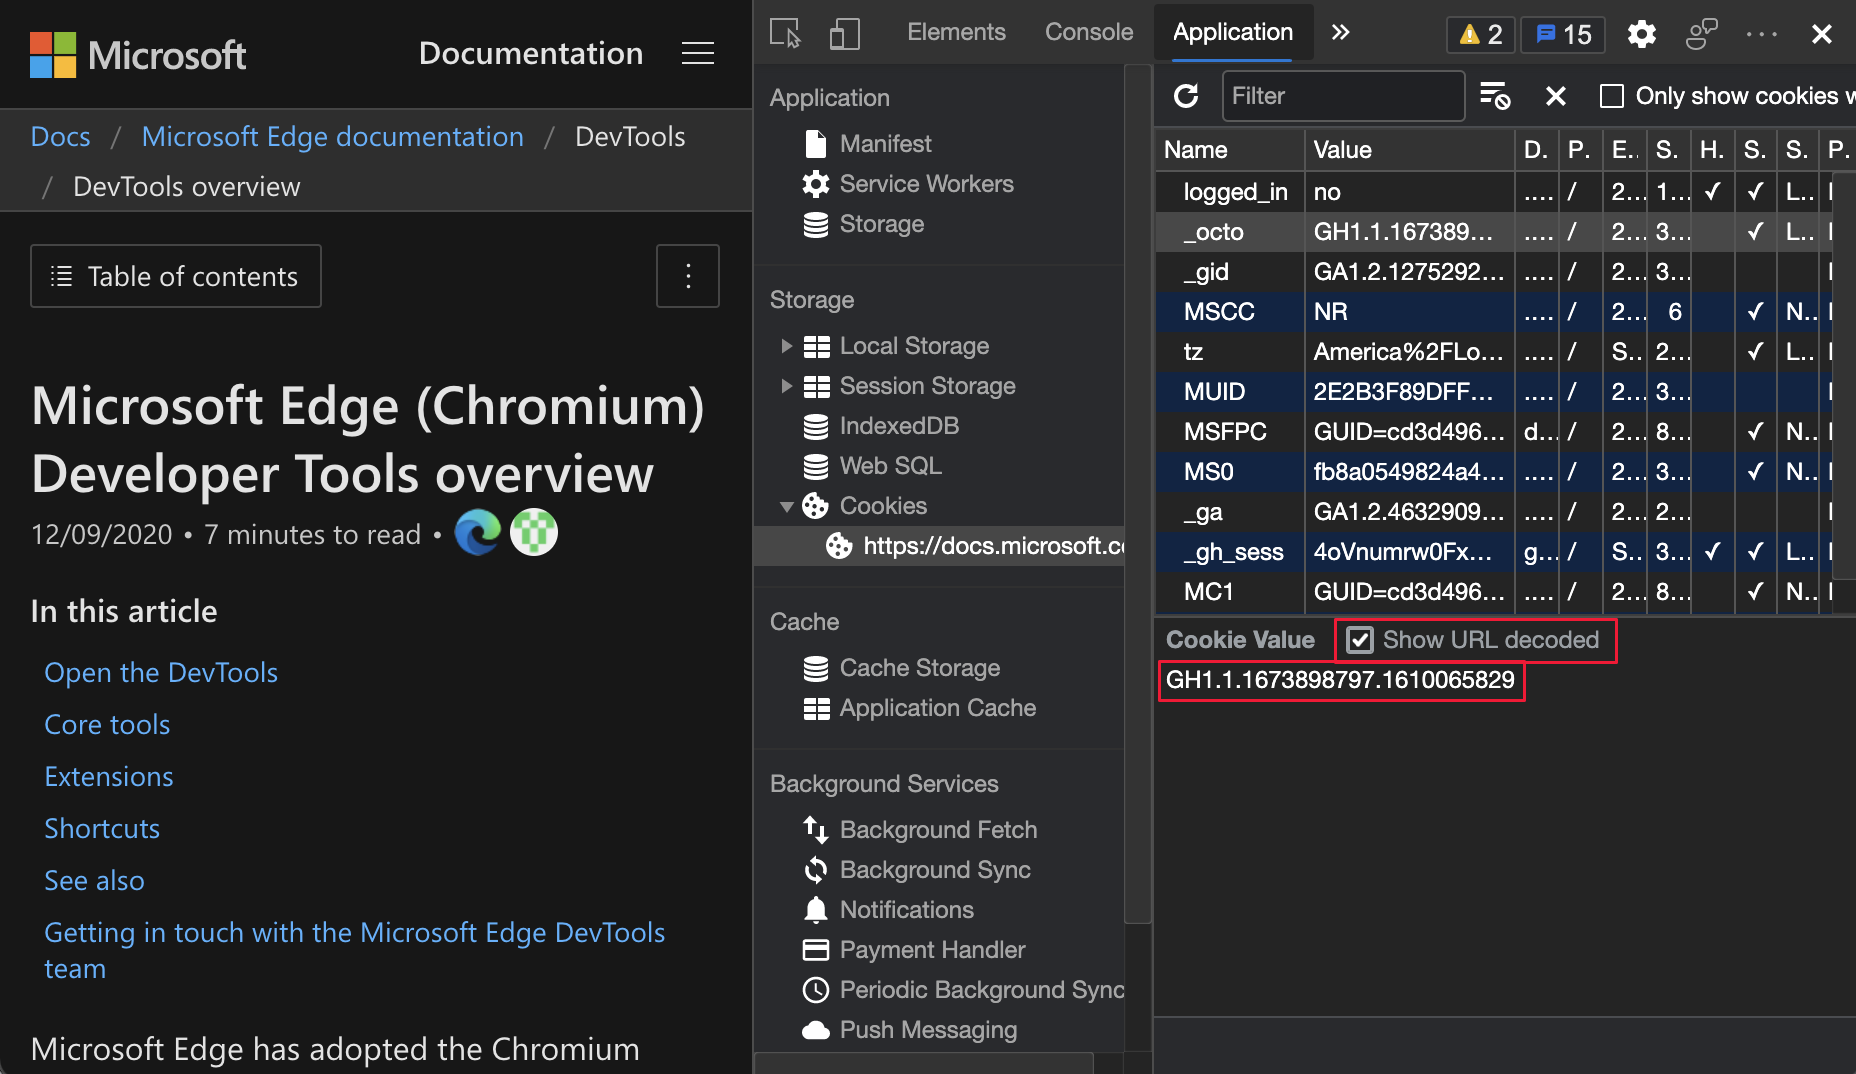
You can now display the URL-decoded cookies value in the Cookies pane. To display the decoded cookie, select Application > Cookies, click any cookie on the list, and then select the checkbox next to Show URL decoded:
For the history of this feature in the Chromium open-source project, see Issue 997625.
See also:
Filter and clear visible cookies
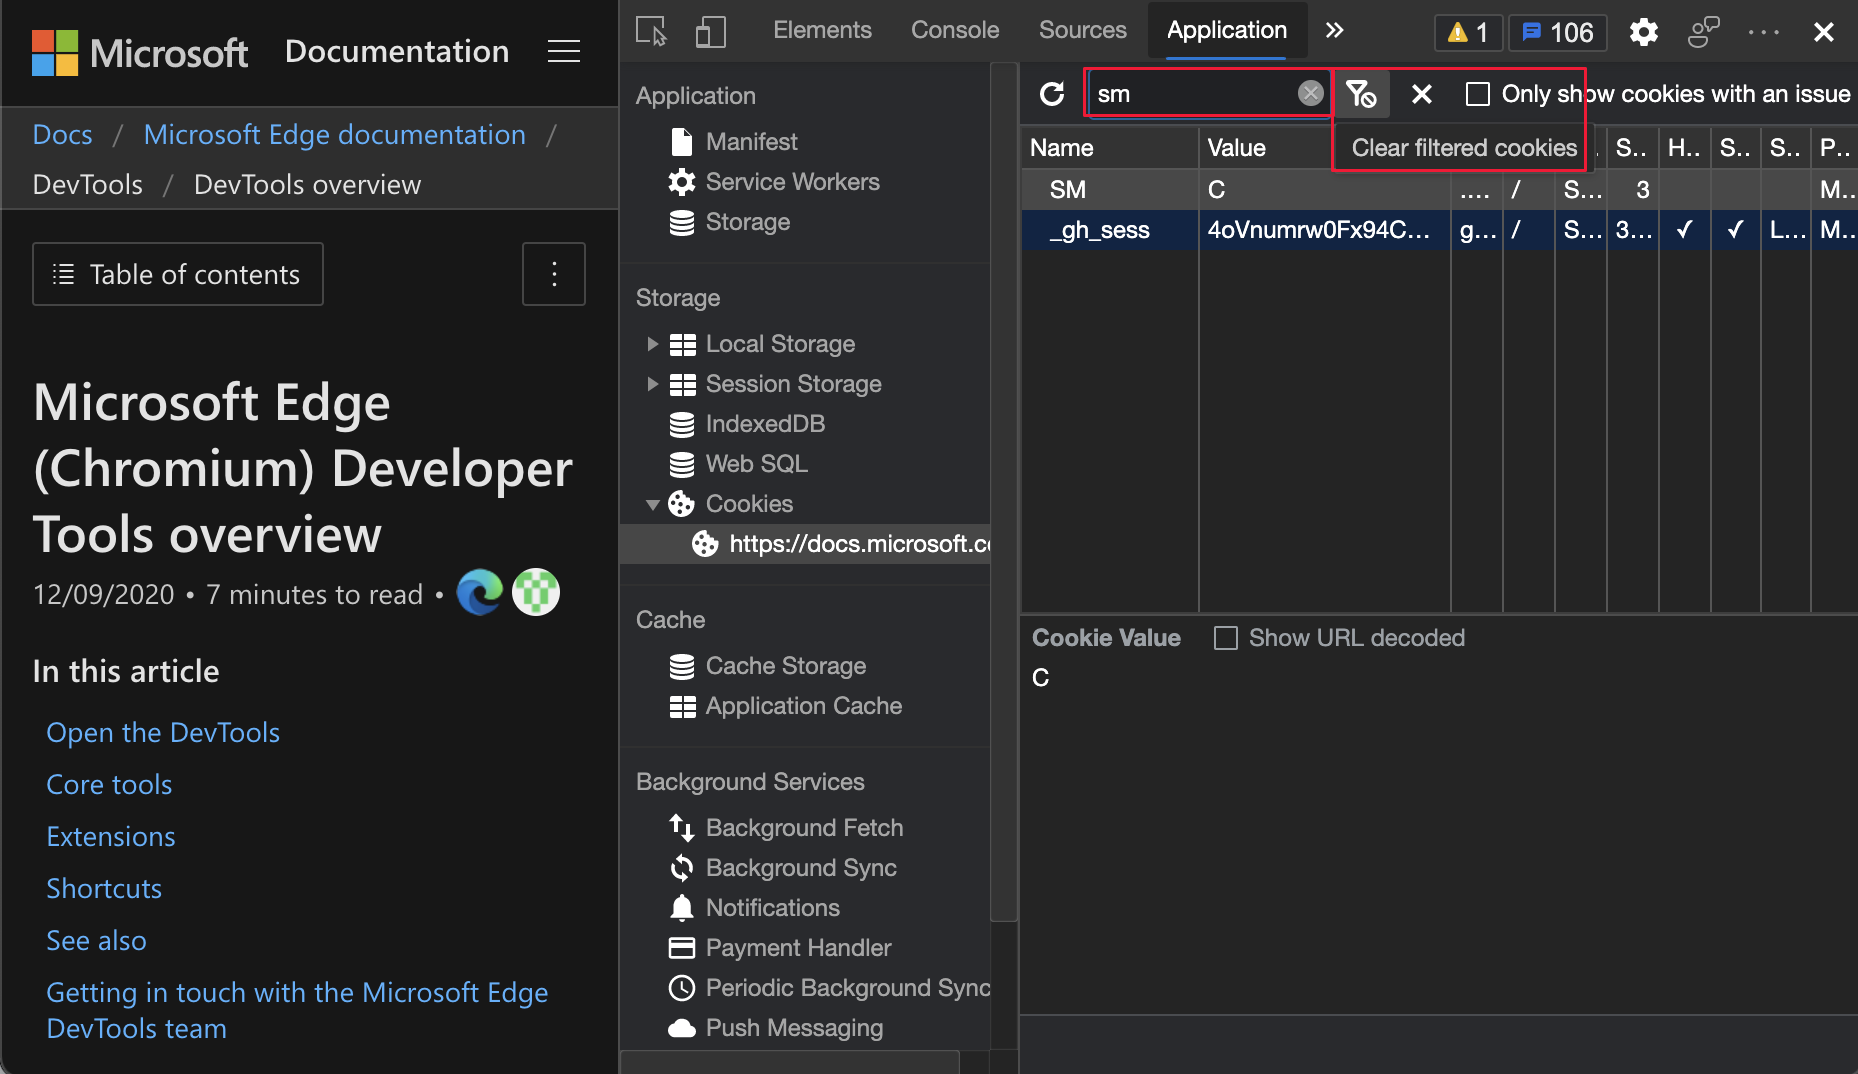
In Microsoft Edge version 88 or earlier, the Application tool only provided a way to clear all cookies with the Clear all cookies button. In Microsoft Edge version 89, you can now select Clear filtered cookies to delete only the filtered cookies.
To filter cookies, select Application > Cookies, and then type in the Filter text box. To delete the displayed cookies, click the Clear filtered cookies button. To display all other cookies, clear the filter text.
For the history of this feature in the Chromium open-source project, see Issue 978059.
See also:
New option to clear third-party cookies in the Storage pane
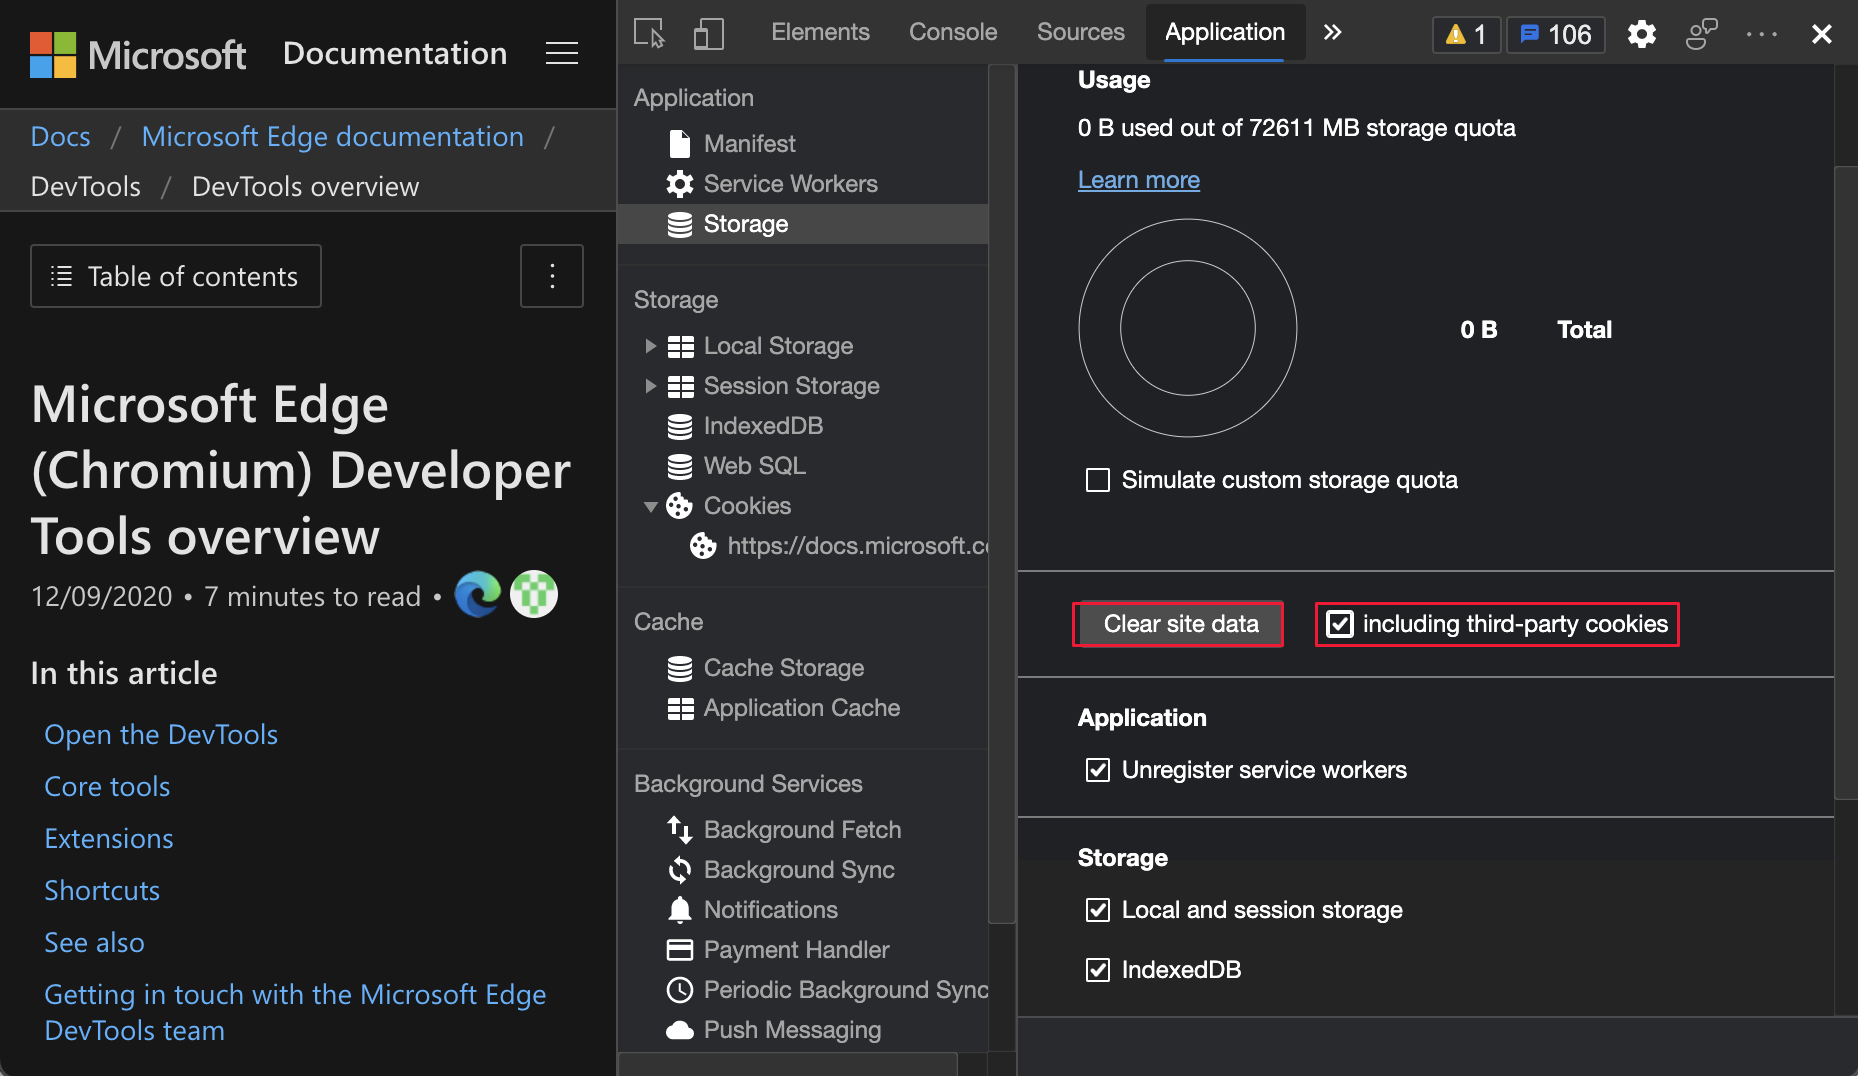
DevTools now clears only first-party cookies by default. To clear website data and first-party cookies only, in the Application tool, in the Application section in the upper left, click Storage, and then click the Clear site data button.
To clear website data and all cookies, select Application > Storage. Select the checkbox next to including third-party cookies, and then click Clear site data:
For the history of this feature in the Chromium open-source project, see Issue 1012337.
See also:
Network tool updates
See also:
Persist Record network log setting
In Microsoft Edge version 88 or earlier, DevTools reset the Record network log setting when a webpage refreshes. In Microsoft Edge version 89, DevTools now persists the Record network log setting:
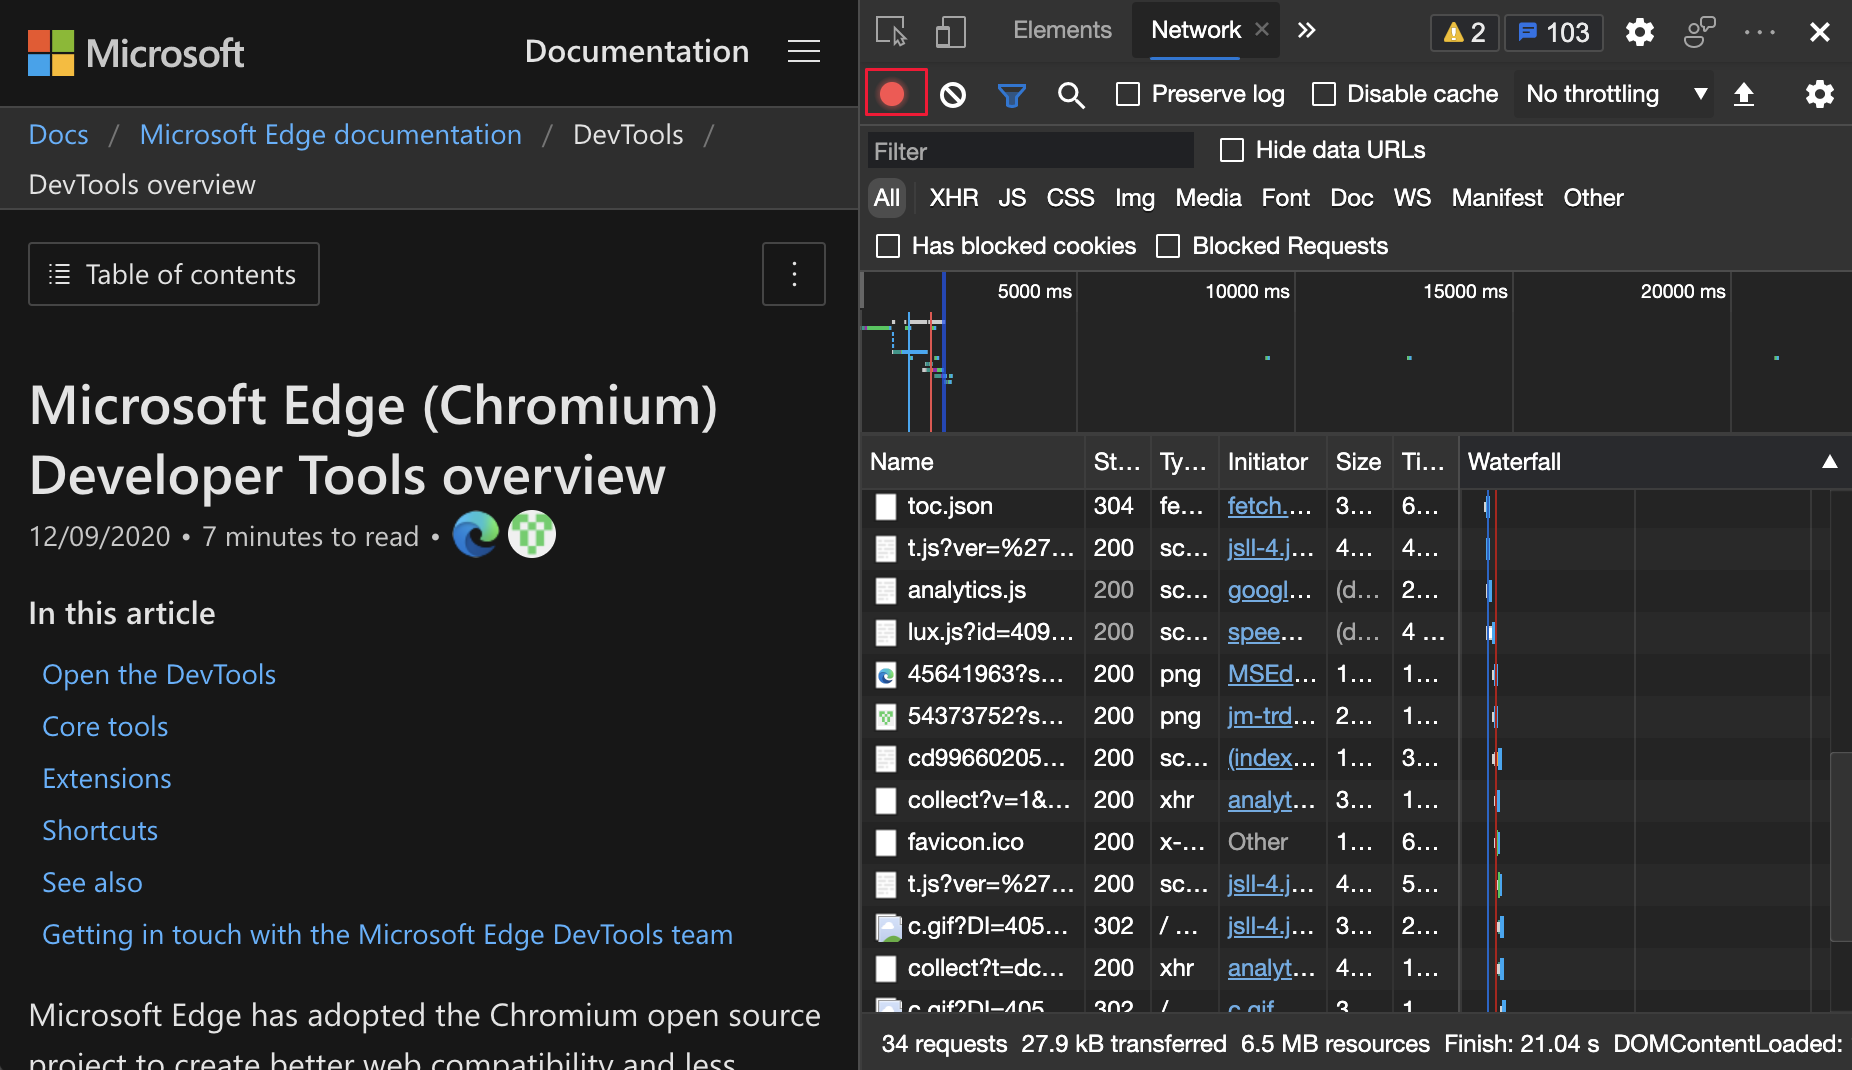
For the history of this feature in the Chromium open-source project, see Issue 1122580.
See also:
- Record network requests in Network features reference.
Online option is now No throttling option
The network emulation option Online is now renamed to No Throttling.
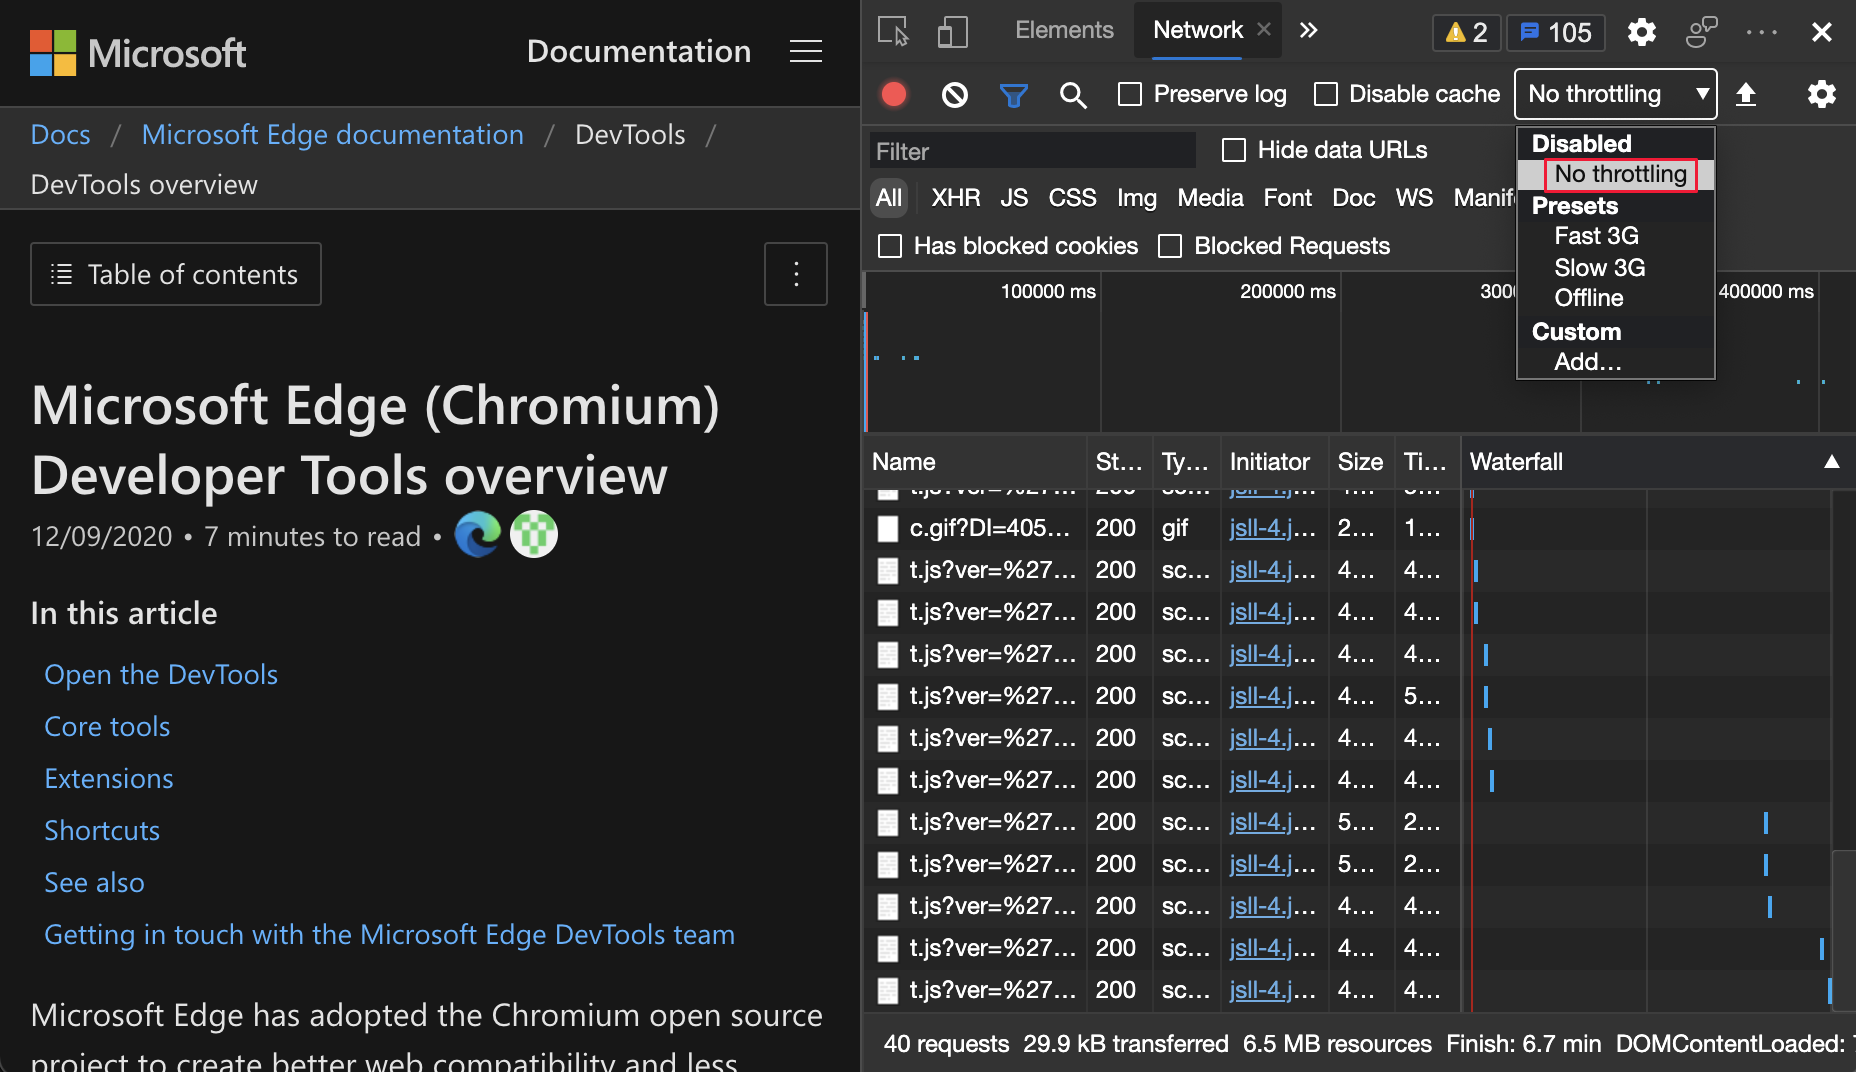
For the history of this feature in the Chromium open-source project, see Issue 1028078.
See also:
- Simulate a slower network connection in Inspect network activity.
- Emulate slow network connections in Network features reference.
New copy options in the Console tool, Sources tool, and Styles pane
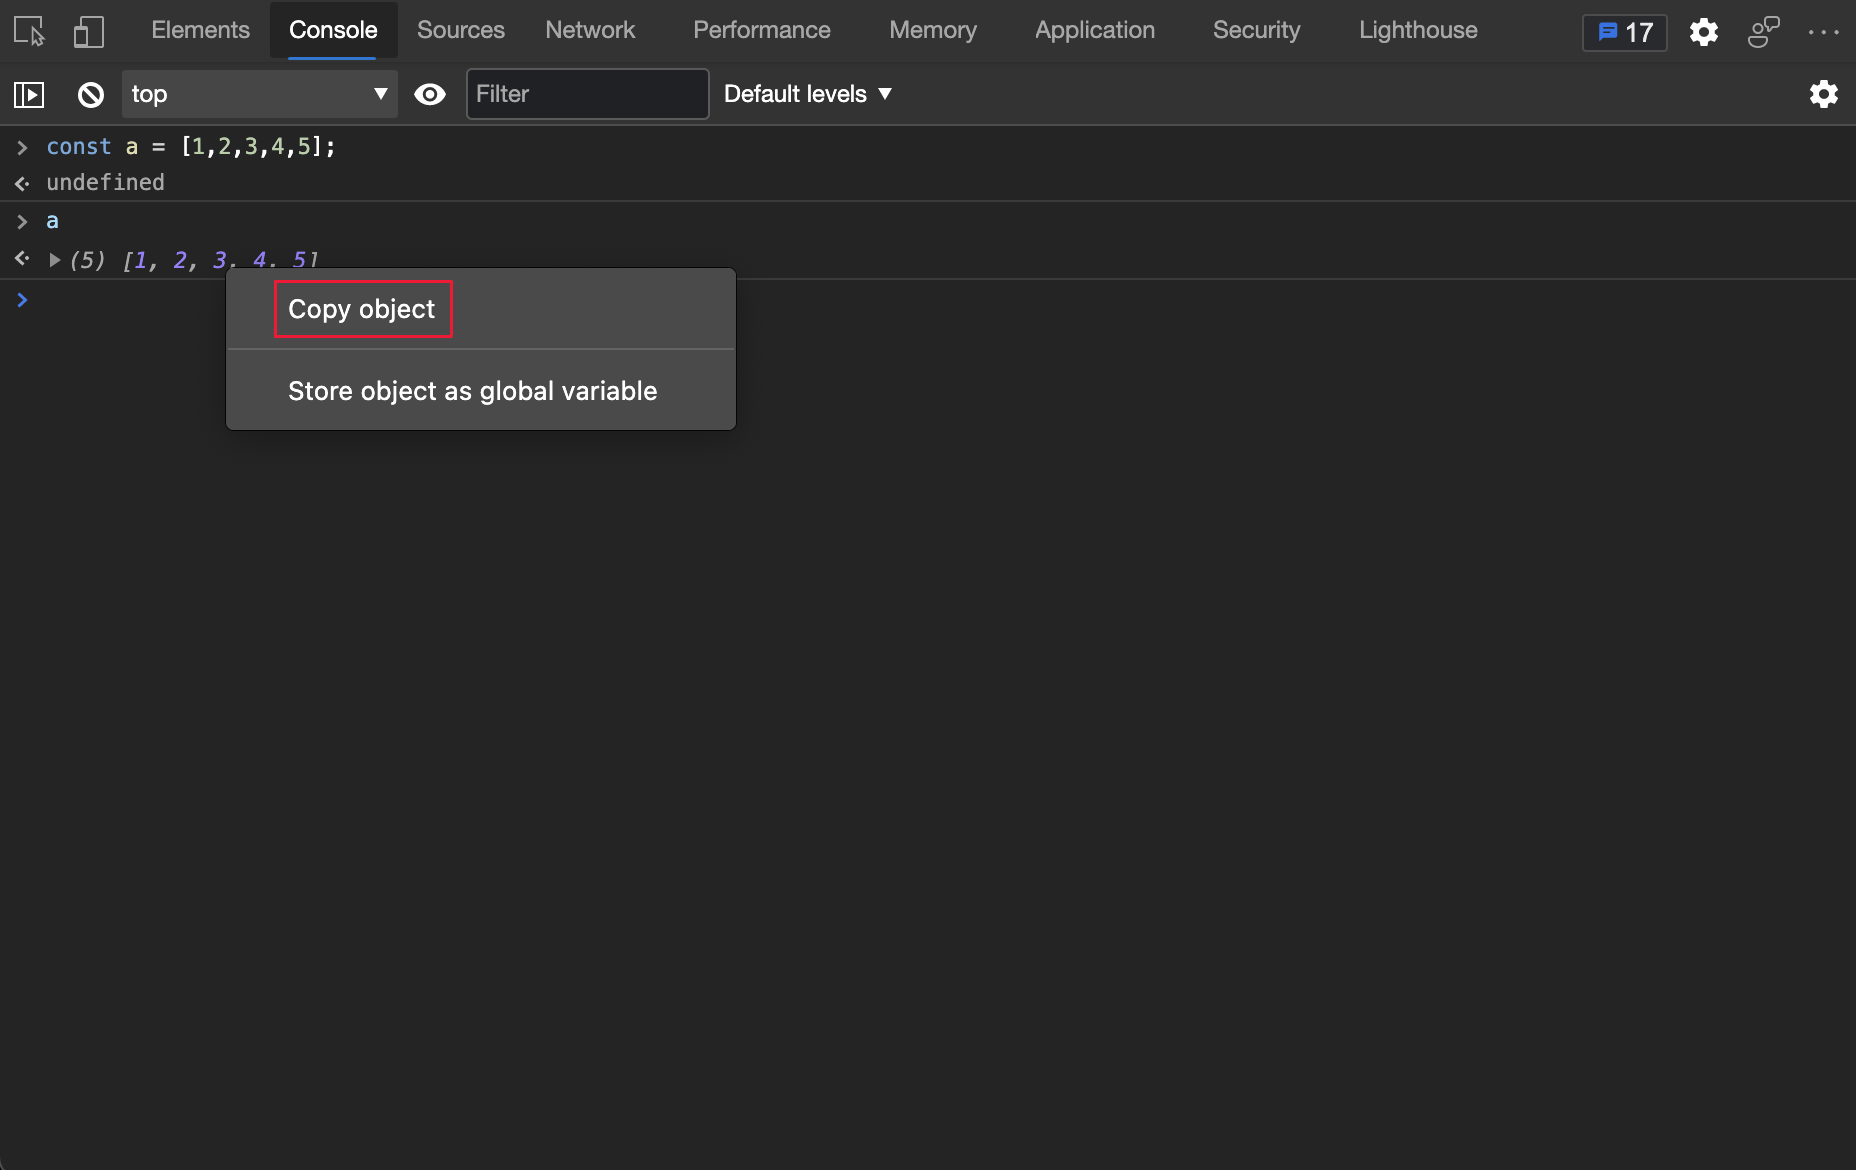
Copy object in the Console and Sources tool
You can now copy object values in the Console and Sources tools. The ability to copy object values is useful when working with large objects.
In the Console tool, right-click an object, and then select Copy object.
In the Sources tool, on a breakpoint, hover on an object, in the Object popup window, right-click an object, and then select Copy object.
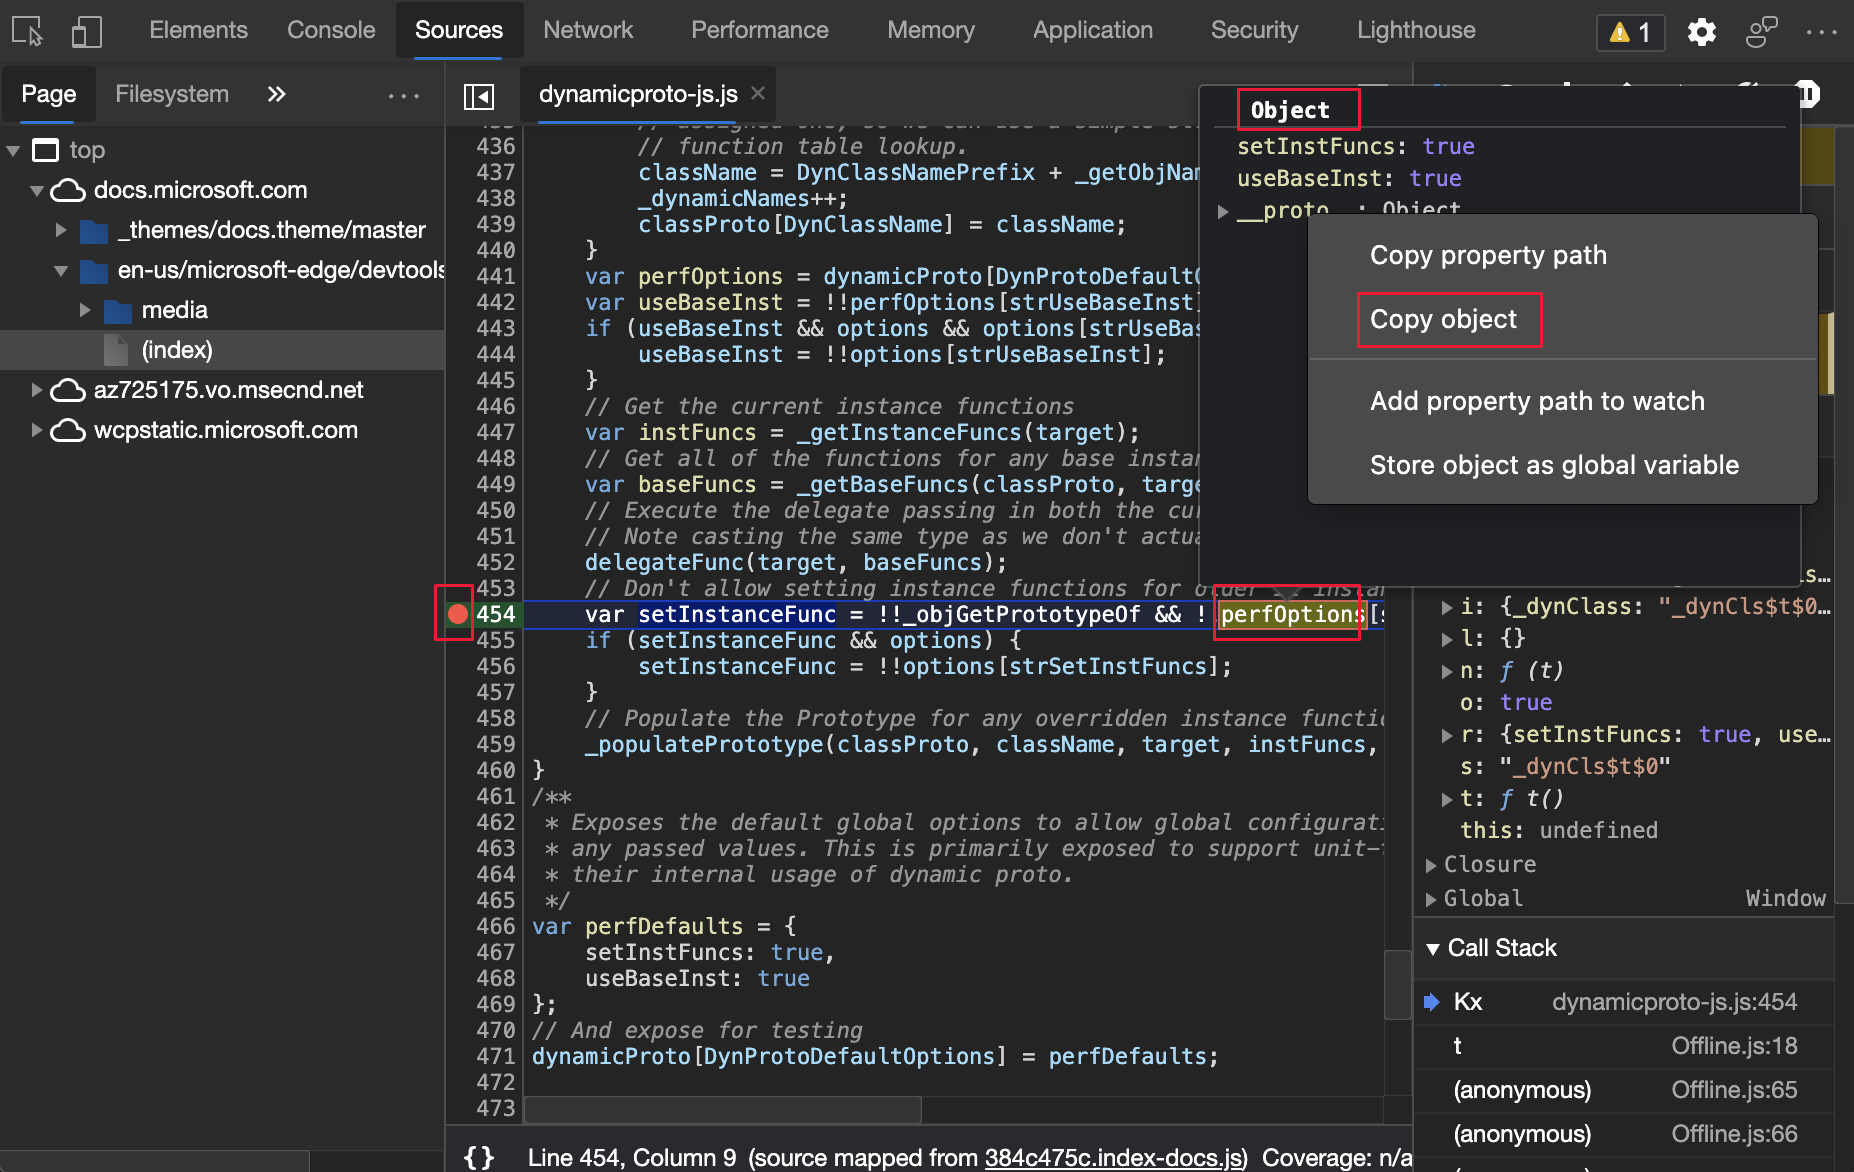
For the history of this feature in the Chromium open-source project, see Issues 1148353 and 1149859.
See also:
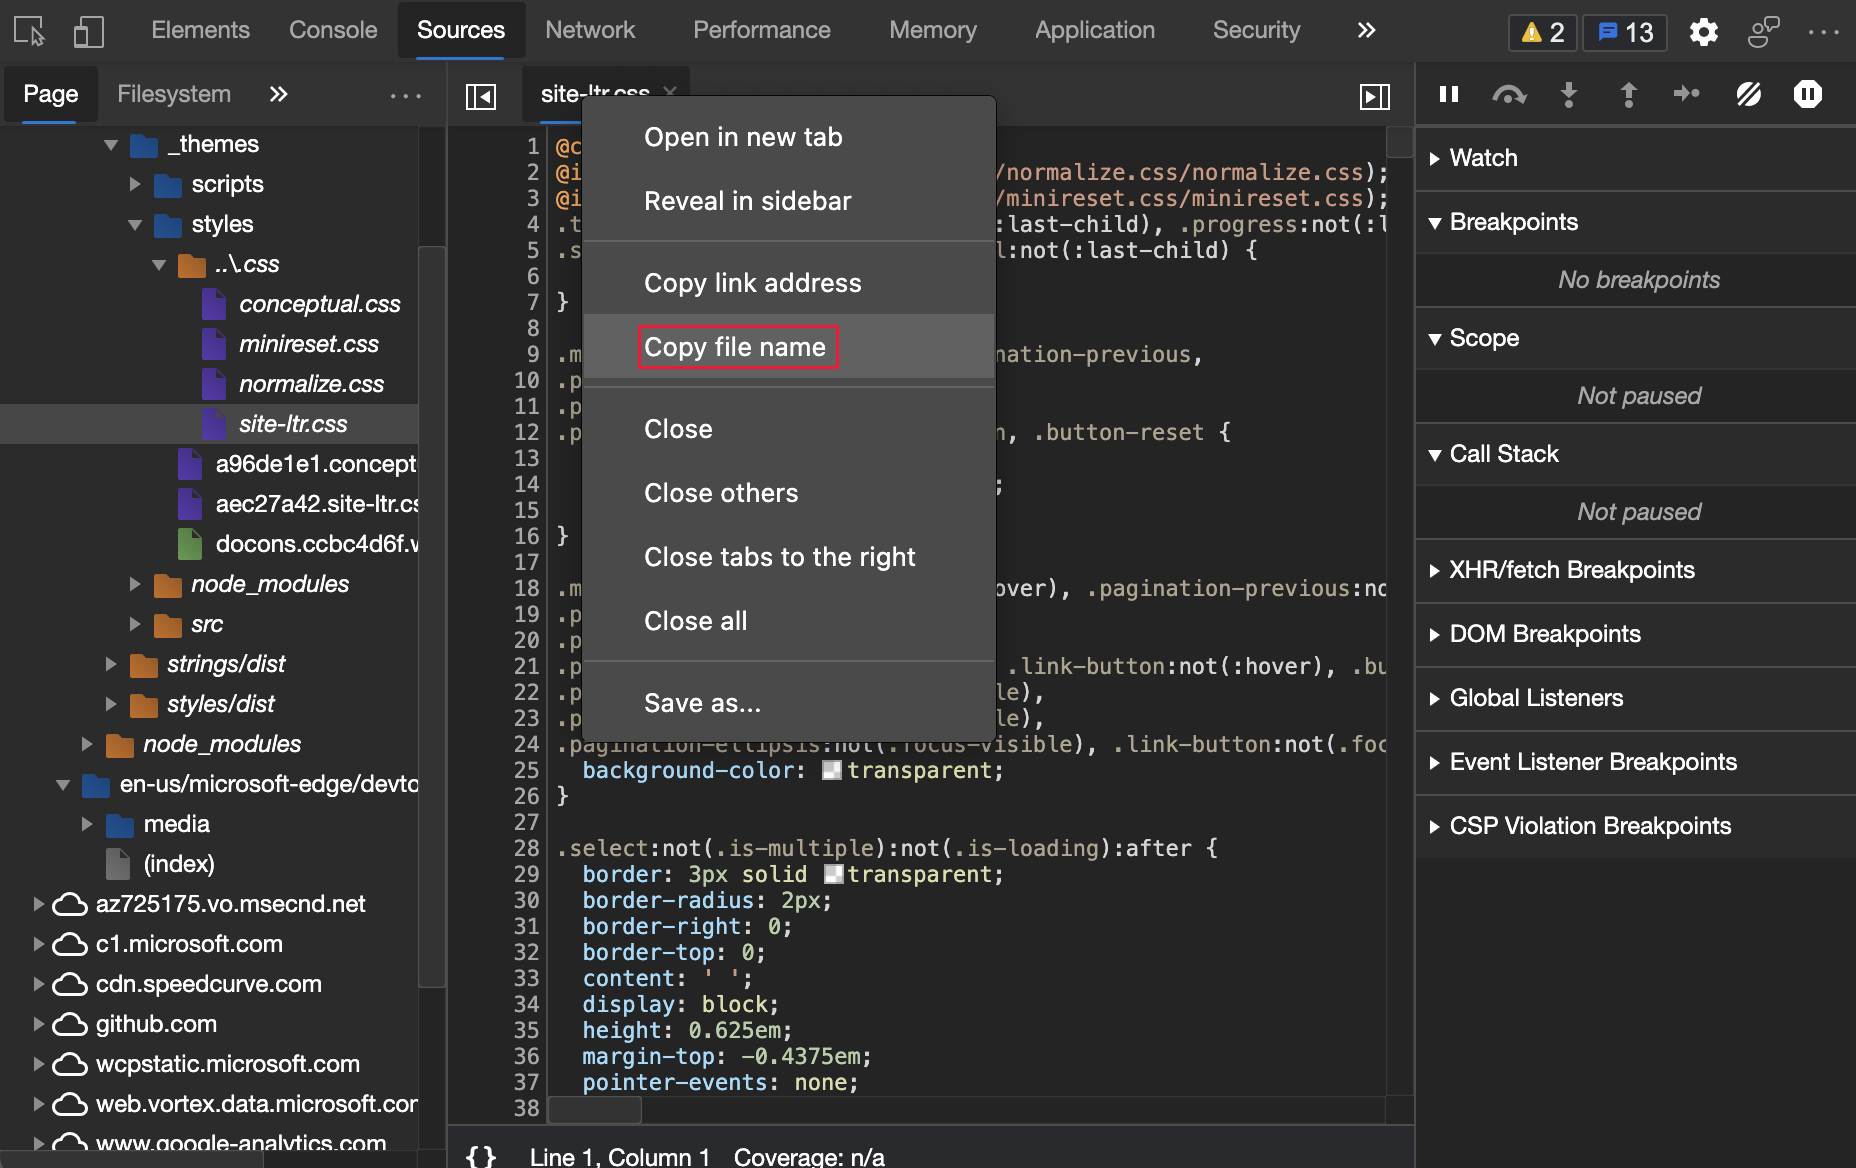
Copy file name in the Sources tool and Styles pane
You can now copy a file name by using the right-click menu.
In the Sources tool, right-click a file name, and then select Copy file name.
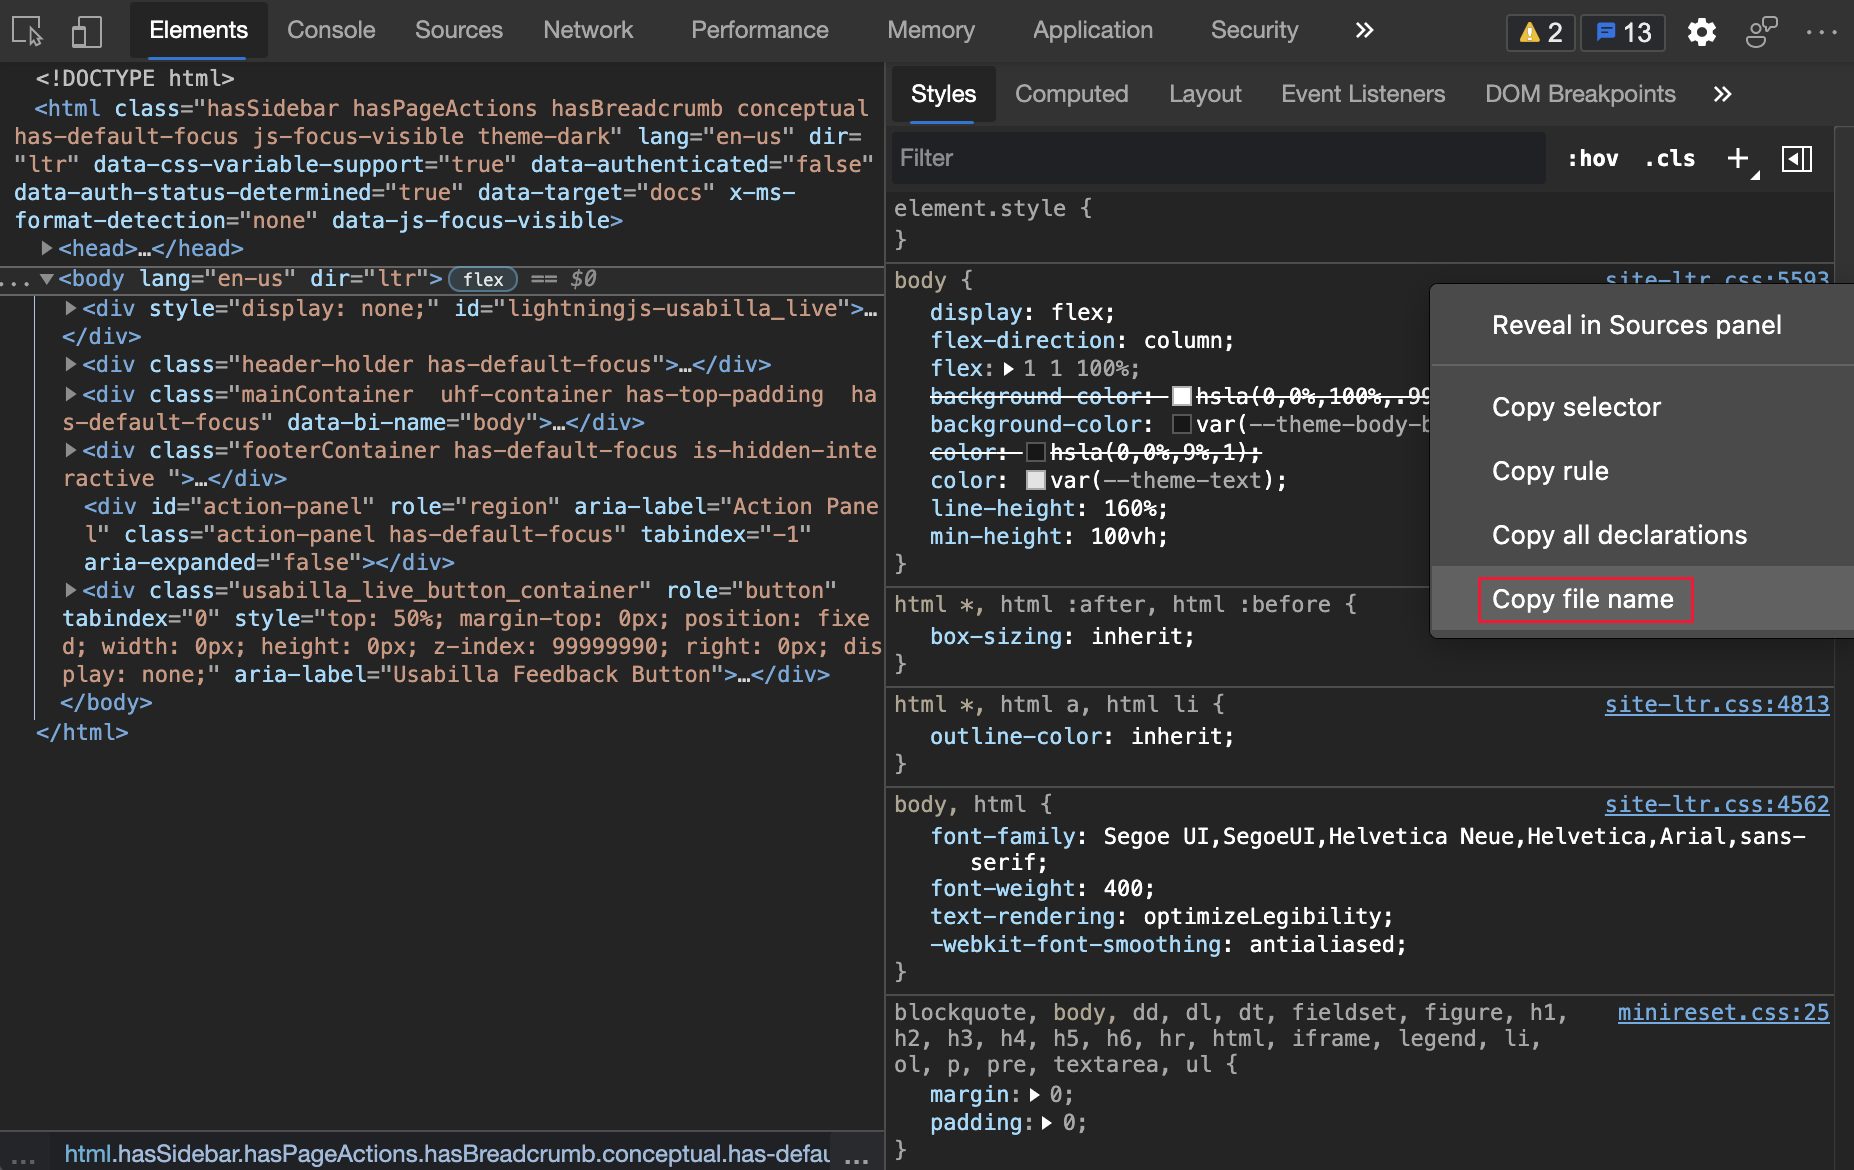
In the Elements tool > Styles pane, right-click a file name, and then select Copy file name.
For the history of this feature in the Chromium open-source project, see Issues 1155120.
See also:
Updates to Frame details
In the Application tool, the Frames page has the following updates.
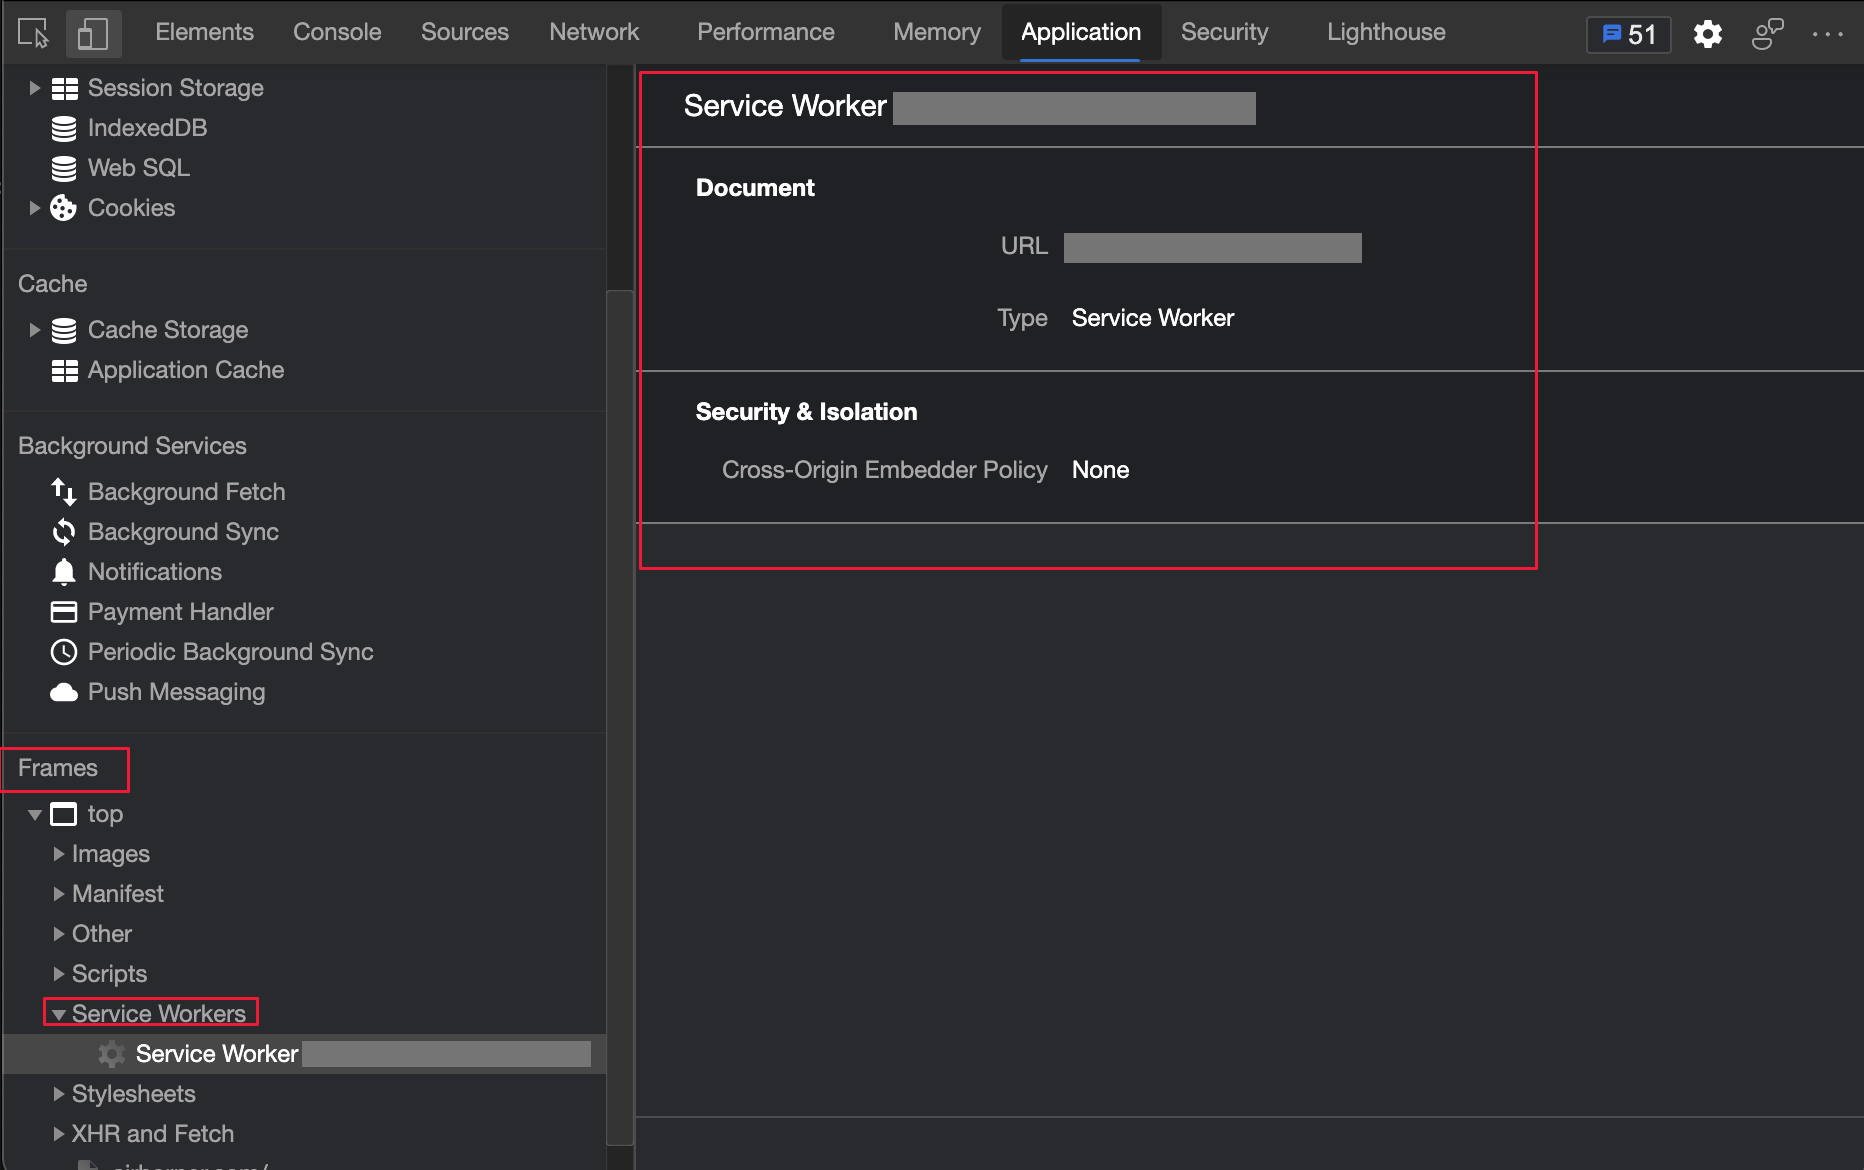
Service workers information in Frame details
The Application tool now lists a dedicated service worker under the parent frame. In the following figure, service worker details are displayed. To display the service worker details, select Application > Frames > top > Service Workers and then click a service worker.
For the history of this feature in the Chromium open-source project, see Issue 1122507.
See also:
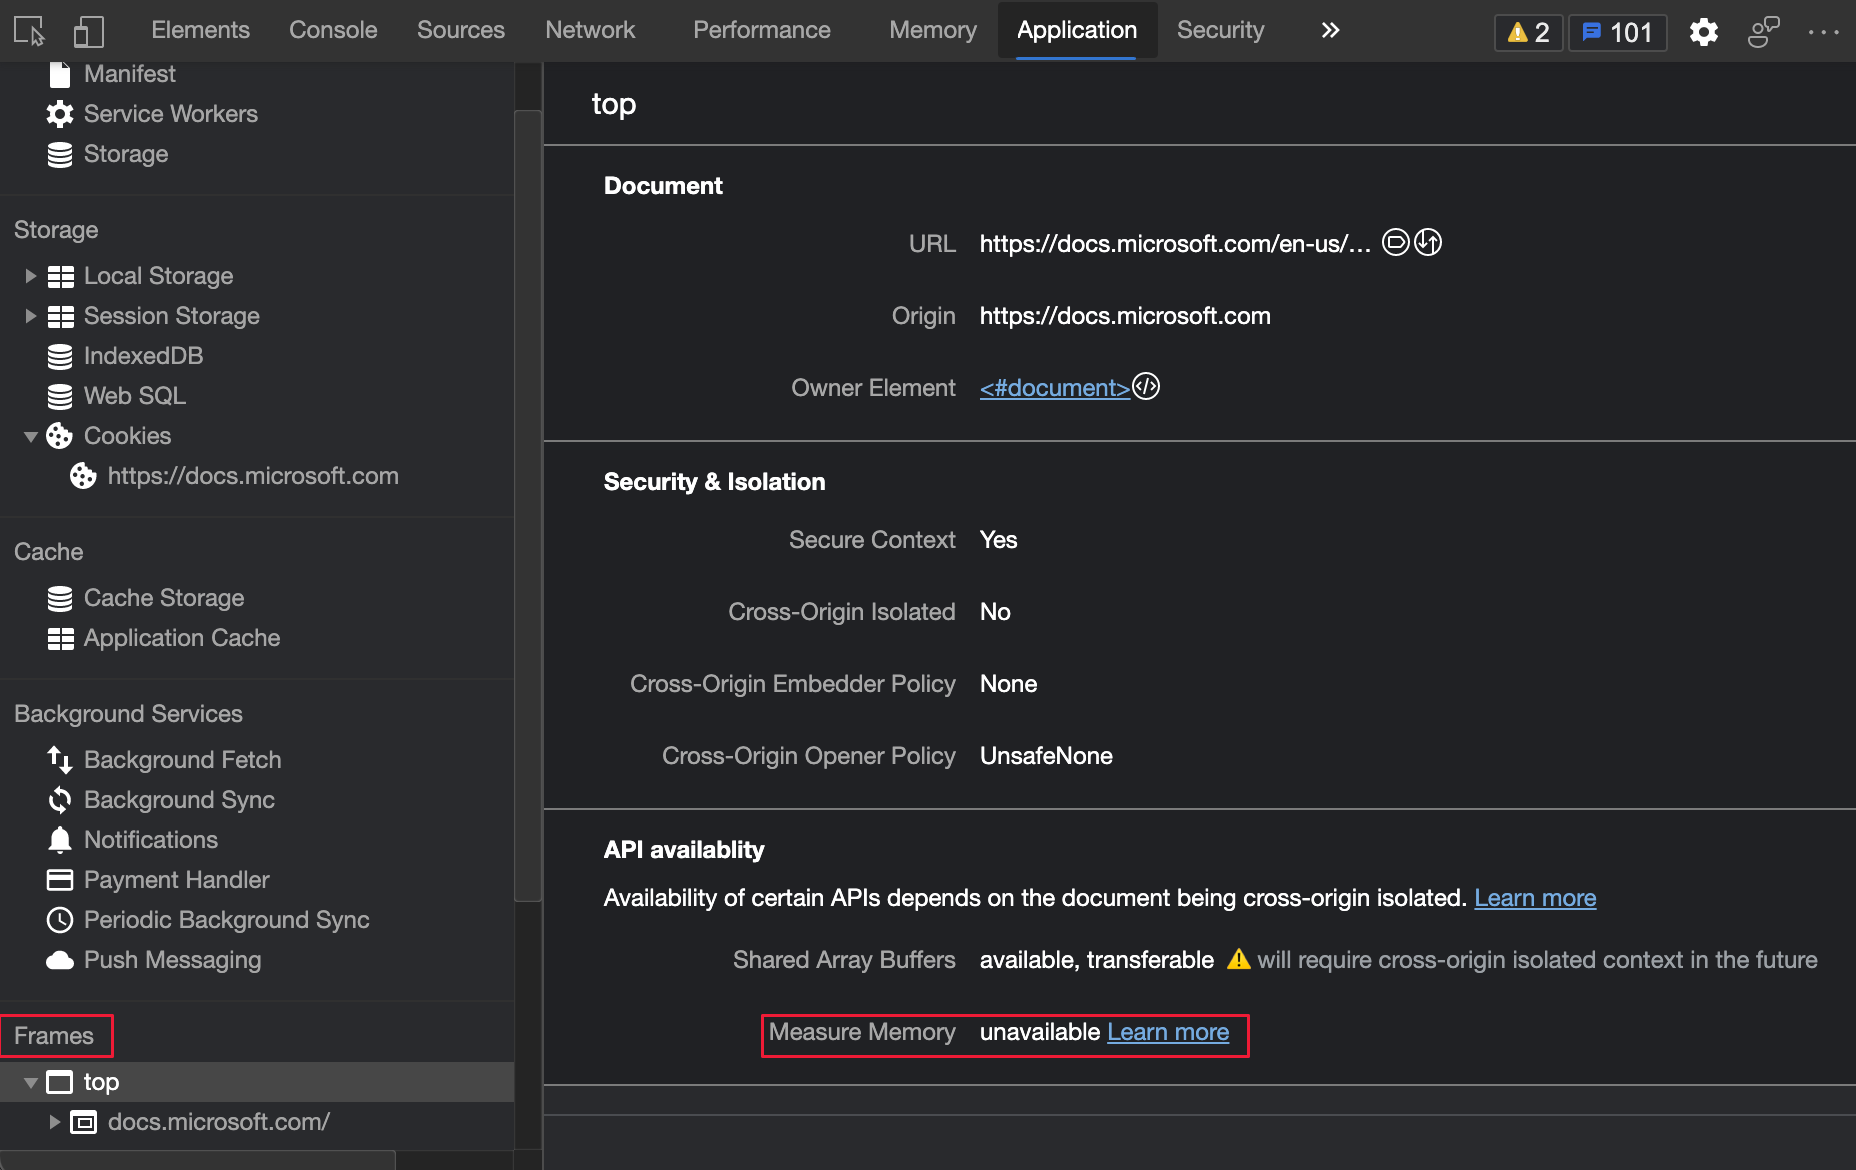
Measure Memory information in Frame details
In the Frames page of the Application tool, the performance.measureMemory() API status is now displayed in the API availability section. The new performance.measureMemory() API estimates the memory usage of the entire webpage.
For the history of this feature in the Chromium open-source project, see Issue 1139899.
See also:
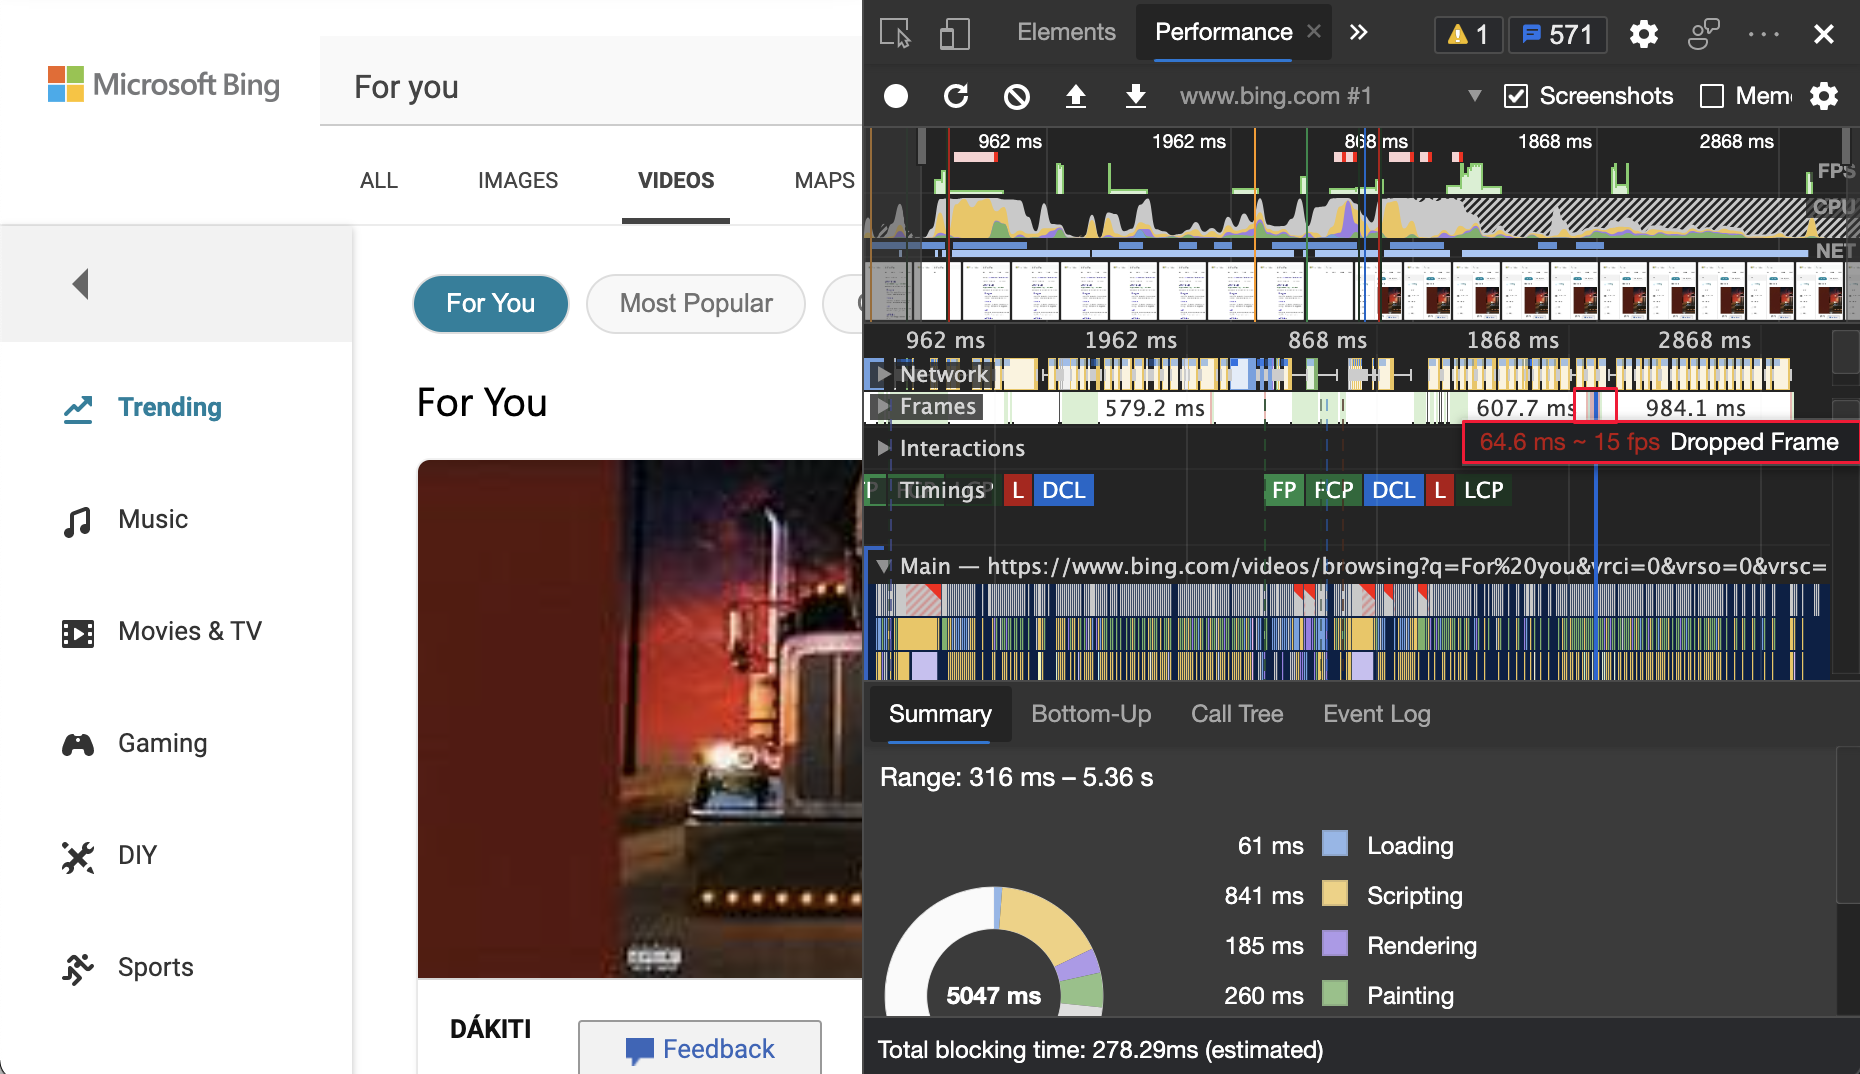
Dropped frames in the Performance tool
When you analyze load performance in the Performance tool, the Frames section now marks dropped frames as red. To display the frame rate, hover on a dropped frame:
For the history of this feature in the Chromium open-source project, see Issue 1075865.
See also:
- Record load performance in Performance features reference
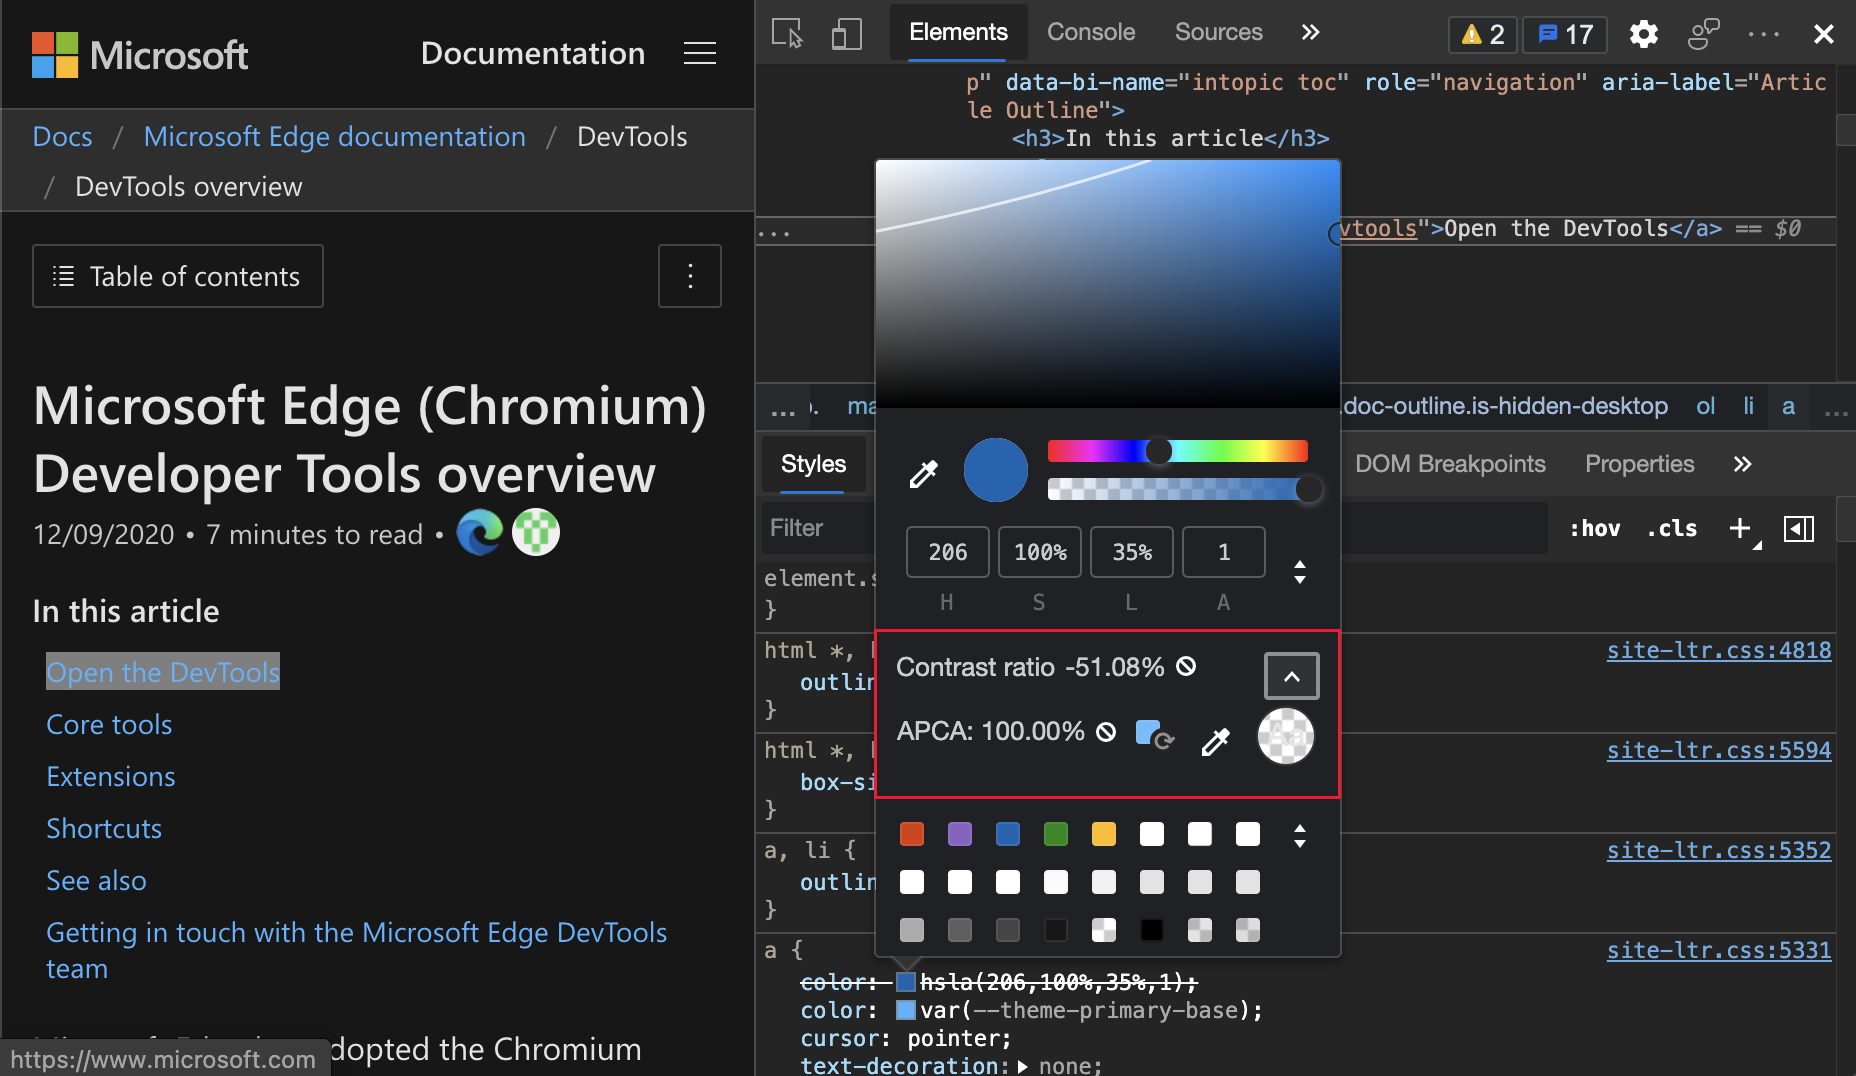
New color contrast calculation - Advanced Perceptual Contrast Algorithm (APCA)
The Advanced Perceptual Contrast Algorithm (APCA) replaces the AA/AAA guidelines contrast ratio in the Color Picker. The Color Picker is used in the Styles tab in the Elements tool.
APCA is a new way to compute contrast. It is based on modern research on color perception. Compared to AA/AAA guidelines, APCA is more context-dependent. The contrast is calculated based on the following spatial properties of the text, color, and context.
- Spatial properties of text that include font weight and size.
- Spatial properties of color that include perceived contrast between text and background.
- Spatial properties of context that include ambient light, surroundings, and intended purpose.
To turn on this experiment, select Settings > Experiments and then select the checkbox next to Enable new Advanced Perceptual Contrast Algorithm (APCA) replacing previous contrast ratio and AA/AAA guidelines. To view the history of this feature in the Chromium open-source project, see Issue 1121900.
See also:
- Enable new Advanced Perceptual Contrast Algorithm (APCA) replacing previous contrast ratio and AA/AAA guidelines in Experimental features in Microsoft Edge DevTools. Edge 89)_.
- Change colors with the Color Picker in CSS features reference.
- Test text-color contrast using the Color Picker
Note
Portions of this page are modifications based on work created and shared by Google and used according to terms described in the Creative Commons Attribution 4.0 International License. The original page is found here and is authored by Jecelyn Yeen.
![]() This work is licensed under a Creative Commons Attribution 4.0 International License.
This work is licensed under a Creative Commons Attribution 4.0 International License.