Note
Access to this page requires authorization. You can try signing in or changing directories.
Access to this page requires authorization. You can try changing directories.
These are the latest features in the Stable release of Microsoft Edge DevTools.
Wavy underlines highlight code issues and improvements in Elements tool
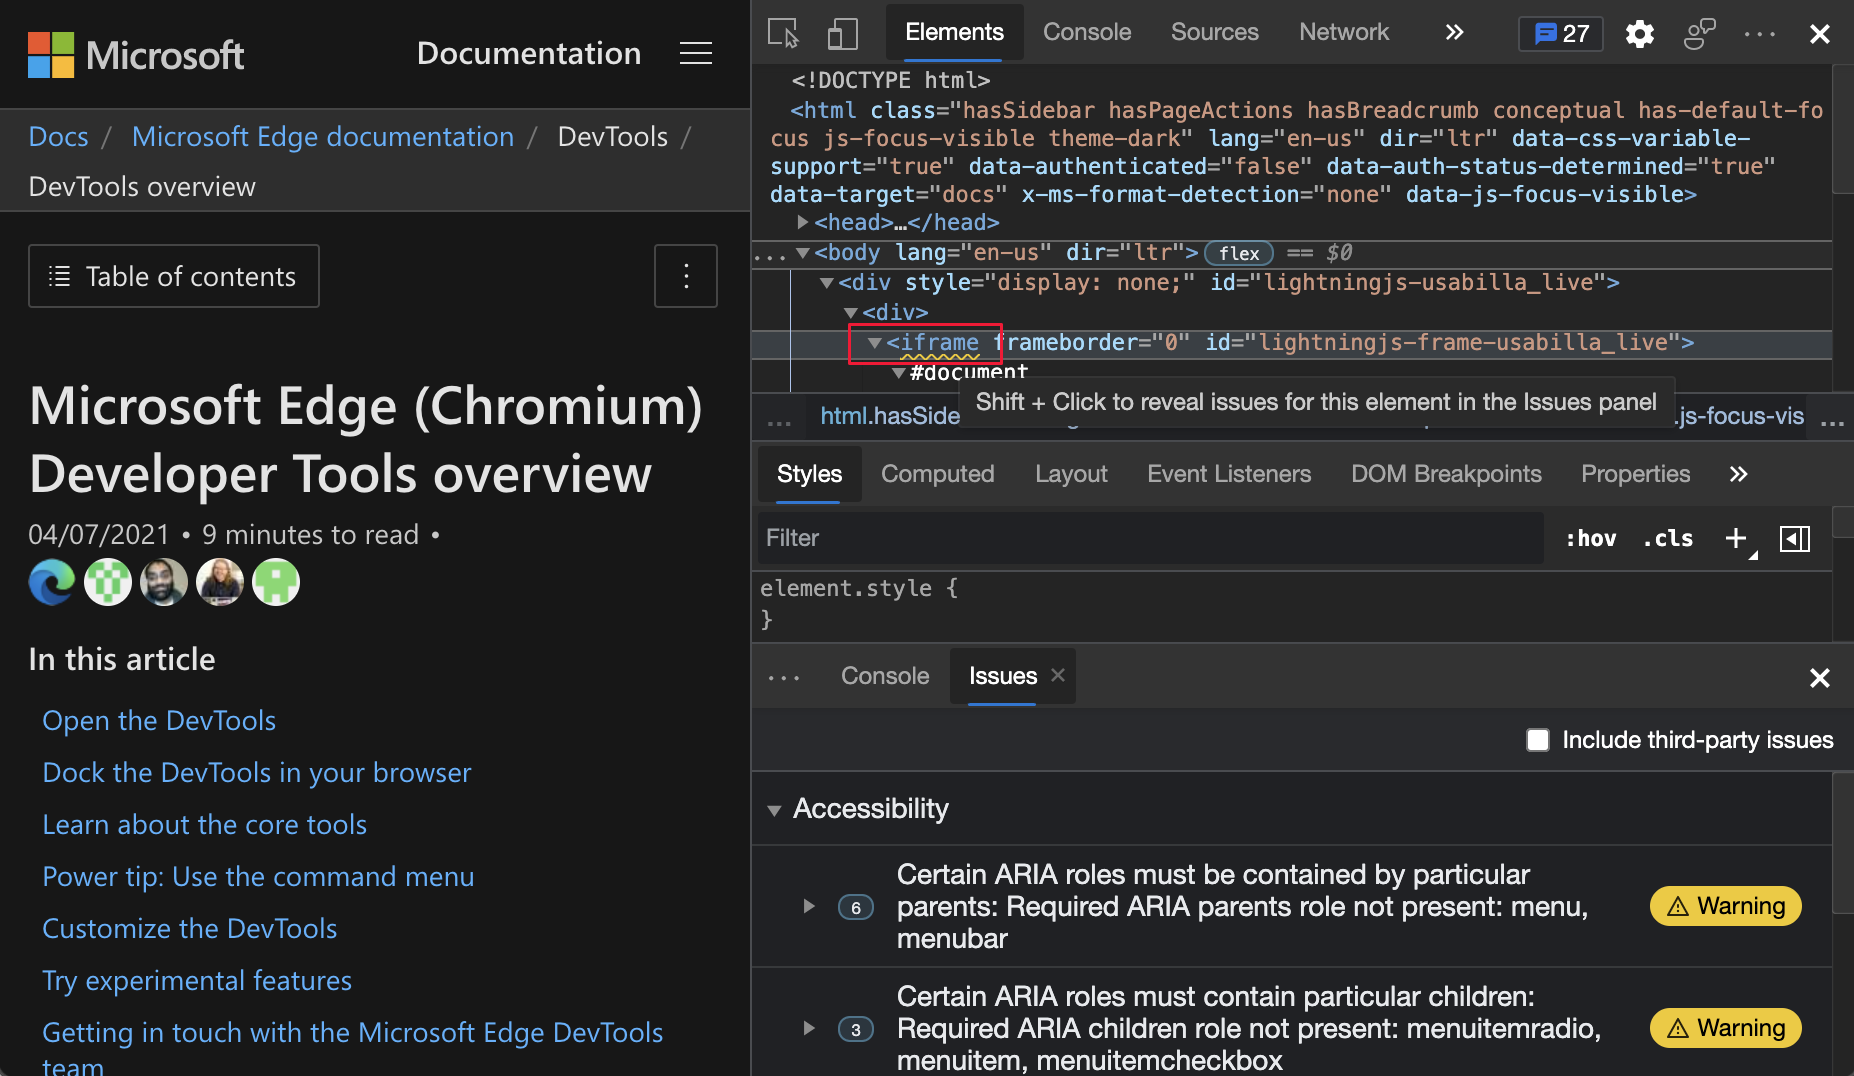
In most modern IDEs, wavy underlines under text indicate syntax errors. In Microsoft Edge version 91 or later, wavy underlines display under HTML in the DOM view of the Elements tool. The wavy underlines indicate code issues and suggestions related to accessibility, compatibility, performance, and so on.
To open the Issues tool and learn more about the issue and how to fix it:
Press and hold Shift, and then click a wavy underline.
Or, right-click a wavy underline, and then select Show in Issues.
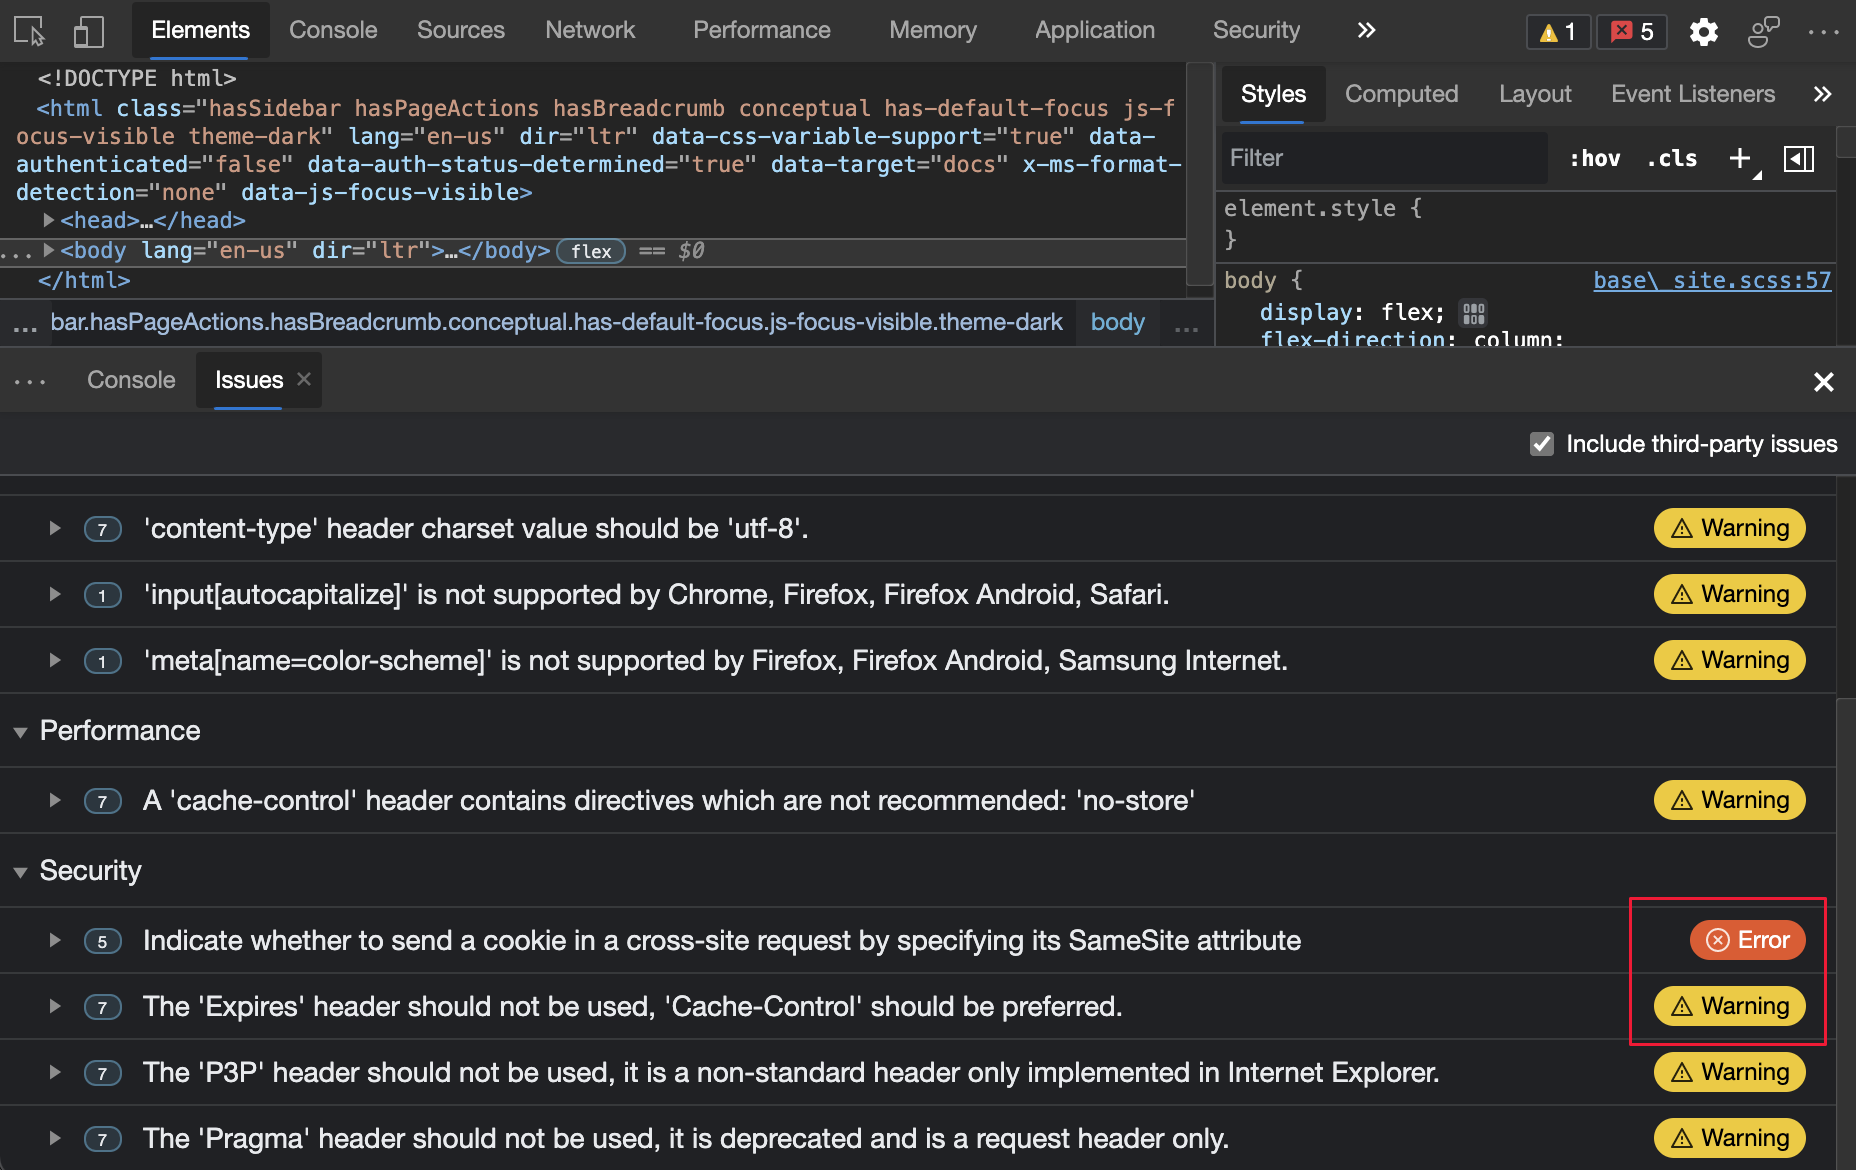
Selecting the underlined error in the Elements tool:
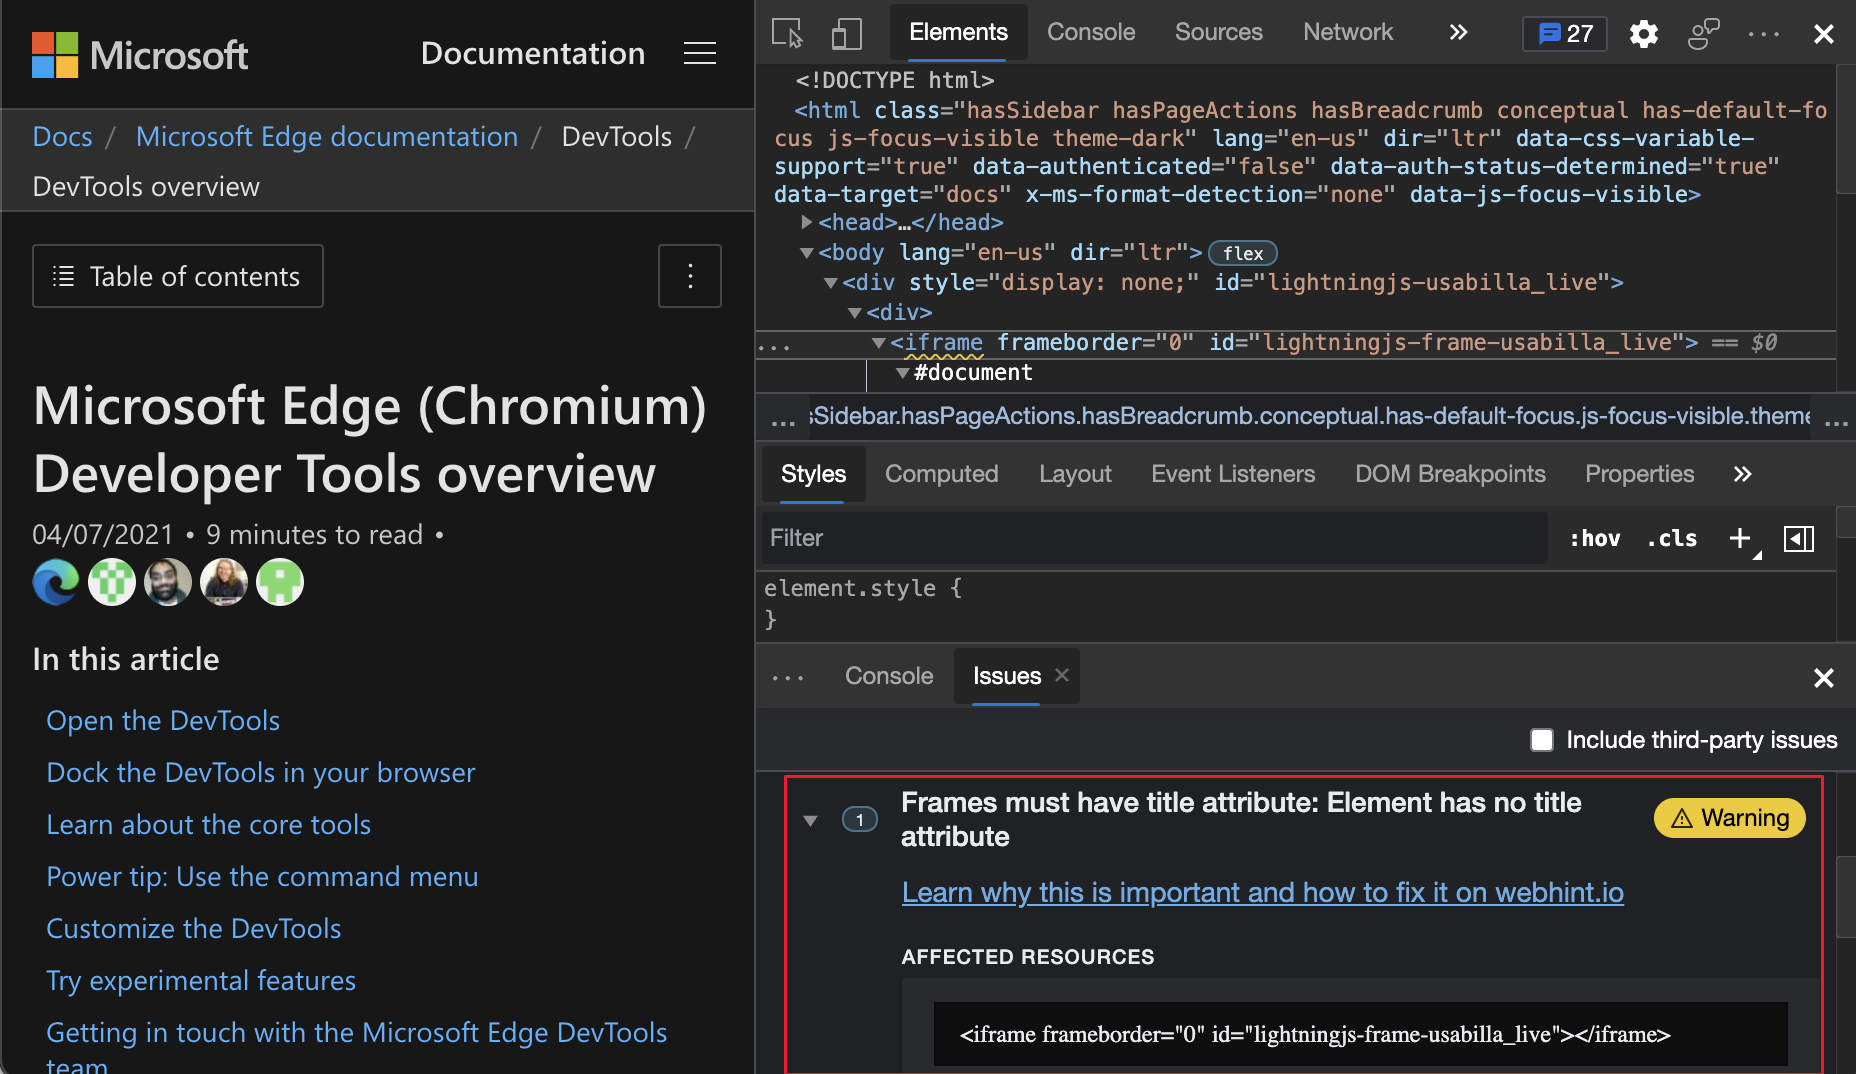
Displaying error details in the Issues tool:
See also:
Learn about DevTools with informative tooltips
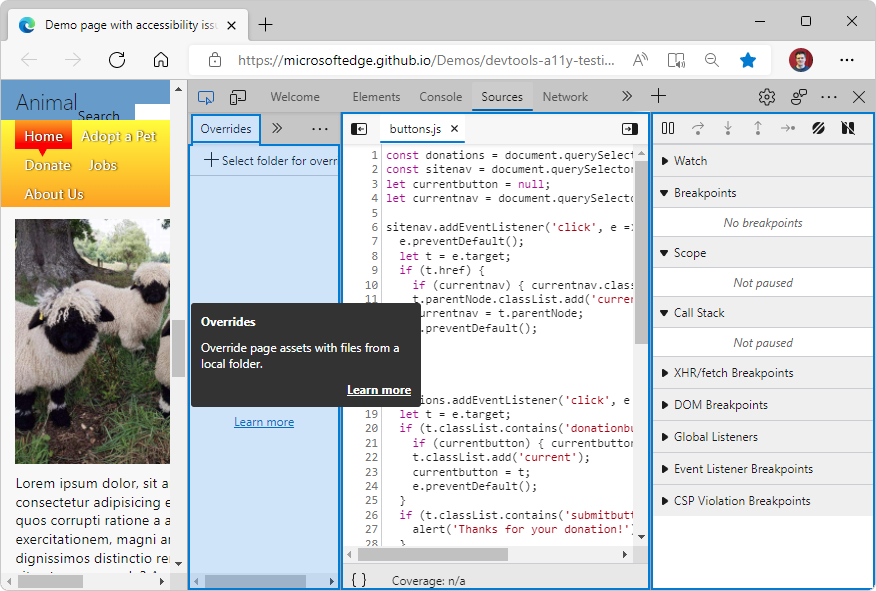
The DevTools Tooltips feature helps you learn about all the different tools and panes. Hover over each outlined region of DevTools to learn more about how to use the tool. To turn on Tooltips, do any of the following:
- Select Customize and control DevTools (
...) > Help > Toggle the DevTools Tooltips. - Press Ctrl+Shift+H (Windows, Linux) or Command+Shift+H (macOS).
- Open the Command Menu and then type tooltips.
Then hover over each outlined region of DevTools:
To turn off Tooltips, press Esc.
Update: This feature has been released and is no longer experimental.
Note: As of May 2022, tooltips aren't supported from the Activity Bar.
Service worker update timeline
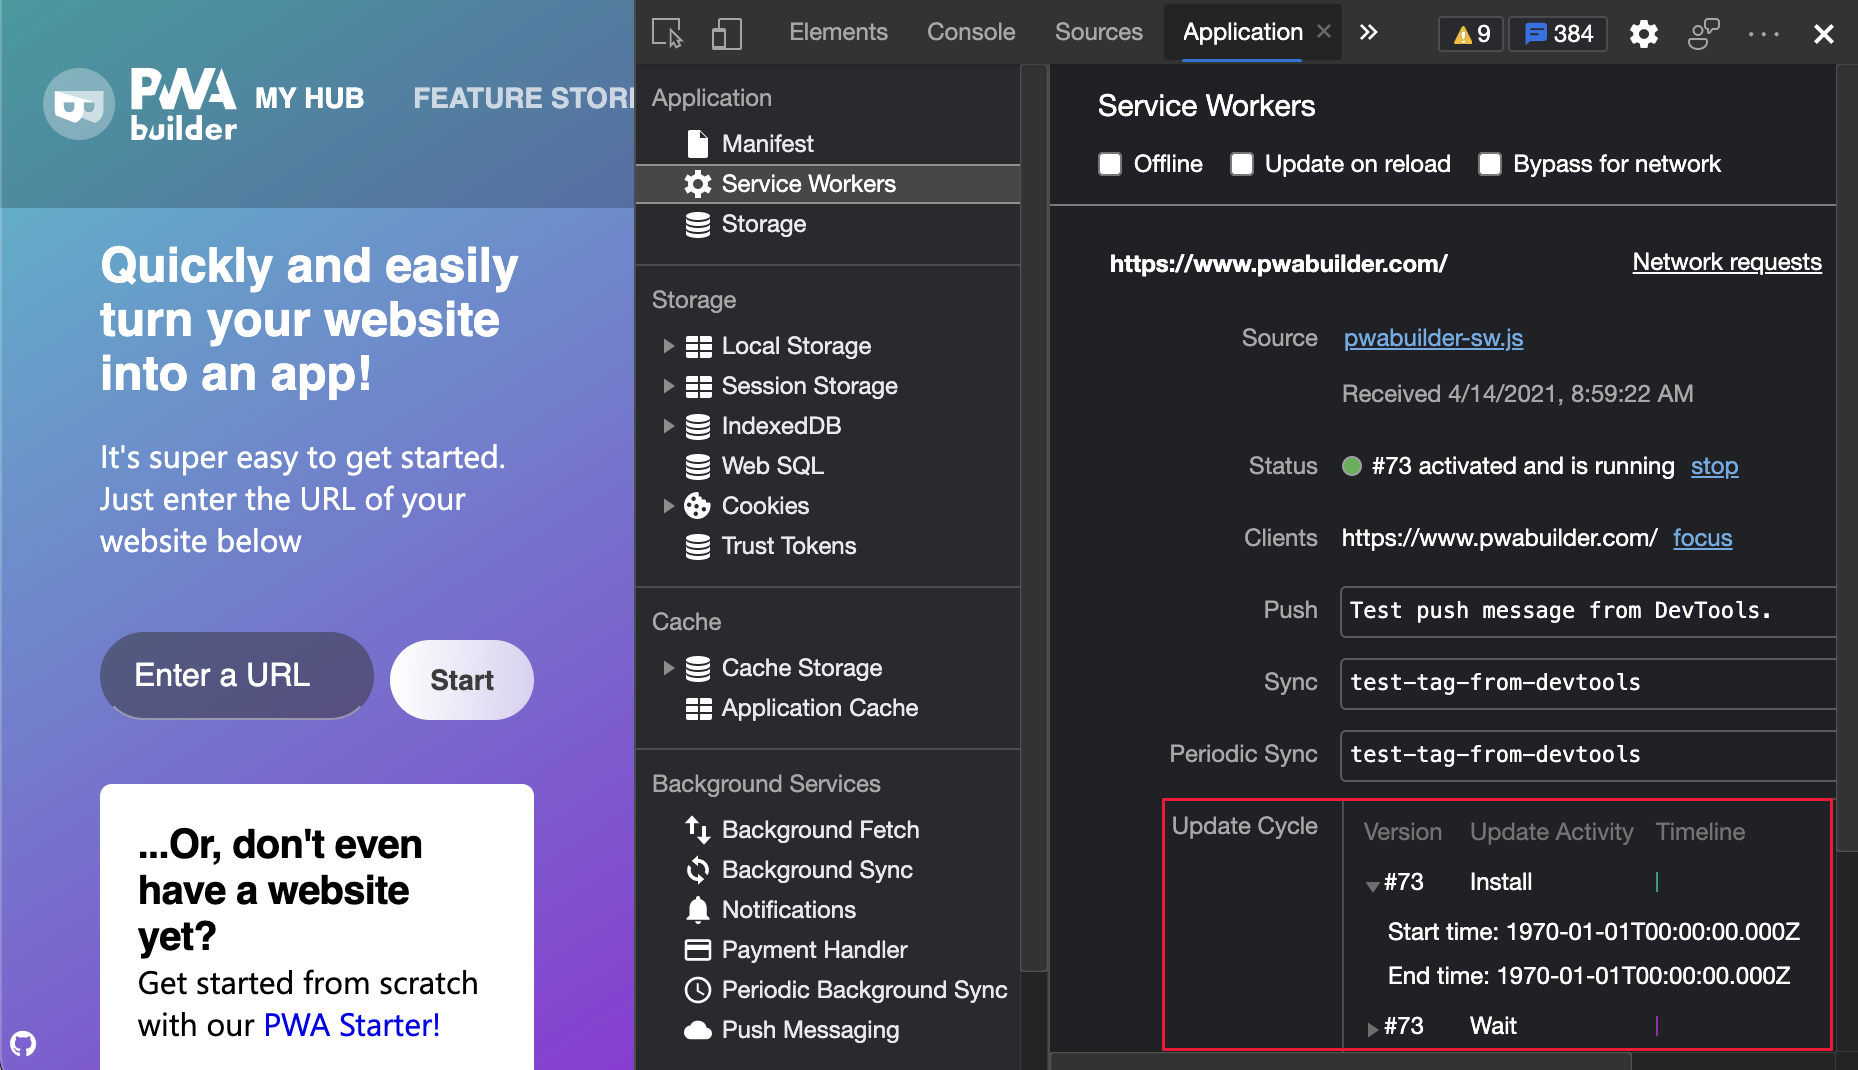
In Microsoft Edge version 91 or later, if you're a Progressive Web App or service worker developer, display the update lifecycle of your service workers as a timeline in the Application tool. This feature helps you understand the time your service worker spends in each of the following stages:
- Install
- Wait
- Activate
For real-time updates on this feature in the Chromium open-source project, see Issue 1066604.
See also:
- Updating the service worker in The service worker lifecycle at web.dev.
- Service worker improvements - DevTools debugging tools for Progressive Web Apps and service workers.
Progressive Web Apps no longer display warnings for non-square icons
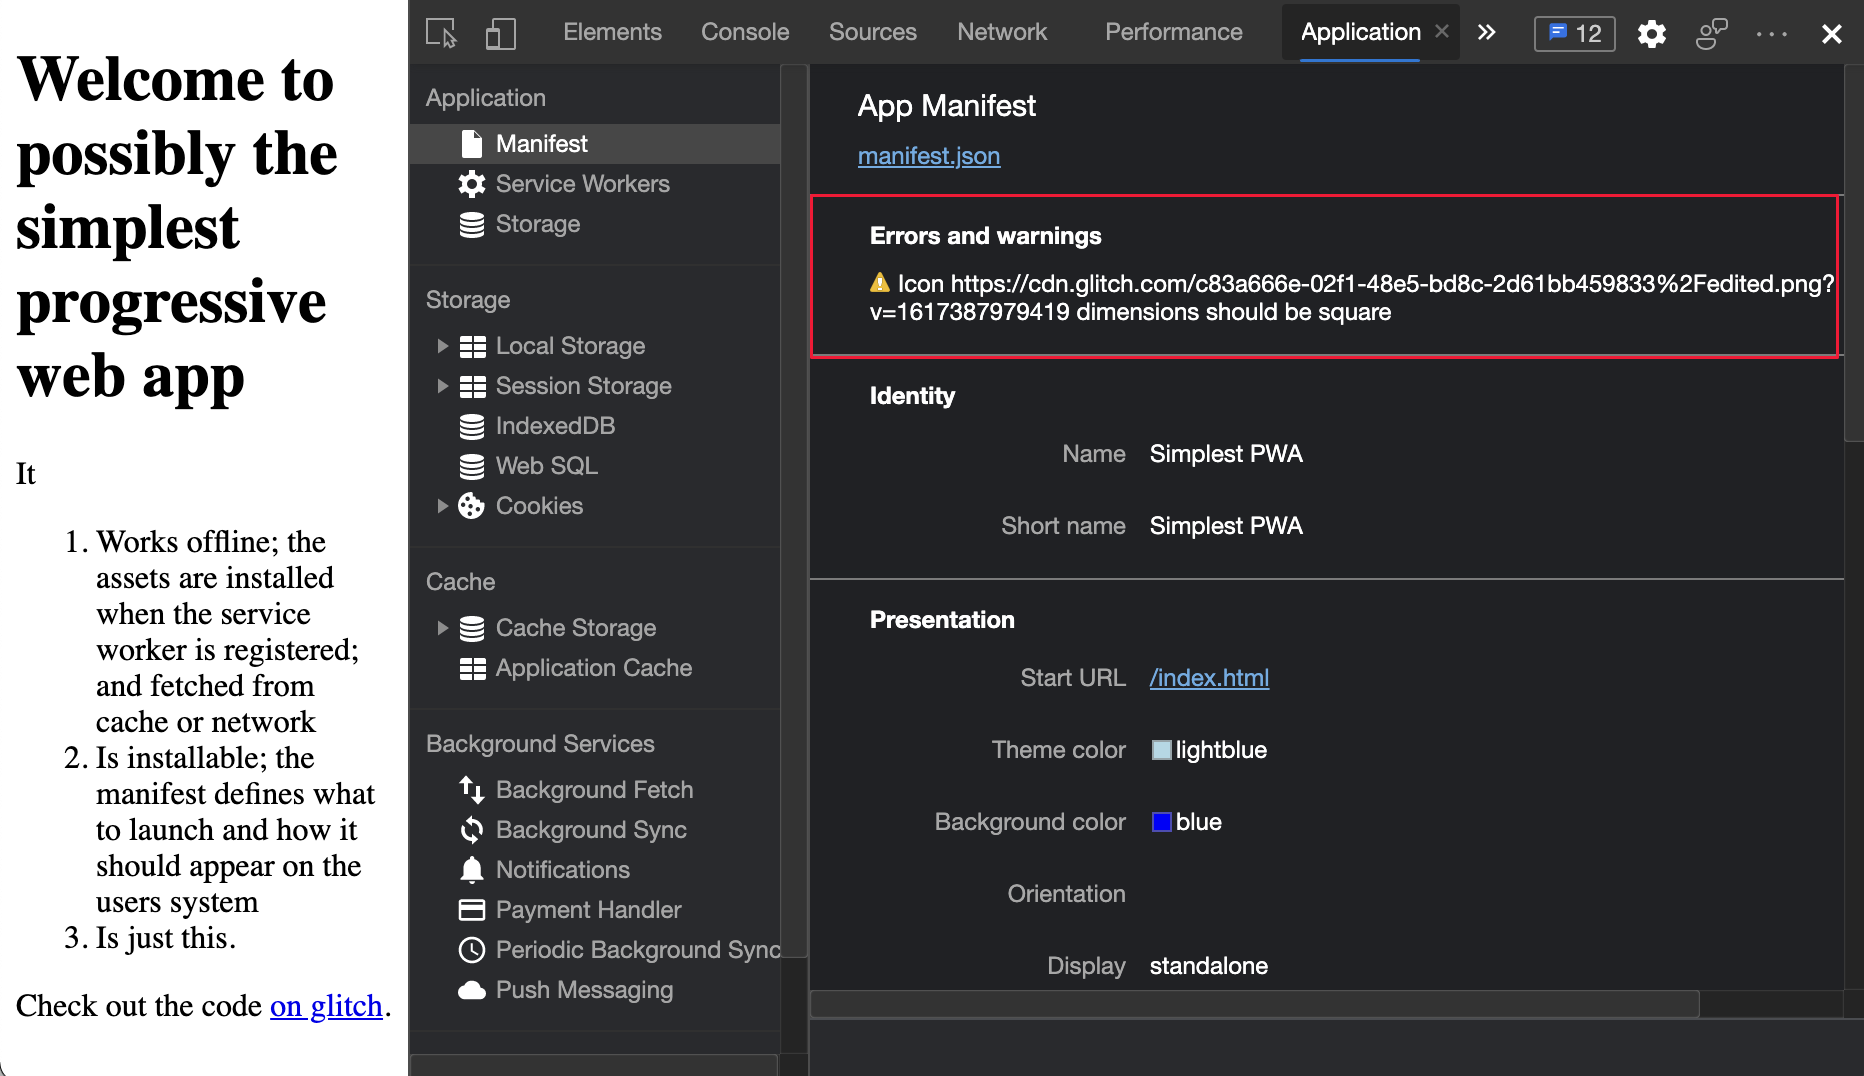
In Microsoft Edge version 90 or earlier, if the Web App Manifest of your PWA included a non-square icon, a warning was displayed in the Errors and Warnings section for each non-square icon. In Microsoft Edge version 91 or later, the Manifest section in the Application tool displays no warnings if you provide at least one square icon. If you don't provide any square icons, the following warning message appears:
Most operating systems require square icons. Please include at least one square icon in the array.
In Microsoft Edge version 90 or earlier, an error is displayed for each icon that is non-square:
In Microsoft Edge version 91 or later, no error is displayed when you provide at least one square icon:
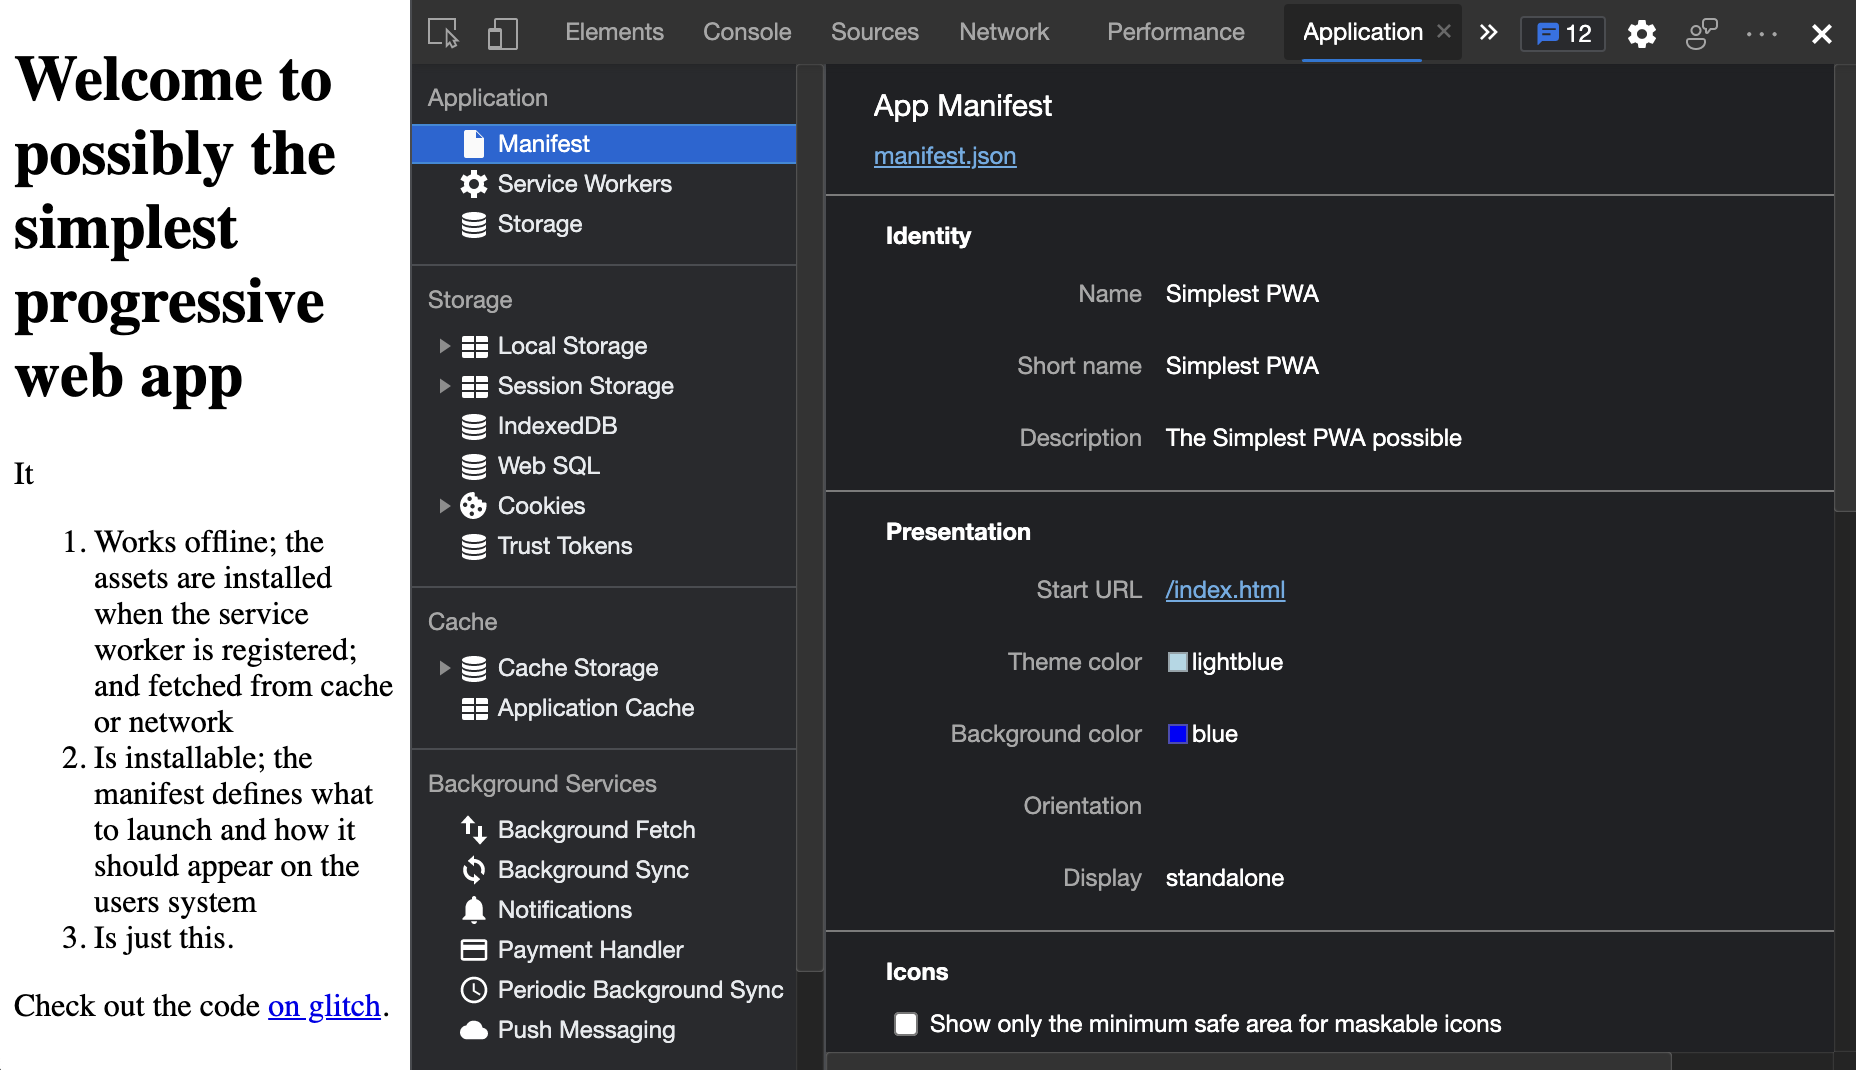
To view errors and warnings in your Web App Manifest, select Application tool > Application section > Manifest. Errors and warnings are listed under the Errors and Warnings heading.
For real-time updates on this feature in the Chromium open-source project, see Issue 1185945.
See also:
- The web app manifest in Making PWAs installable at MDN > References > Progressive web apps > Guides.
- Web app manifests at MDN > References.
- PWABuilder: Image Generator - creates app icons for various platforms, to include in your Web App Manifest.
Localized DevTools now supported in Chromium-based browsers
Starting in Microsoft Edge version 81, the Microsoft Edge DevTools UI is displayed in your own language. Many developers use developer tools such as StackOverflow and Visual Studio Code in their native language. To provide similar flexibility of UI language, the Microsoft Edge DevTools team, Chrome DevTools team, and the Google Lighthouse team collaborated to provide the same experience in all Chromium-based browsers.
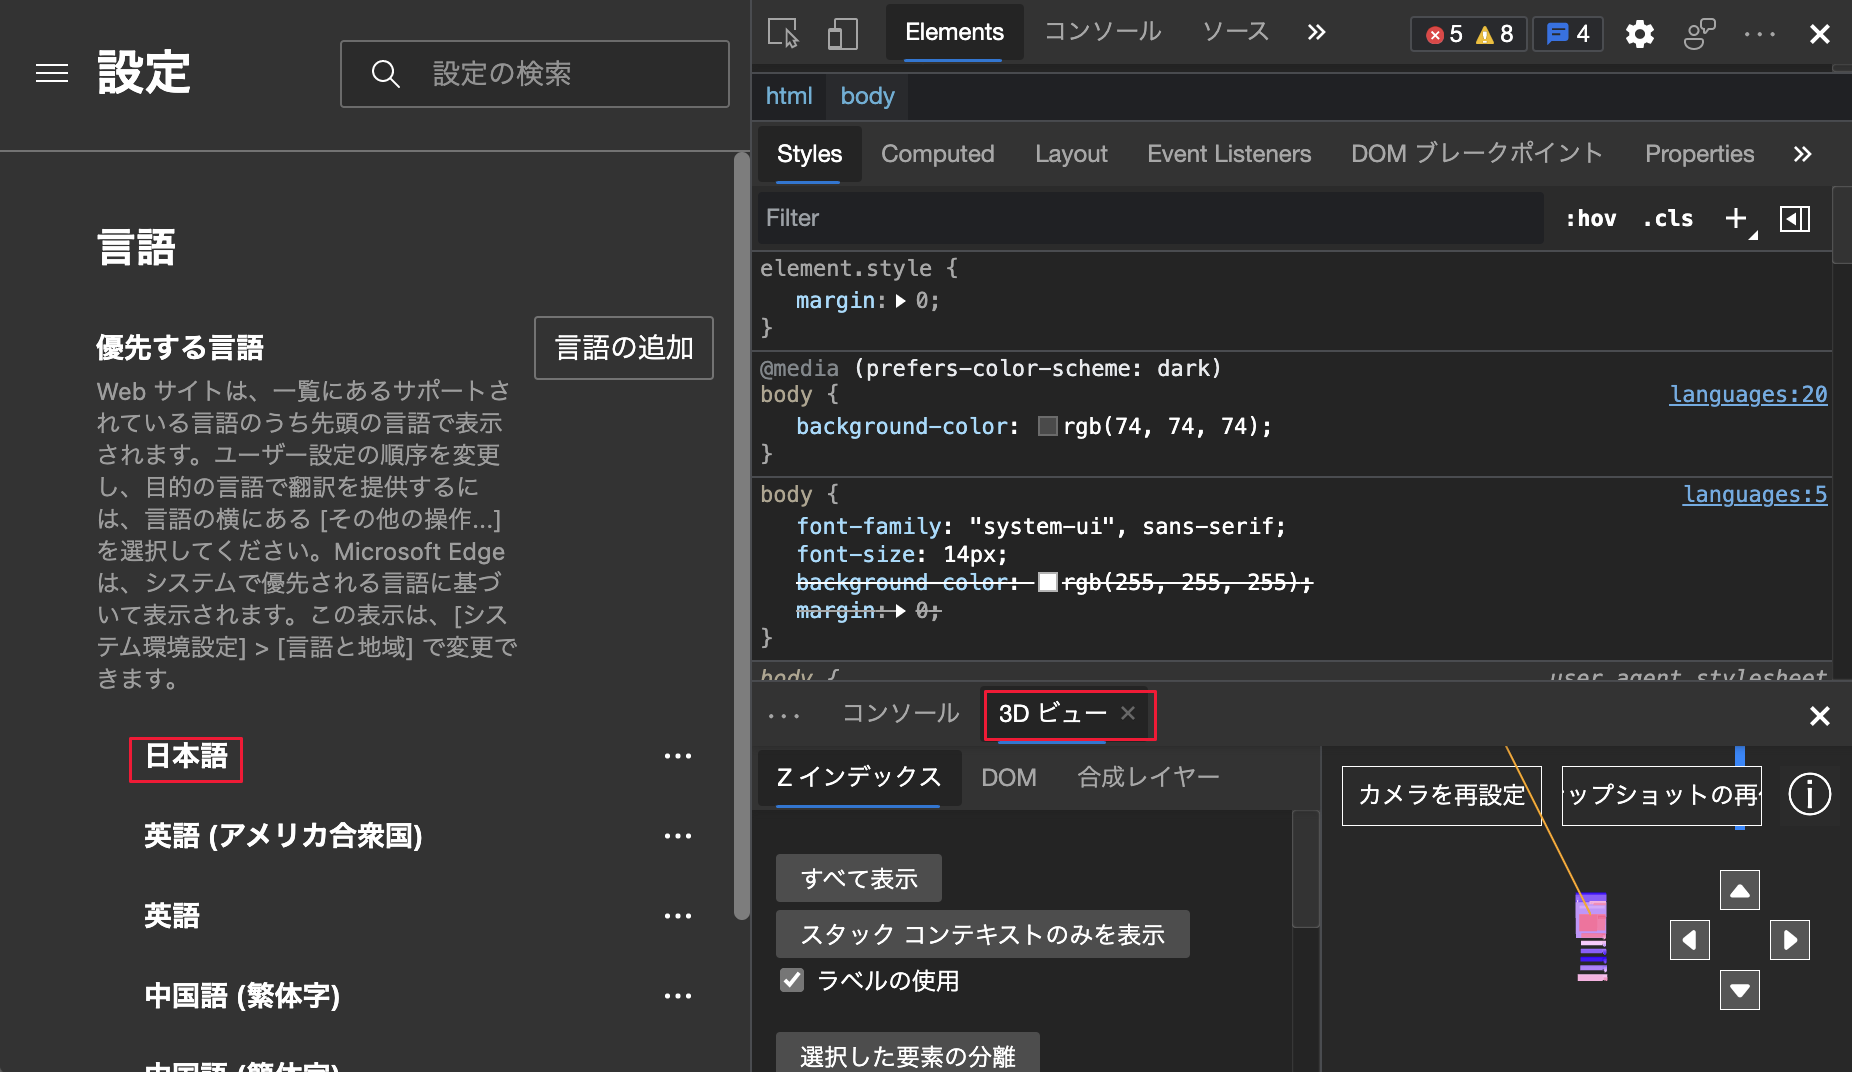
See Change DevTools language settings.
For more information about the collaboration on this feature in the Chromium open-source project, see Issue 1136655.
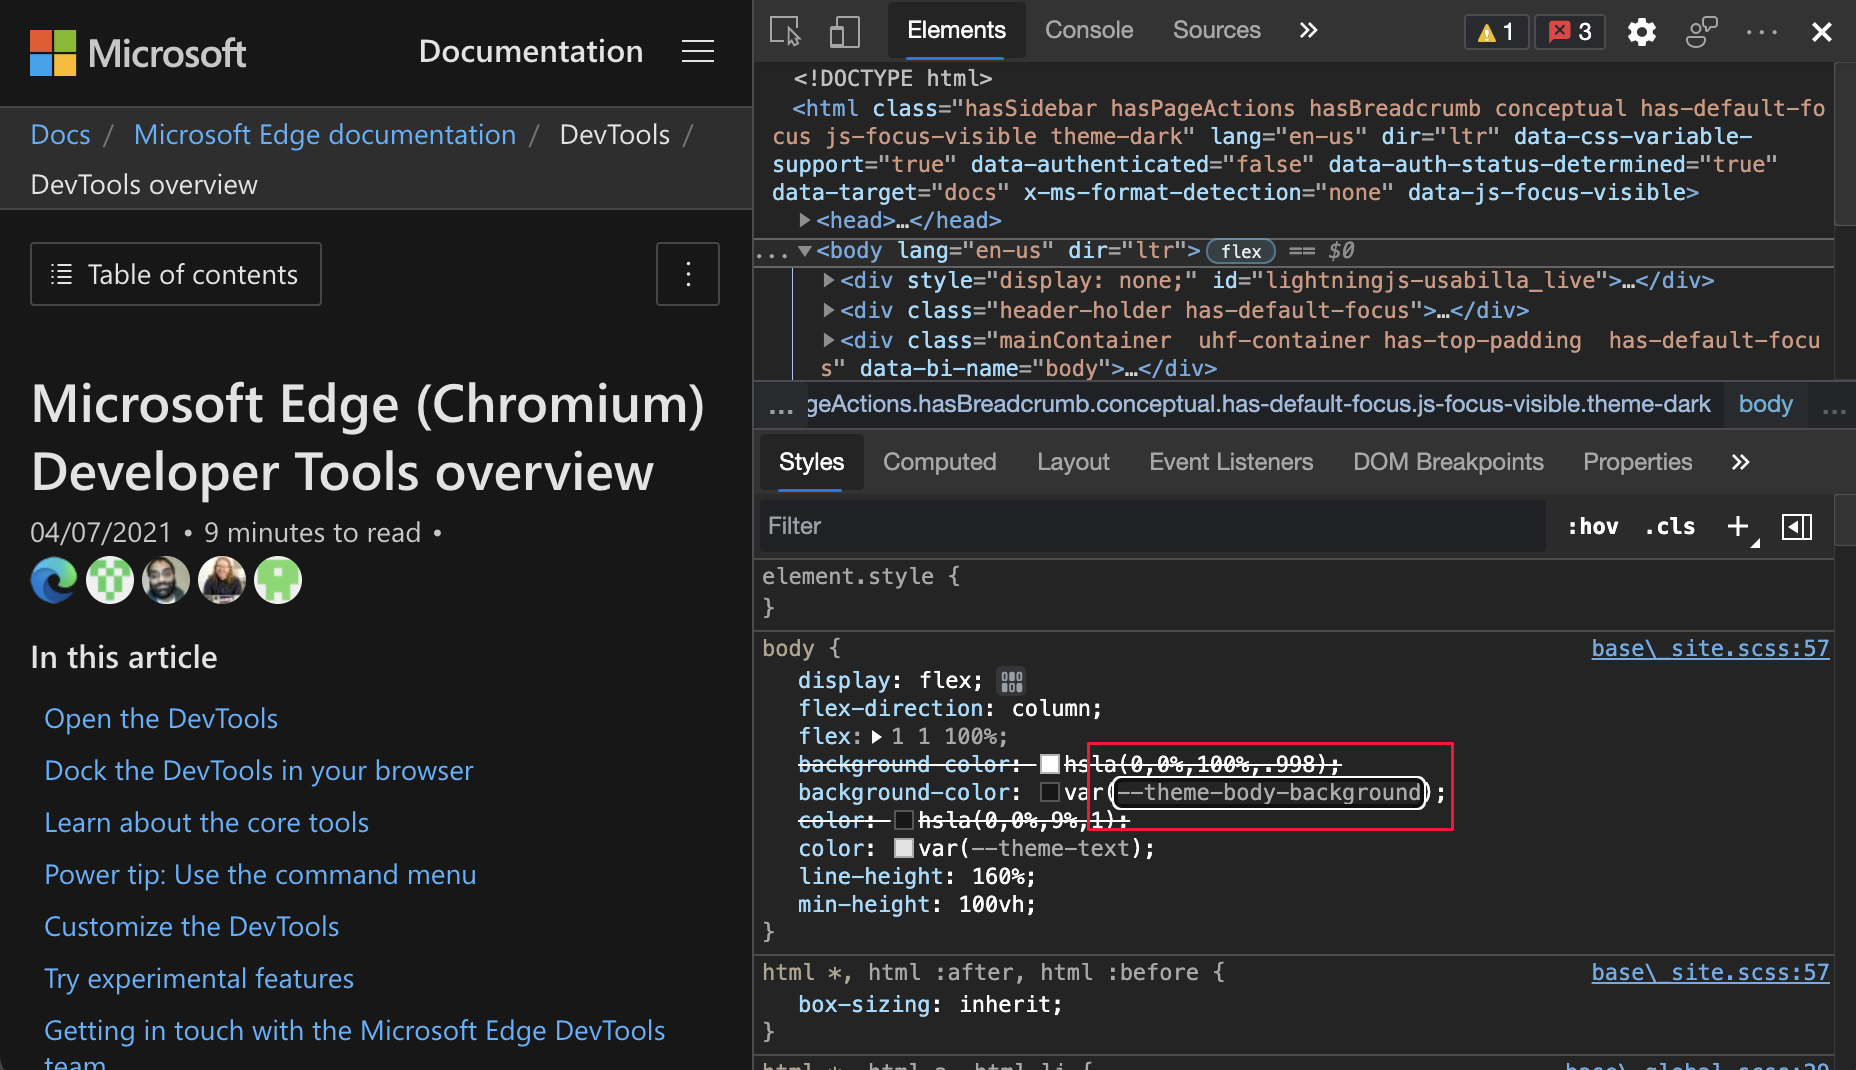
Use the keyboard to navigate to CSS variables
Starting in Microsoft Edge version 88, the Styles pane displays CSS variables and provides a link directly to the definition of each variable. In Microsoft Edge version 91 or later, you can use the arrow keys to easily navigate to CSS variables. To open the definition in the Styles pane, hover on a variable, and then press Enter:
For real-time updates on this feature in the Chromium open-source project, see Issue 1187735.
See also:
Issues are automatically sorted by severity
The Issues tool displays recommendations to improve your website, including accessibility, performance, security, and so on. Based on user feedback, issues are now automatically sorted by severity. In each feedback category, each issue that's marked as an Error appears first, followed each issue marked as a Warning, then each issue marked as a Tip:
See also:
Microsoft Edge Developer Tools for Visual Studio Code version 1.1.7
The Microsoft Edge Tools for Visual Studio Code extension version 1.1.7 provides the DevTools from Microsoft Edge version 88. This extension now supports ARM devices and no longer depends on the Debugger for Microsoft Edge extension.
Version 1.1.7 includes the following bug fixes and improvements:
Updated the reliability of target closure.
Updated the side panel to automatically refreshes when you debug targets that are created or destroyed.
Added a new right-click menu that gives you faster access to the extension settings and the latest Changelog.
Updated and simplified the release of extension documentation including the newest features.
To manually update to version 1.1.7, see Update an extension manually. You can file issues and contribute to the extension on the vscode-edge-devtools GitHub repo.
See also:
Announcements from the Chromium project
The following sections announce additional features available in Microsoft Edge that were contributed to the open-source Chromium project.
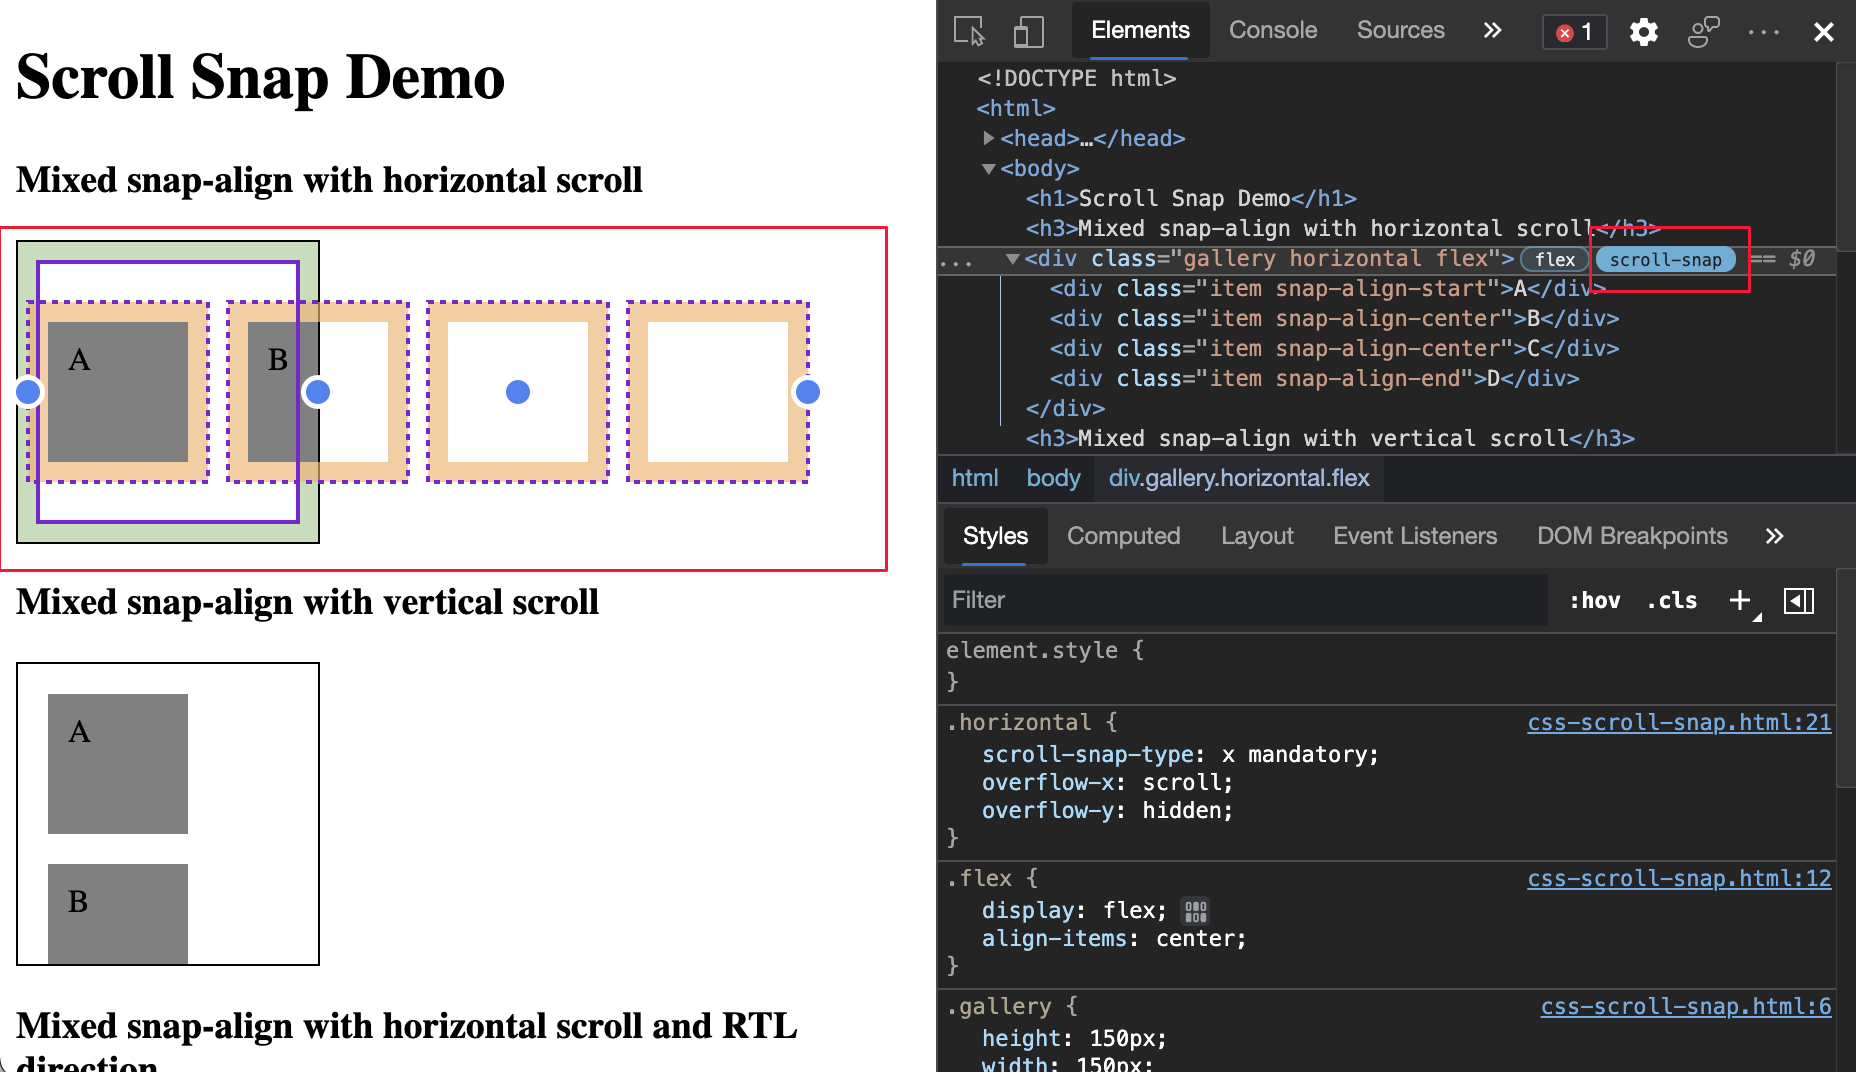
Visualize CSS scroll-snap
In the Elements tool, you can now toggle the scroll-snap badge to inspect the CSS scroll-snap alignment. When an HTML element on your webpage has scroll-snap-type applied to it, a scroll-snap badge is displayed next to it in the Elements tool. Click the scroll-snap badge to toggle displaying a scroll-snap overlay on the webpage.
For an example webpage, see Scroll Snap Demo. In the example, dots appear on snap edges. The scroll port has a solid outline, while the snap items have dashed outlines. The scroll padding is filled-in green, while the scroll margin is filled-in orange:
For the history of this feature in the Chromium open-source project, see Issue 862450.
See also:
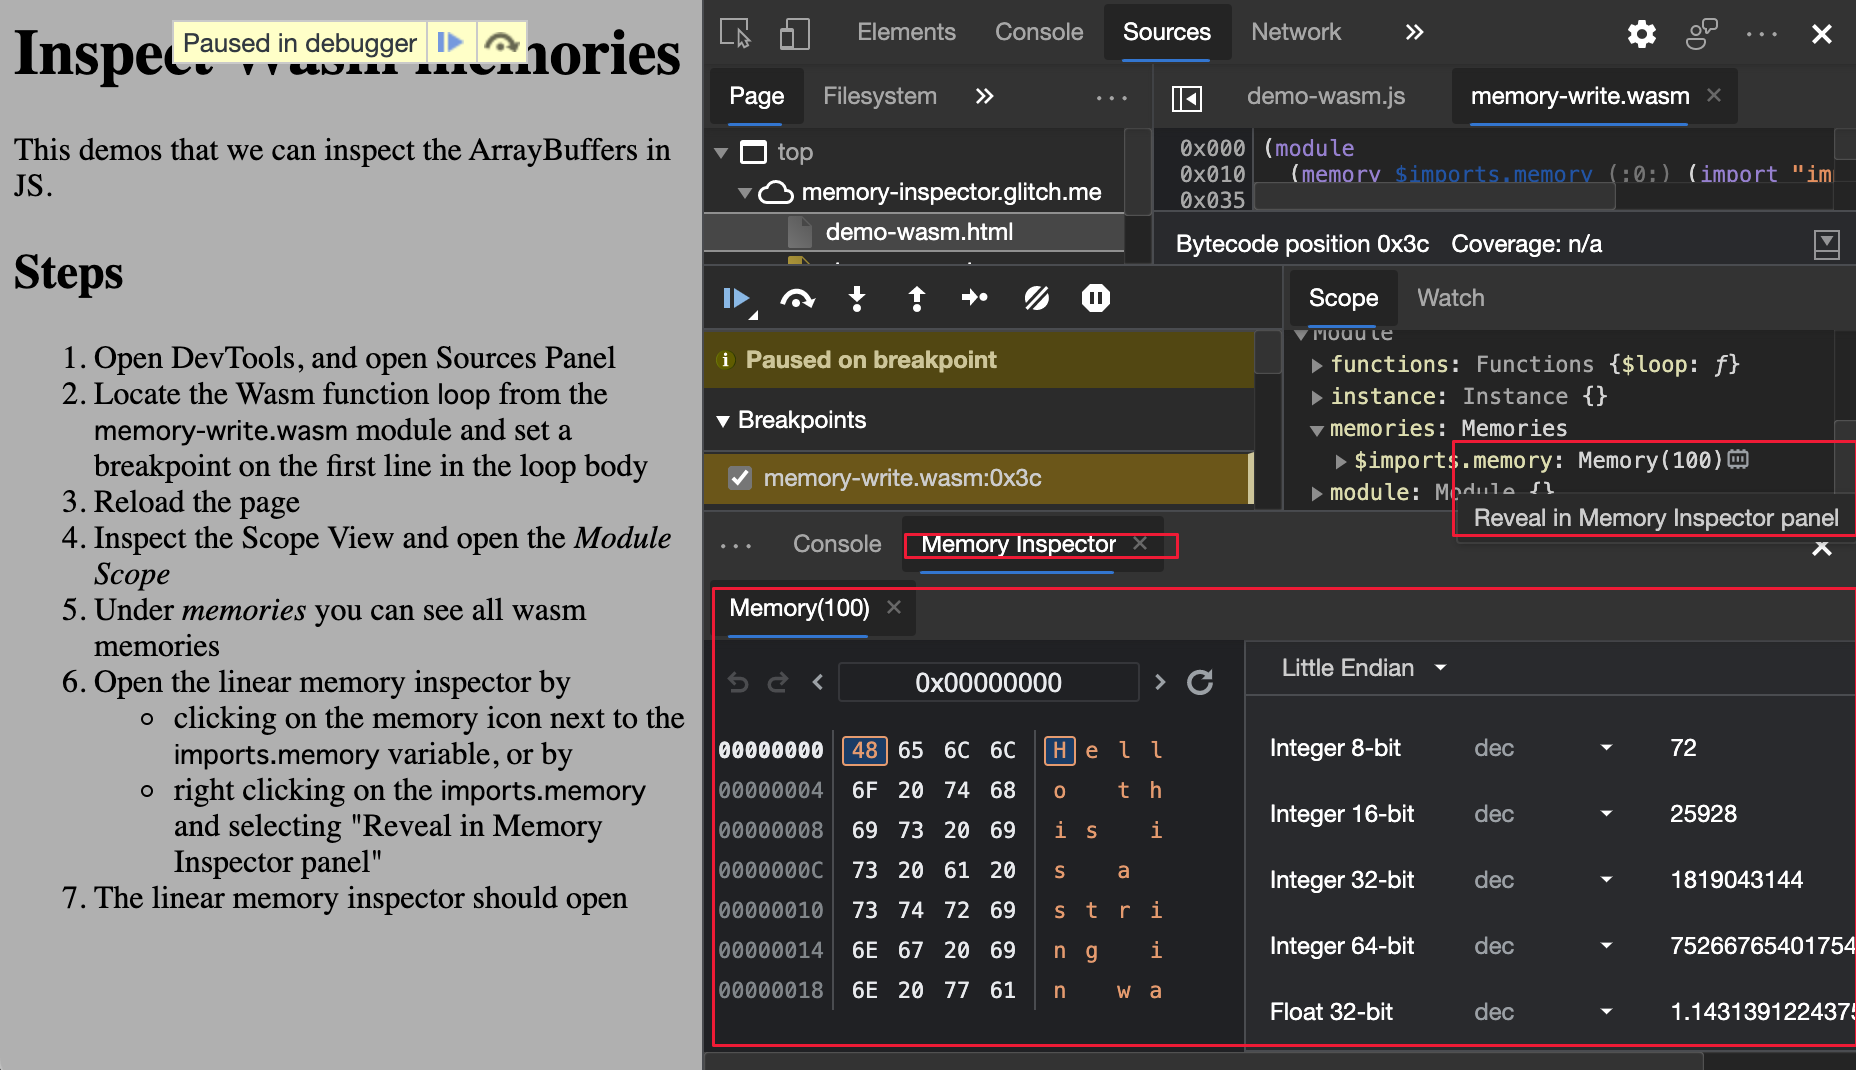
New Memory inspector tool
Use the new Memory inspector tool to inspect an ArrayBuffer in JavaScript and Wasm memory:
See:
- Inspect a JavaScript ArrayBuffer with the Memory inspector tool
- Using the Debugger pane to debug JavaScript code
For the history of this feature in the Chromium open-source project, see Issue 1166577.
New Badge settings pane in the Elements tool
Now, use the Badge settings in the Elements tool to turn on (or off) individual badges. Use this feature to customize and stay focused on important badges while you inspect webpages.
Right-click an element and then click Badge settings. The badge settings pane opens at the top of the Elements tool:
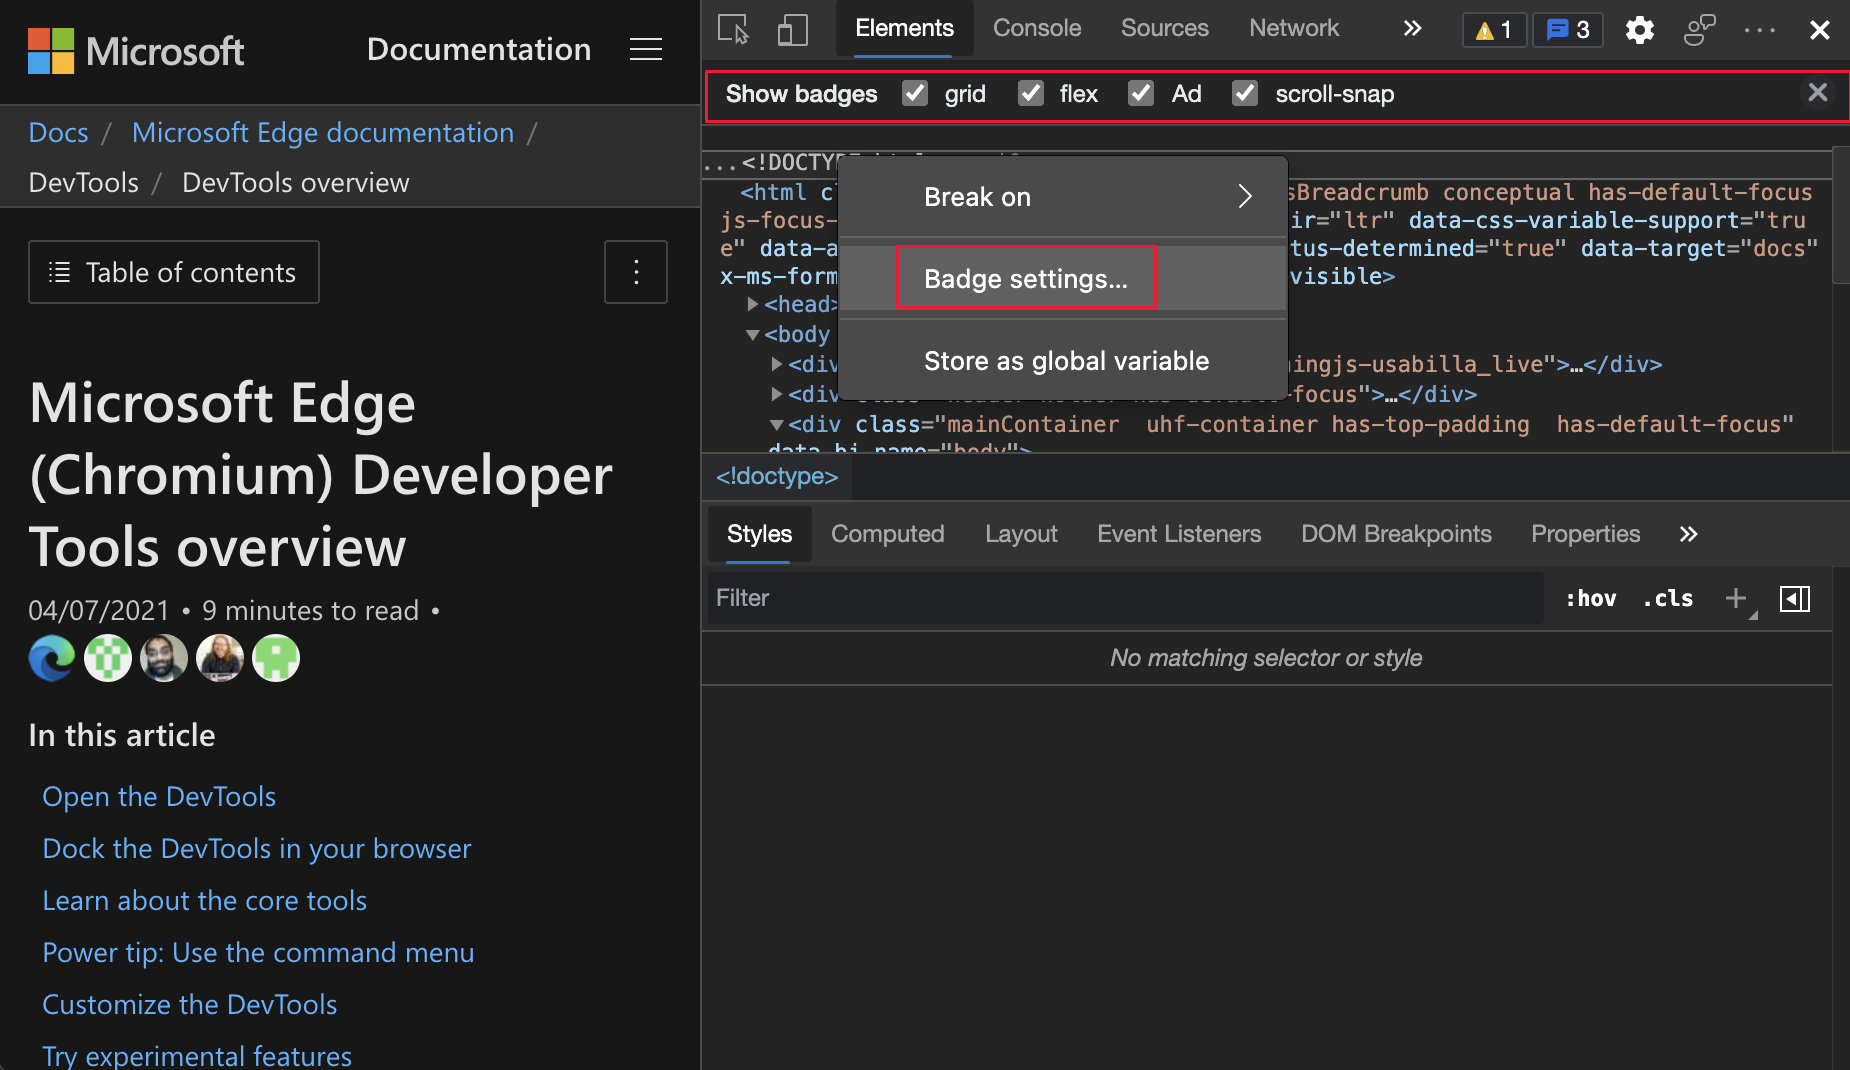
To display (or hide) the badges, select (or clear) the checkbox next to the badge name.
See also:
Enhanced image preview with aspect ratio information
In the Elements tool, image previews have been enhanced to display more information, including the following details:
- Rendered size
- Rendered aspect ratio
- Intrinsic size
- Intrinsic aspect ratio
- File size
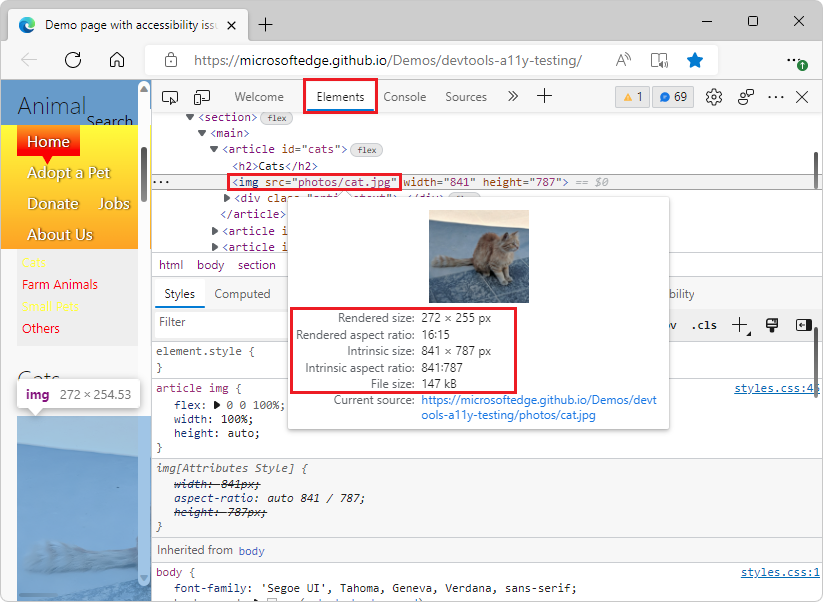
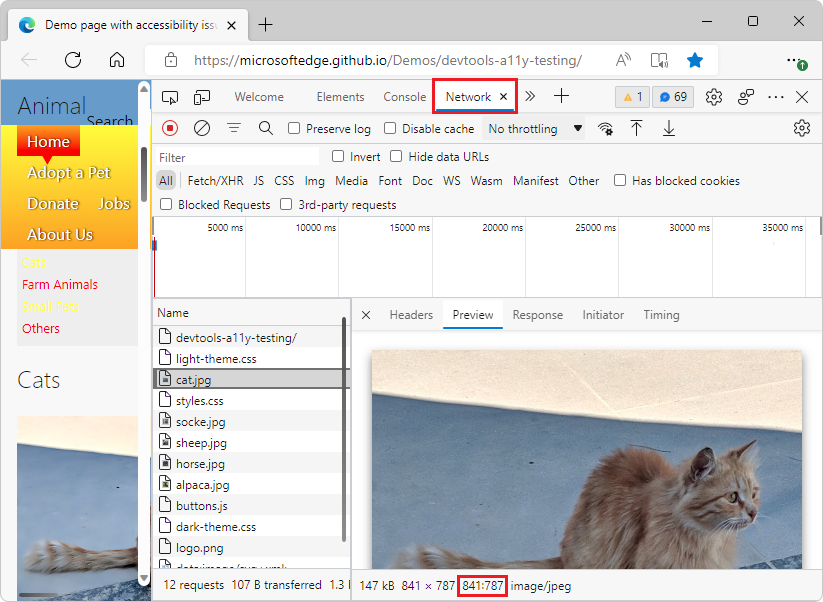
This information helps you better understand your images and apply optimization. The image aspect ratio information is also available in the Network tool, when you click a page resource that's an image:
For the history of this feature in the Chromium open-source project, see Issues 1149832 and 1170656.
See also:
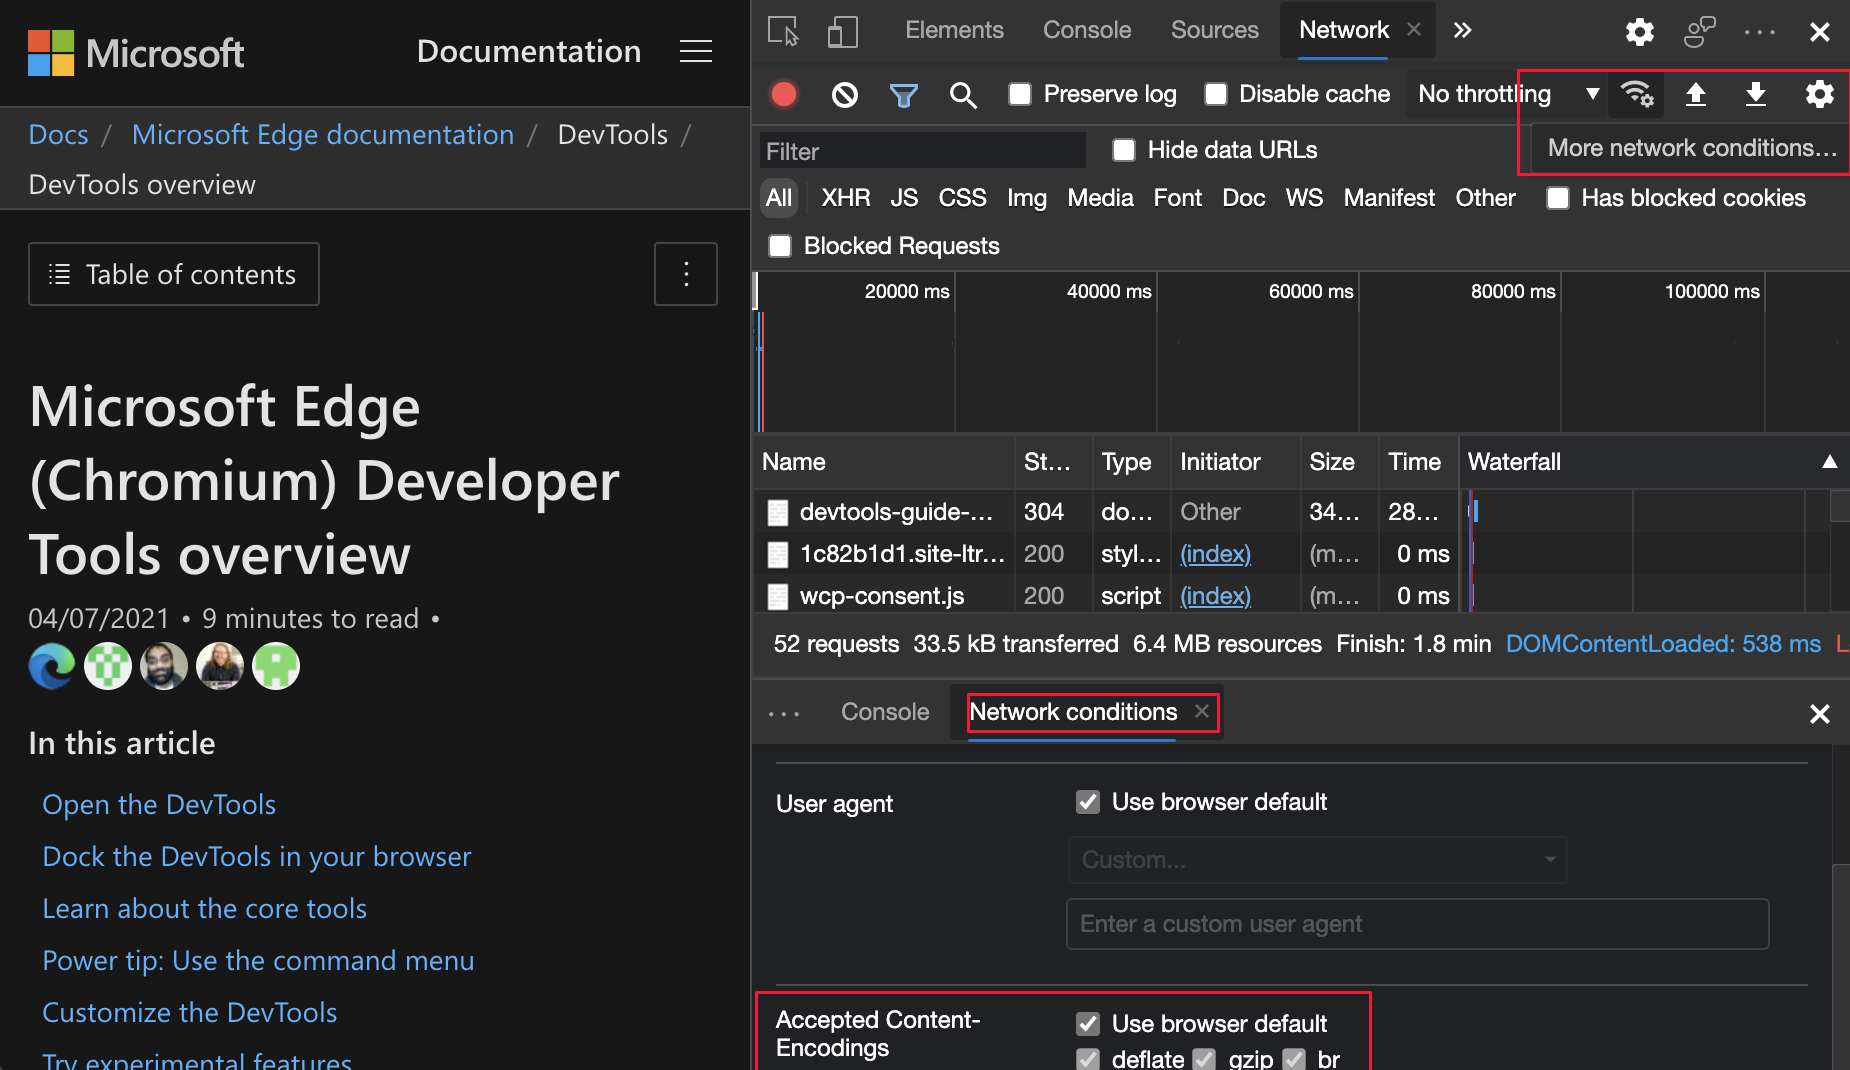
New options to configure Content-Encodings in the Network conditions tool
In the Network tool, click the new More network conditions... button next to the Throttling dropdown menu to open the Network conditions tool. To test if server responses are correctly encoded for browsers that don't support gzip, brotli, or another future Content-Encoding:
Open the Network conditions tool.
Go to Accepted Content-Encodings.
Clear the checkbox next to the
Content-Encodingyou want to test.
See also:
For the history of this feature in the Chromium open-source project, see Issue 1162042.
Styles pane enhancements
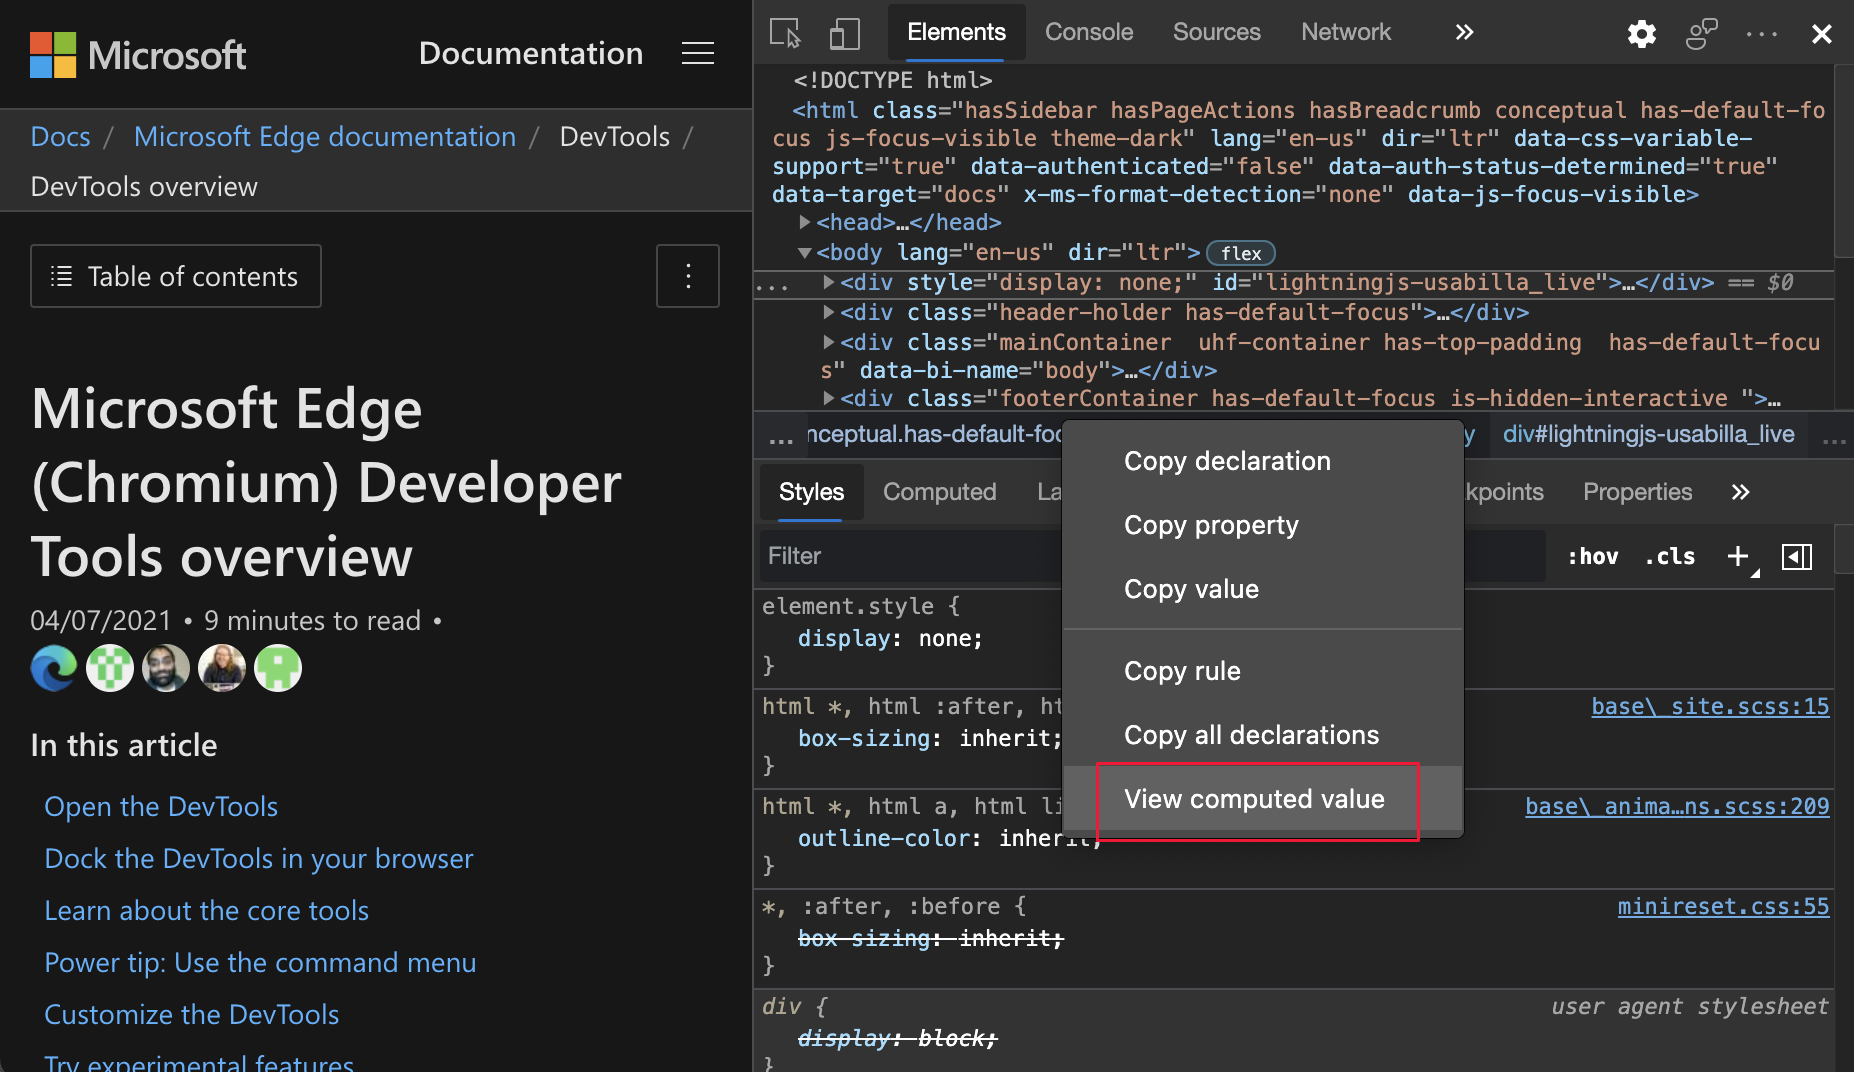
New shortcut to display computed value in the Styles pane
Now, to display the computed CSS value in the Styles tab in the Elements tool:
Right-click a CSS property, and then select View computed value:
See also:
- View only the CSS that is actually applied to an element in CSS features reference.
- View the Computed sidebar pane in the Styles pane in What's New in DevTools (Microsoft Edge 87).
- Explore all computed styles in Navigate DevTools with assistive technology.
To view the history of this feature in the Chromium open-source project, see Issue 1076198.
Support for the accent-color keyword
The autocomplete UI of the Styles pane now detects the accent-color CSS keyword, which allows you to specify the accent color for UI controls generated by the element. Examples of UI controls that are generated by an element include checkboxes or radio buttons.
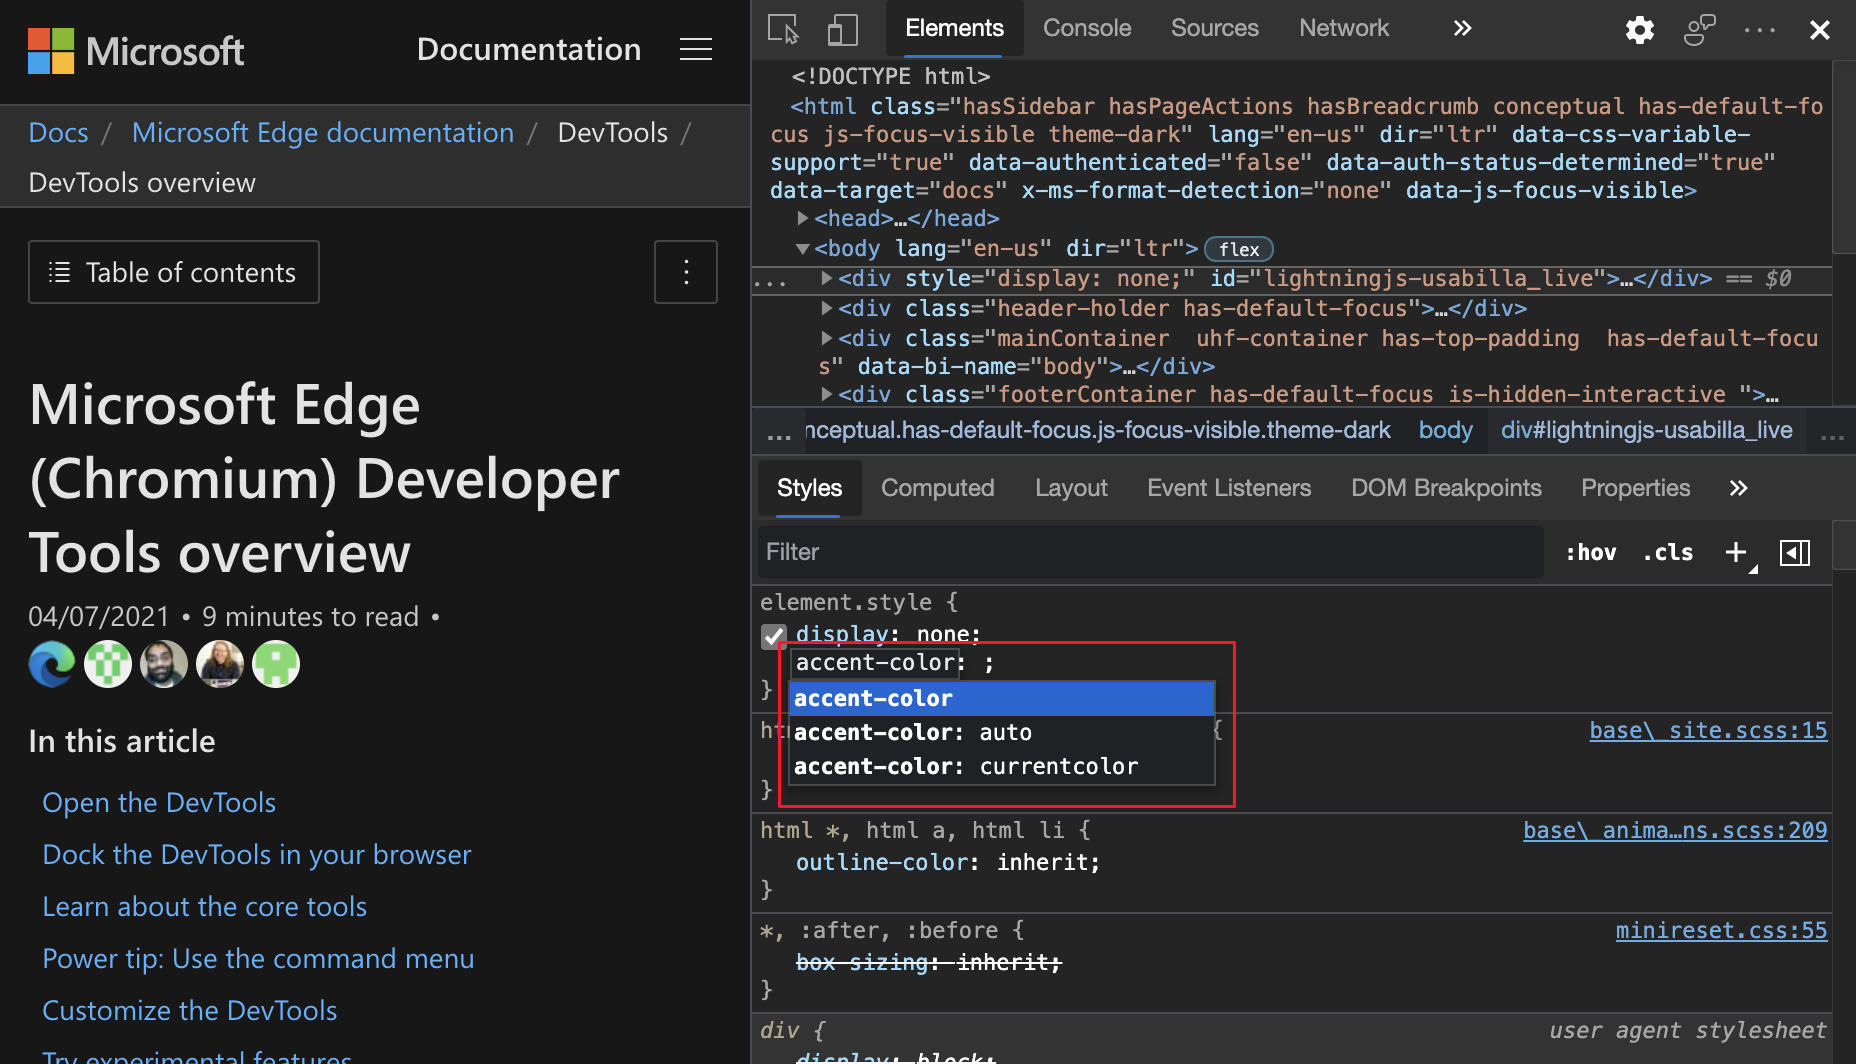
For more information about the status of the Chromium implementation, see Feature: accent-color CSS property. To turn on this feature, go to edge://flags#enable-experimental-web-platform-features and set the checkbox to Enabled.
For the history of this feature in the Chromium open-source project, see Issue 1092093.
See also:
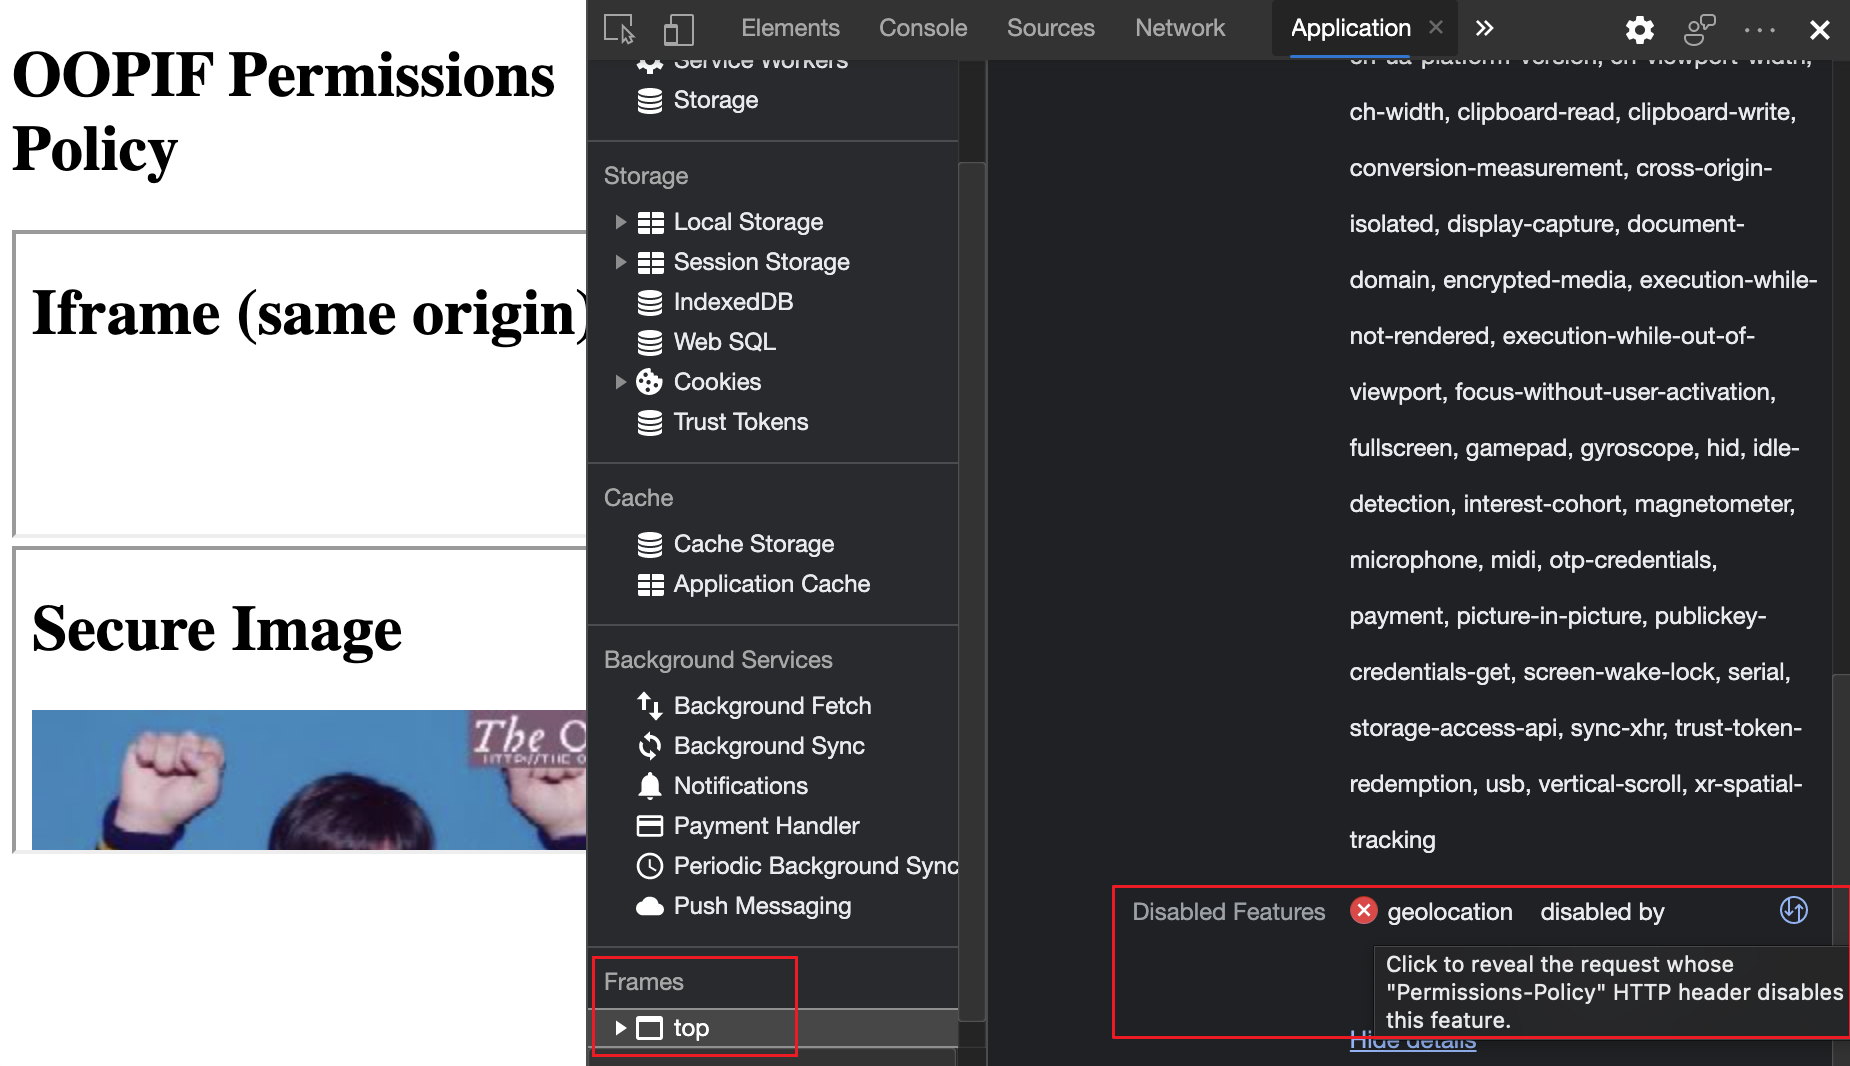
Display details about blocked features in the Frame details view
Permissions Policy is a web platform API that gives a website the ability to allow or block the use of browser features in an individual frame or in an iframe that it embeds.
To display the details on why a feature is blocked:
- Go to OOPIF Permissions Policy.
- Open the Application tool.
- Click a frame.
- Go to the Permissions Policy section.
- Locate the Disabled Features property.
- Click Show details.
- Click the icon next to each policy to go to the
iframeor network request that blocked the feature.
See also:
To view the history of this feature in the Chromium open-source project, see Issue 1158827.
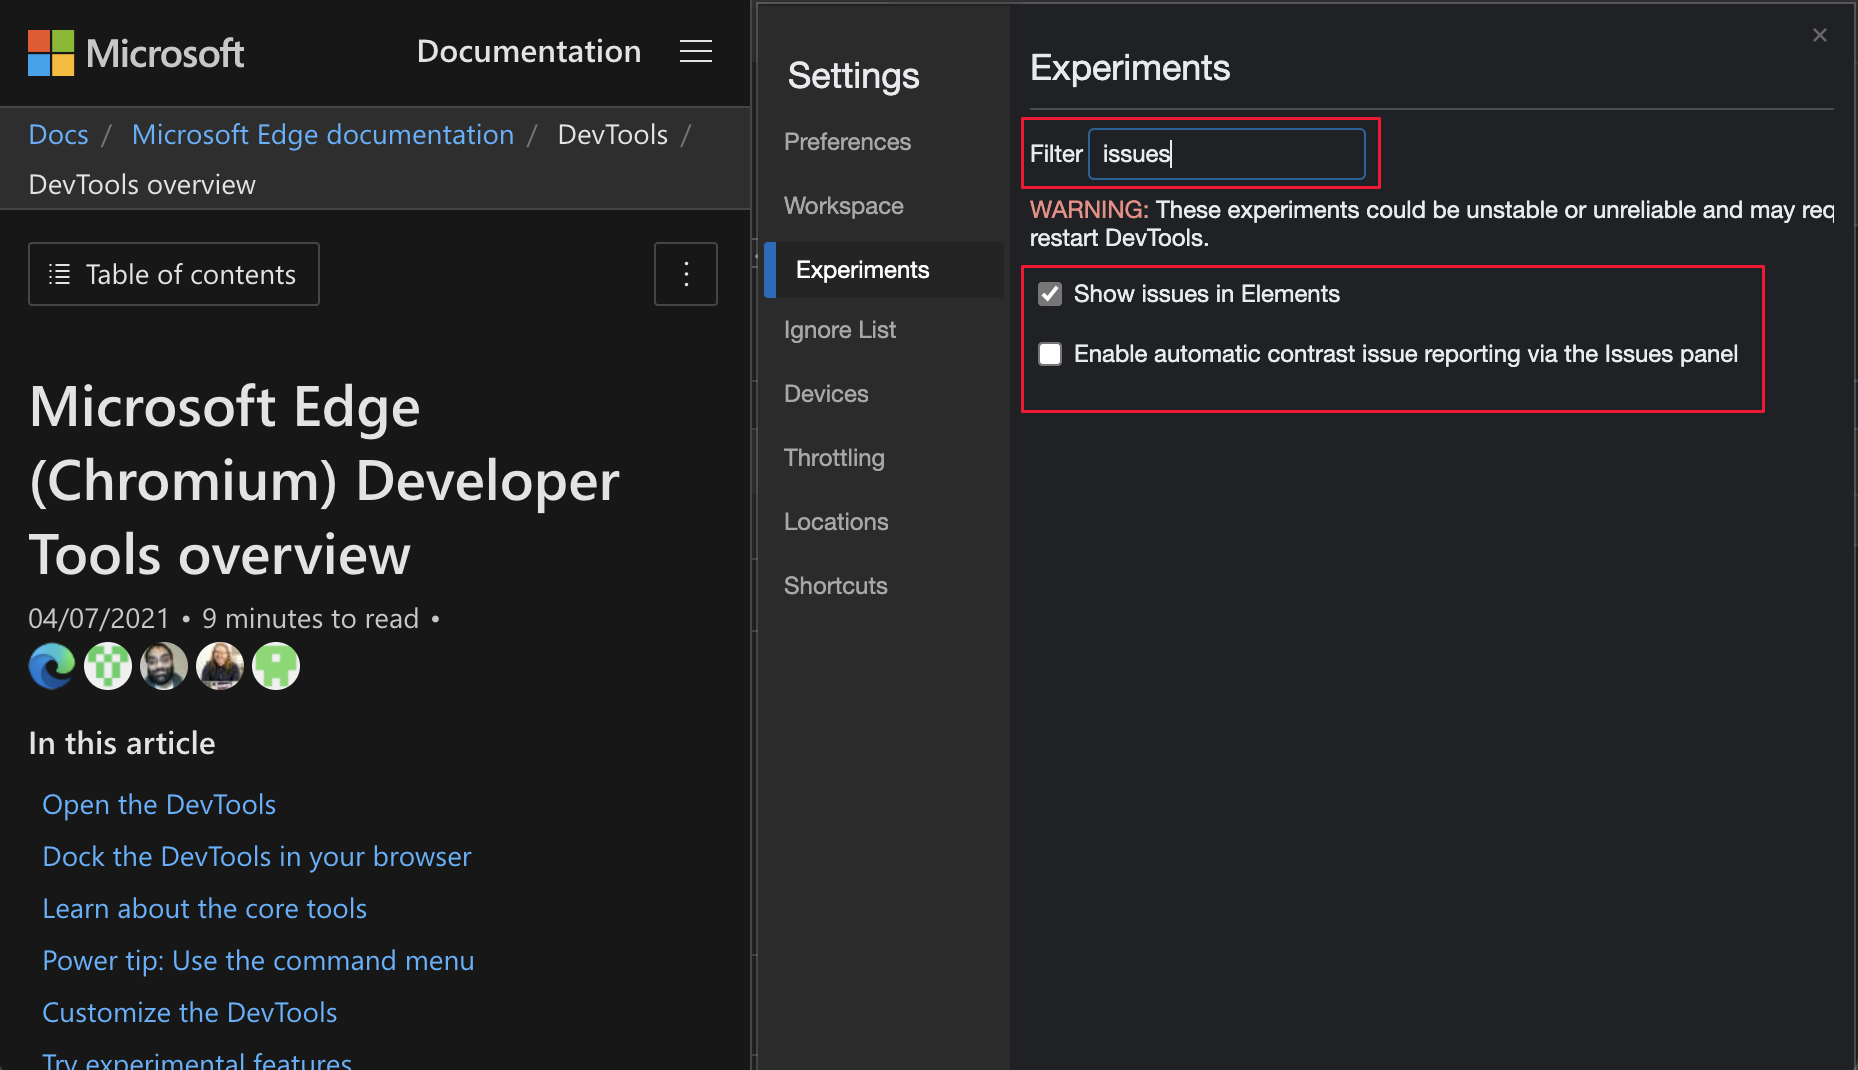
Filter experiments in the Experiments setting
Find experiments quicker with the new experiment filter. For example, to turn on new experiments for code issues:
In DevTools, select Settings (
 ) > Experiments.
In the Filter text box, start typing issues:
See also:
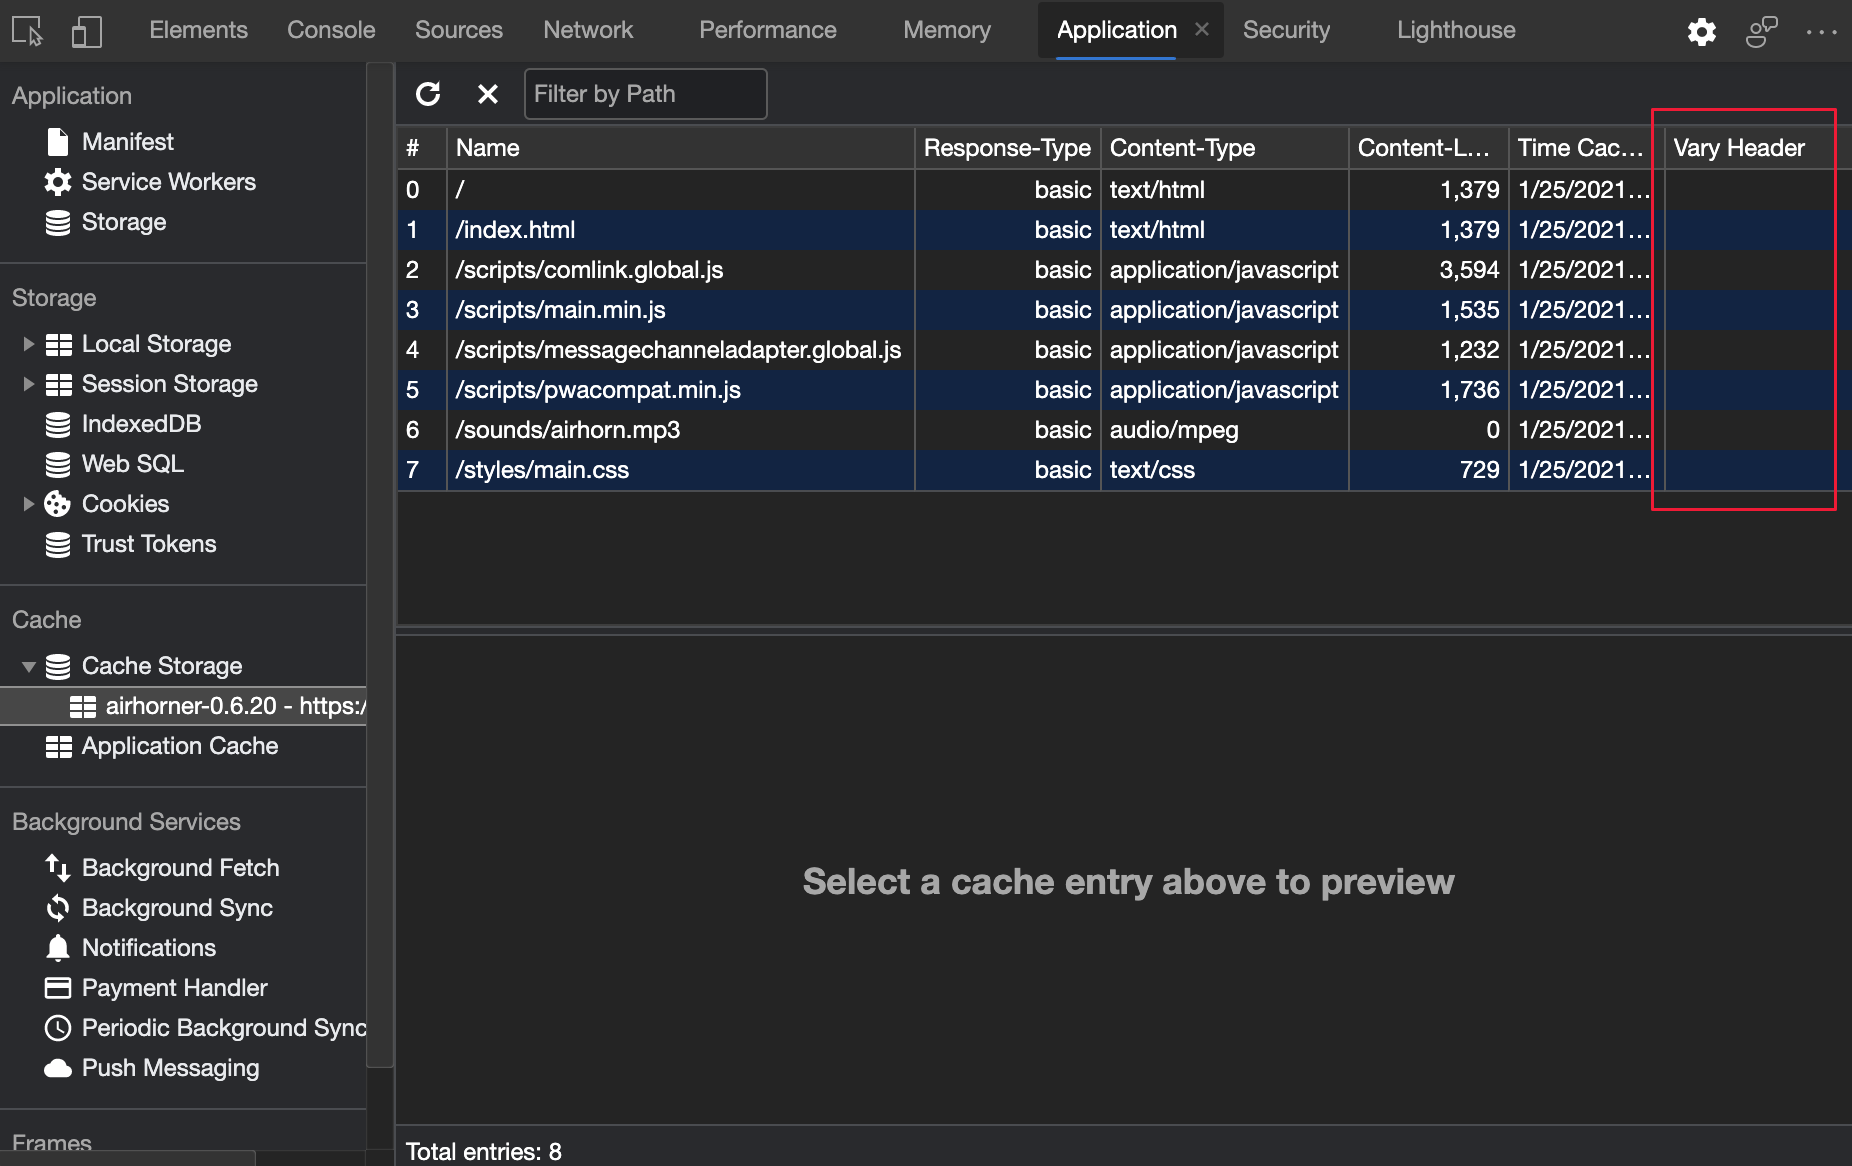
New Vary Header column in the Cache storage pane
In the Application tool's Cache Storage pane, use the new Vary Header column to display the Vary HTTP response header values:
For the history of this feature in the Chromium open-source project, see Issue 1186049.
See also:
- Vary in Hypertext Transfer Protocol (HTTP/1.1): Semantics and Content.
- View Cache data
Sources tool improvements
Support for new JavaScript features
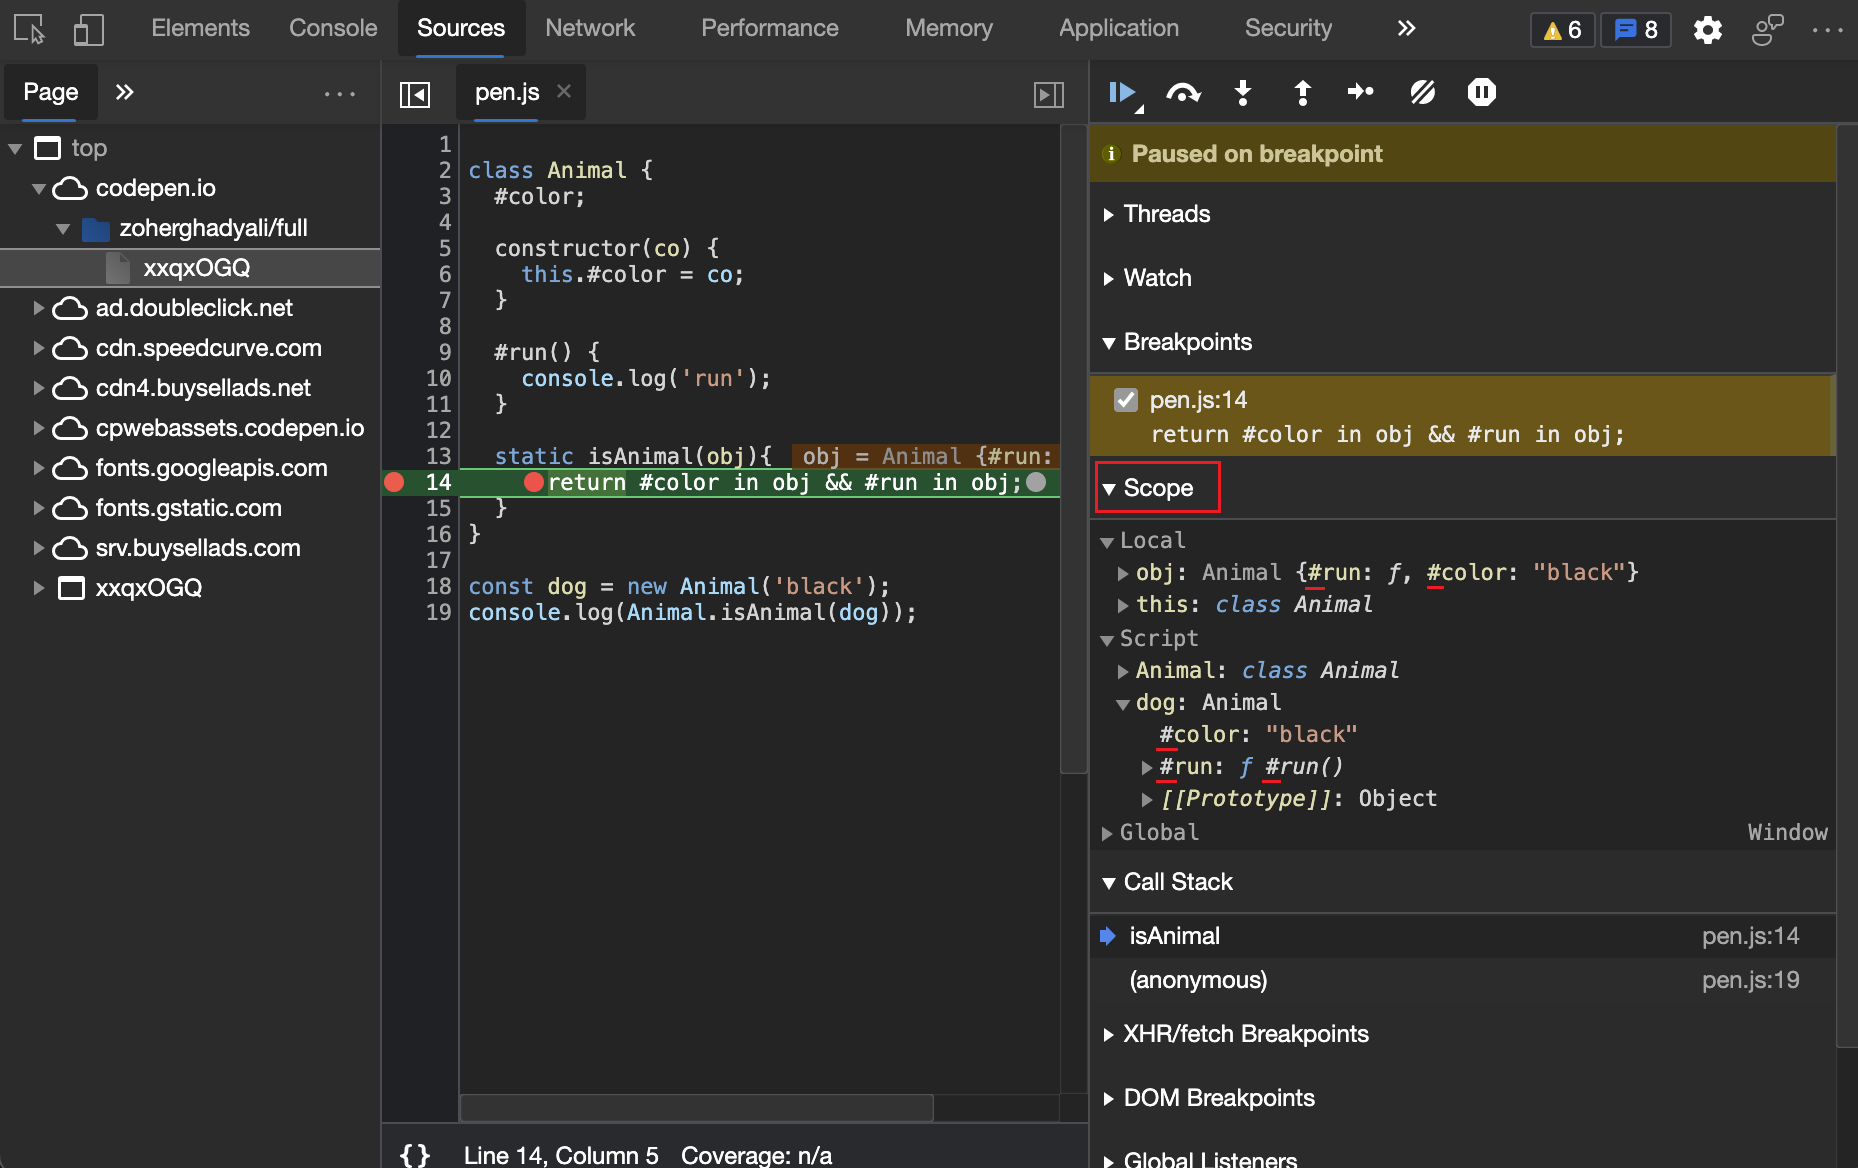
DevTools now supports the new Private brand checks a.k.a. #foo in obj JavaScript language feature. The private brand checks feature extends the in operator to support private (#) class fields on a specific object. Try it in the Console and Sources tools.
To inspect the private fields:
- In the Sources tool, go to the debugger pane.
- Expand the Scope section:
See also:
- Private brand checks a.k.a.
#foo in objat v8.dev. - in operator at MDN.
- Private class fields at v8.dev.
For the history of this feature in the Chromium open-source project, see Issue 11374.
Enhanced support for breakpoints debugging
In Microsoft Edge version 90 or earlier, DevTools only set breakpoints in a single bundle. In Microsoft Edge version 91 or later, when you debug a shared component, DevTools properly sets breakpoints in multiple bundles.
Modern JavaScript bundlers like Webpack, and Rollup support splitting code into bundles. See Code splitting.
For the history of this feature in the Chromium open-source project, see Issues 1142705, 979000, and 1180794.
See also:
Support hover preview with bracket notation
The Sources tool now supports hover preview on JavaScript member expressions that use the [] notation:
![Support hover preview with [] notation](devtools-images/sources-page-pen.js-breakpoint-arr-i-a.png)
For the history of this feature in the Chromium open-source project, see Issue 1178305.
See also:
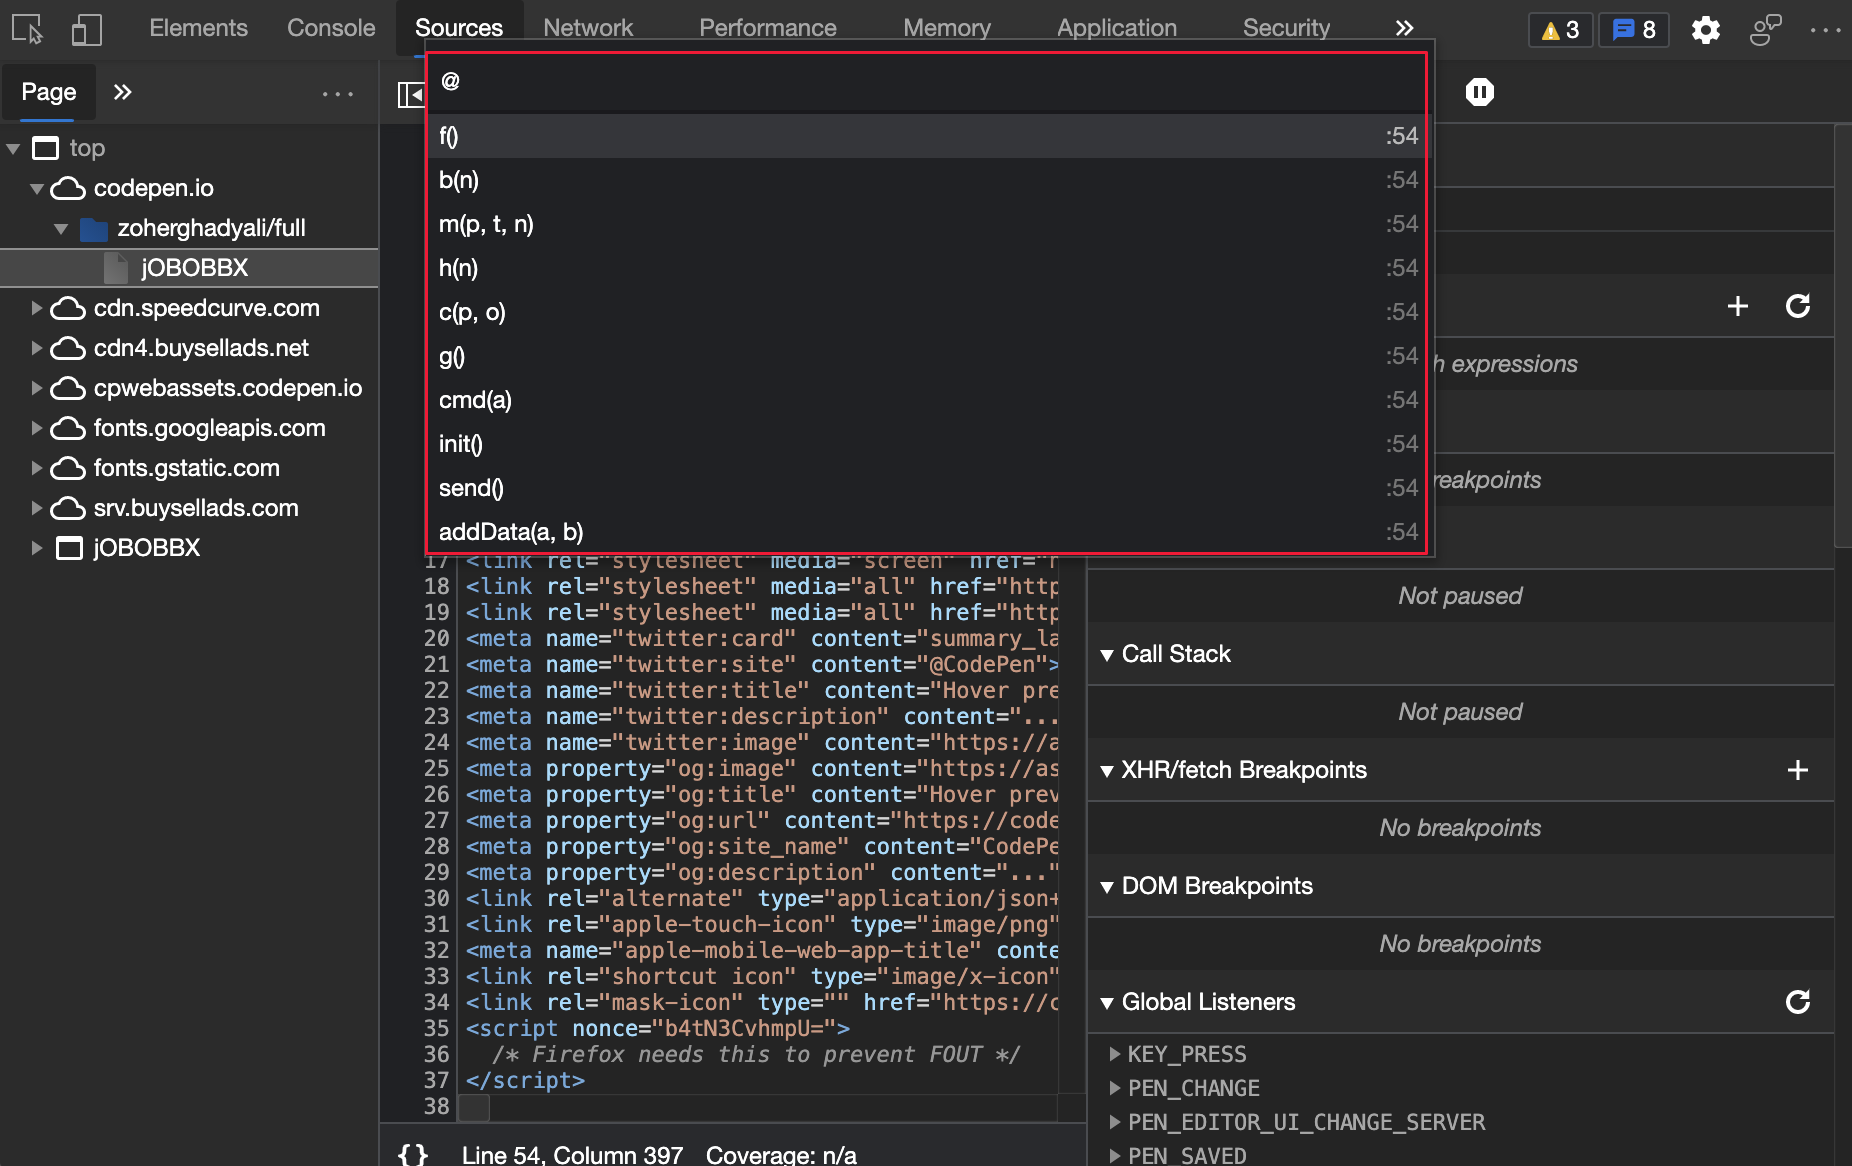
Improved outline of HTML files
DevTools now has better outline support for .html files. In the Sources tool, open the .html file. To turn on (or off) the code outline, press Ctrl+Shift+O on Windows/Linux or Command+Shift+O on macOS. Previously, DevTools only displayed some of the functions. In the following figure, DevTools now correctly list all functions in the outline:
For the history of this feature in the Chromium open-source project, see Issues 761019 and 1191465.
See also:
- Sources tool keyboard shortcuts in Keyboard shortcuts
- Using the Editor pane to view or edit files in Sources tool overview
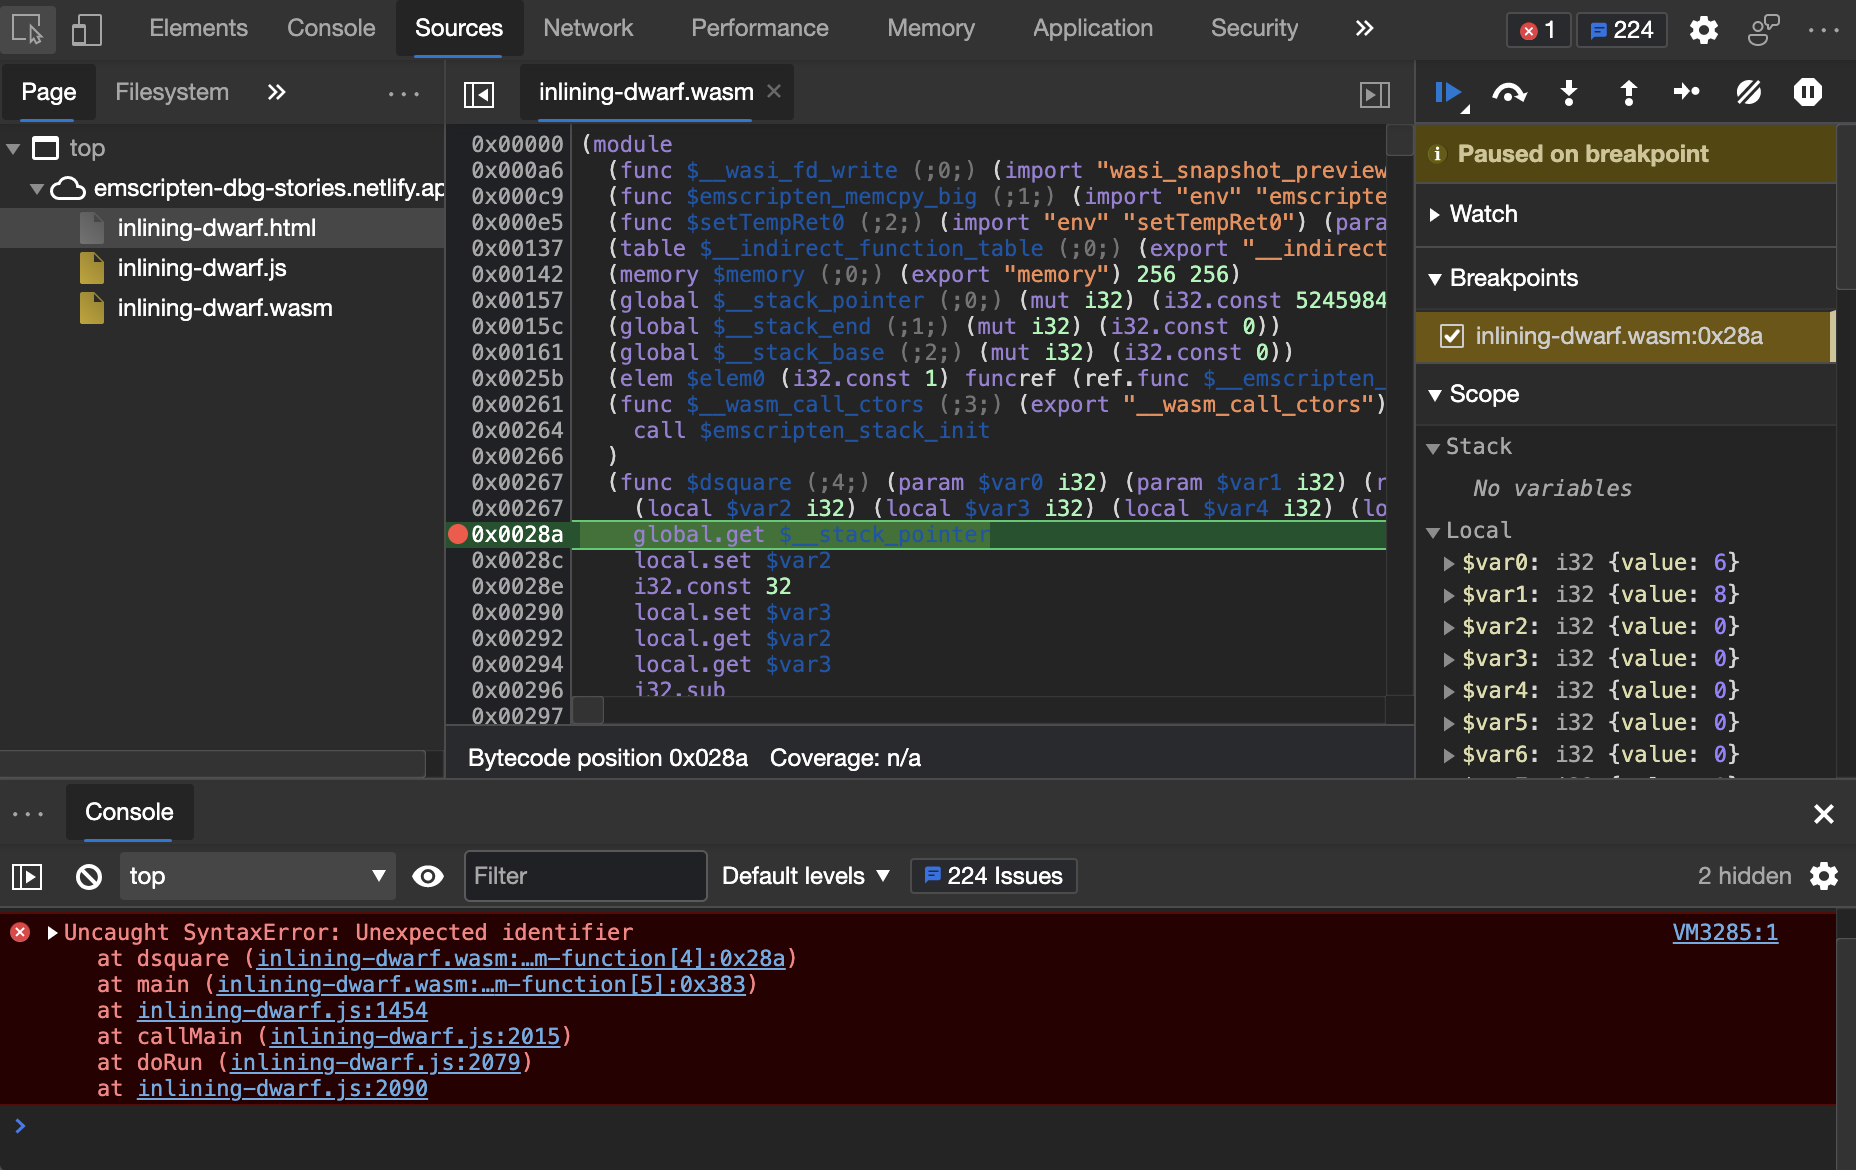
Proper error stack traces for Wasm debugging
In Microsoft Edge version 90 or earlier, DevTools only displayed generic Wasm references in Error stack traces. In Microsoft Edge version 91 or later, DevTools resolves inline function requests and displays the source location in Error stack traces for Wasm debugging. To learn more about Error stack traces in the Console, see error in Console object API Reference.
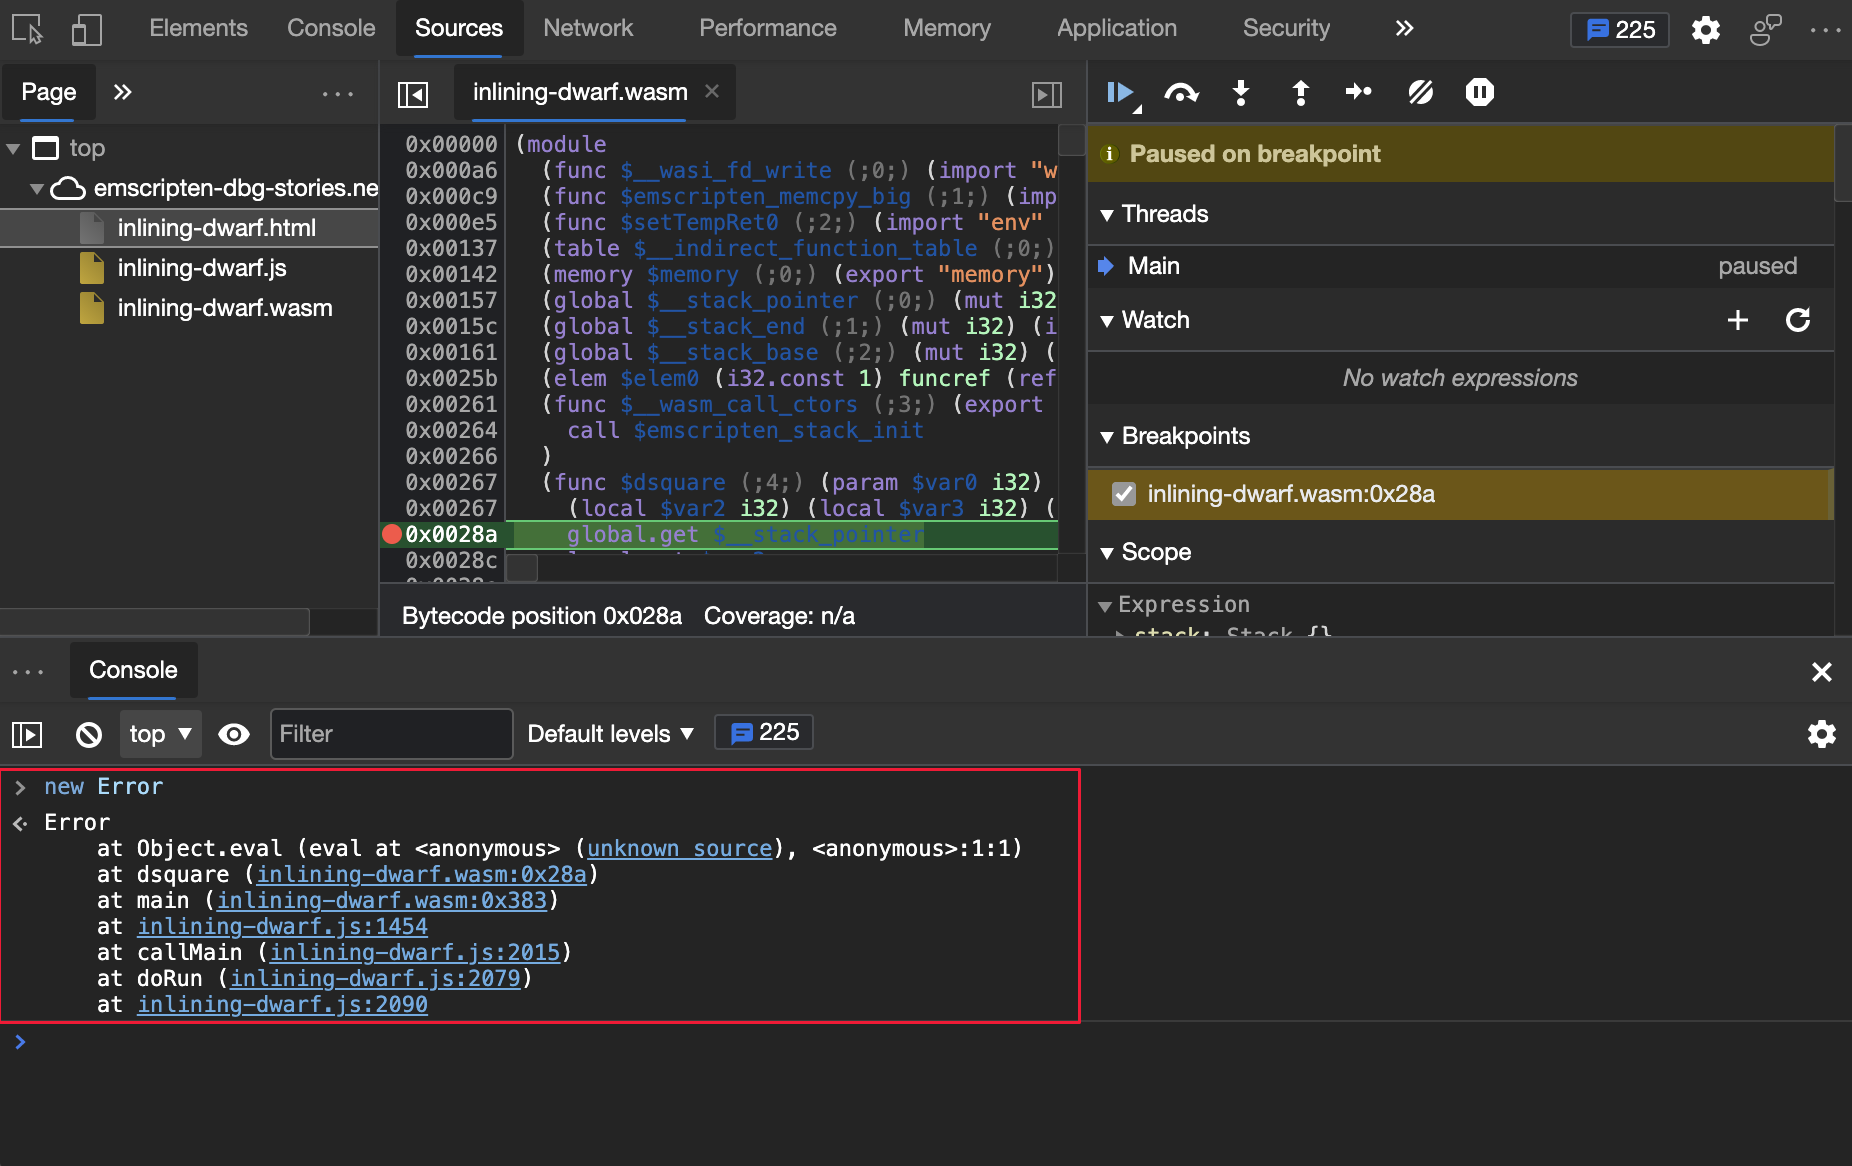
In Microsoft Edge version 91 or later, DevTools resolves inline function requests and displays proper error stack traces for Wasm debugging.
In Microsoft Edge version 90 and earlier, the source location isn't displayed in the Error stack traces. Source locations include dsquare. Previous error stack traces for Wasm debugging:
In Microsoft Edge version 91 and later, the source location is displayed in the Error stack traces. Proper error stack traces for Wasm debugging:
For the history of this feature in the Chromium open-source project, see Issue 1189161.
Note
Portions of this page are modifications based on work created and shared by Google and used according to terms described in the Creative Commons Attribution 4.0 International License. The original page is found here and is authored by Jecelyn Yeen.
![]() This work is licensed under a Creative Commons Attribution 4.0 International License.
This work is licensed under a Creative Commons Attribution 4.0 International License.