Resolving DTC Related Waits and Tuning Scalability of DTC
Author: Mike Ruthruff
Contributors: Gert Drapers, Fabricio Voznika
Reviewers: Prem Mehra, Jimmy May, Kun Cheng
During a recent performance lab we encountered a large number of waits related to the use of distributed transactions. The specific application being tested used COM+ components and made heavy use of DTC transactions managed by MSDTC. Each component was marked as either “requires a transaction” or “supports a transaction”. This resulted in all of the database calls through this layer enlisting in a DTC transaction even when SQL Server was the only Resource Manager (RM) participating in the transaction.
When the application was run at scale we noticed the following exposed by sys.dm_os_wait_stats. These three DTC related waits had very high average wait times and were at least one order of magnitude higher than the other waits on the system.
wait_type |
total_wait_time_ms |
total_waiting_tasks_count |
average_wait_ms |
DTC_STATE |
5,477,997,934 |
4,523,019 |
1,211 |
PREEMPTIVE_TRANSIMPORT |
2,852,073,282 |
3,672,147 |
776 |
PREEMPTIVE_DTC_ENLIST |
2,718,413,458 |
3,670,307 |
740 |
Each of the waits above is related to management of distributed transactions within the SQL Server engine. PREEMPTIVE_TRANSIMPORT & PREEMPTIVE_DTC_ENLIST are expected, and since these are PREEMPTIVE_ the wait time reflects the time inside the call and is recorded for each call. So the average time to import a transaction is 776ms and to enlist in to the transaction is 740ms. The code path that tracks both of these also tracks the DTC_STATE waits. So any waits within them will have an implicit wait on DTC_STATE.
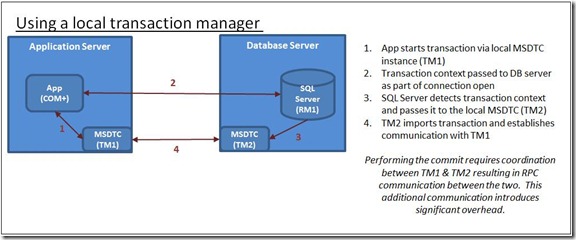
By default, the application servers used the local MSDTC coordinator to manage the transactions. This requires RPC communication between the SQL Server and the remote coordinator which can introduce significant overhead under high transactional load. The diagram below illustrates the initial configuration before changing to utilize a remote coordinator.
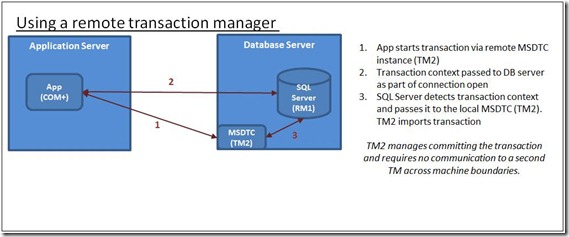
To resolve these waits we made the following configuration changes. Instead of relying on the local MSDTC coordinator the application servers were configured to utilize a remote coordinator which resides on the database server. This removes the need for RPC communication between the database server and application server to manage the DTC transactions and is the primary reason this resulted in such an improvement. A secondary benefit of this configuration change was that it resulted in using MSDTC which is part of Windows 2008. MSDTC in Windows 2008 has significant improvements over Windows 2003. The database server was running SQL Server 2008 SP1 on Windows 2008 R2.
The following diagram illustrates the configuration after making the change to use a remote a coordinator.
After making this change the DTC related waits became a non-issue and did not show up in the top 10 list of wait types. Keep in mind that even if scaling issues are not encounted in benchmark testing we have measured the overhead of DTC in previous benchmarks and found that 45% performance hit for starting a distributed transaction.
Some of the considerations and tuning options for applications that utilize DTC are the following:
- Only use DTC transactions when they are needed, meaning only when there is more than one resource manager involved. Every SQL Server instance will be considered a separate resource manager.
- Configure the application servers to utilize a remote DTC coordinator residing on the SQL Server instead of using the local MSDTC coordinator. In our case this provides significant benefit.
- Use System.Transactions within .Net to manage the transactions. System.Transactions has the intelligence to only promote transactions to distributed transactions when it detects that there are two or more Resource Manager participating in the transaction. If there is only a single RM it will not use MSDTC. See the following link for more information. https://msdn.microsoft.com/en-us/library/ms973865.aspx#introsystemtransact_topic5
- In this specific case there could have been benefit provided by using SQL Server Service Broker (SSB) ins place of MSMQ. Because SSB lives within the same instance of SQL Server there would never be a need to use DTC coordination since there would only ever be one RM.
Configuring DTC to use a remote coordinator
Here are the steps to setup a remote DTC instance.
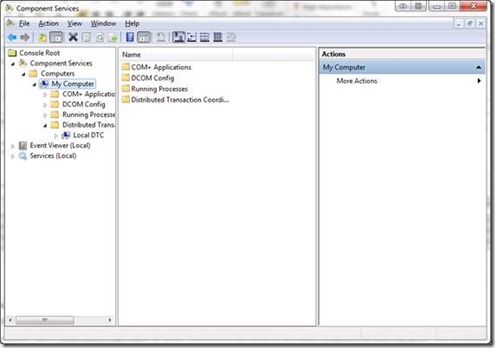
Start the Component Services add-in using Run comexp.msc
Right click on the My Computer node underneath Component Services->Computer
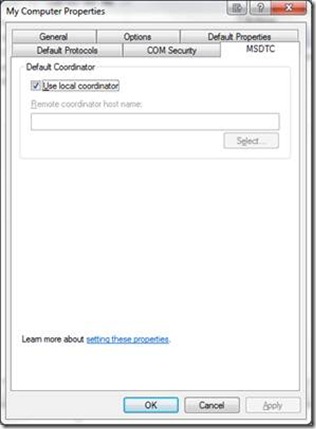
Choose Properties->MS DTC tab
Change the default from use local coordinator to a remote one. This way you can have the middle tier server and the database server use a single one by pointing them at the same MSDTC instance. This change might increase the number of concurrent transaction inside MSDTC which will likely require you to extend the log size from the default size.
The basic MS-DTC log sizing rules are:
1. Rules:
· Log Record ~144 bytes (depends on number of RM’s involved in transaction)
· MS-DTC uses a circular transaction log and @ 80% full, it starts to throttle
· Default Log Size is 4MB
· DTC will start rejecting new transactions when the current log space used is larger than the (Total Log Size) / 8
2. Determine if this log size will support the number of concurrent transactions expected on the system. For example:
· 4MB / 144 bytes = 30,000 transactions
· 30,000 / 8 = ~ 3,640 concurrent transactions
Increased Contention on LOCK_HASH Spinlock When Using Distributed Transactions
In addition to the above we also observed another performance related impact as a result of the heavy use of DTC. Monitoring sys.dm_os_spinlock_stats we noticed a high number of spins and collisions on the LOCK_HASH spinlock.
By using Extended Events in SQL Server 2008 we were able to determine the increased contention was related to heavy use of DTC. This further reinforced the strategy of reducing the use of distributed transactions to only when they are needed (i.e. when there really is more than one Resource Manager involved). The waits on LOCK_HASH were higher than any others by 3 orders of magnitude.
lock_name |
total_spins |
total_collisions |
spins_collisions_average |
LOCK_HASH |
6,804,856,030,541 |
97,191,819 |
70,014 |
BUF_FREE_LIST |
8,645,825,749 |
608,557 |
14,207 |
LOGCACHE_ACCESS |
136,048,559 |
936,664 |
145 |
SOS_OBJECT_STORE |
92,629,629 |
609,215 |
152 |
DBTABLE |
19,014,033 |
104,771 |
181 |
By using Extended Events (script below) and tracking the "backoff" event it is possible to capture the stack trace for the most common operation trying to obtain the spinlock. Capturing stack traces for these provide the ability to tell what type of operation is contributing to the contention for any particular lock. We found the root cause of the contention was caused by the fact that the shared database lock taken by the session must be transferred any time an enlistment into a DTC transaction takes place. This type of lock requires the spinlock to be held which it is transitioned to the transaction workspace.
The impact of this problem is that it may increase CPU consumption under high concurrency. Reducing use of DTC will implicitly reduce this contention.
Here is the technique used to determine the cause for the spinlock contention:
Step 1 – Obtain debug symbols for sqlservr.exe and place those in the same directory as sqlservr.exe.
In order to see the call stacks for the backoff events you will need to have symbols for the particular version of SQL Server that you are running. There are public symbols available for this provided through the Microsoft Symbol Server. Complete instructions on how to download symbols can be found in this article.
Step 2 – Use Extended Events to trace the backoff events for the LOCK_HASH spinlock
The following Extended Events script will trace backoff events for the LOCK_HASH spinlock and using a bucketizer target will group identical stacks into buckets with an associated count. The buckets with the highest counts are the threads with the highest amount of contention on the spinlock.
Here is the script:
/*
How to trace spinlock backoffs
**************************************/
--Find the LOCK_HASH type
--The type values change from build to build so it is necessary
--to do each time a version change to SQL has been made.
select * from sys.dm_xe_map_values where map_value like '%lock%'
--create the even session that will capture the callstacks to a bucketizer
create event session lock_hash_spin on server
add event sqlos.spinlock_backoff (action (package0.callstack)
where type=59) --59 = LOCK_HASH
add target package0.asynchronous_bucketizer (
set filtering_event_name='sqlos.spinlock_backoff',
source_type=1, source='package0.callstack')
with (MAX_MEMORY=256MB, MEMORY_PARTITION_MODE = PER_CPU)
--start the event session and wait for some time to track the back off events
alter event session lock_hash_spin on server state=start
waitfor delay '00:01:00'
--Trace flag 3656 enables the call stacks to be resolved. This requires that the
--sqlservr.pdb file reside in the same directory as sqlservr.exe
DBCC traceon (3656, -1)
--To view the data run :
select event_session_address, target_name, execution_count, CAST(target_data as XML)
from sys.dm_xe_session_targets
--stop the event tracing session and drop the event session
alter event session lock_hash_spin on server state=stop
drop event session lock_hash_spin on server
After running the above script and tracing the backoff events we can see the most common callstack(s) encountered. In our case the following was the call stack with the highest count. As you can see this is related to enlistments into DTC transactions.
Associated callstack for the spinlock backoff event:
GenericEvent::CallNextAction+45
XeSosPkg::spinlock_backoff::Publish+68
SpinlockBase::Sleep+a616b4 [ @ 0+0x0
SpinlockBase::Backoff+60
Spinlock<59,7,1>::SpinToAcquireWithExponentialBackoff+127
lck_lockInternal+c07
XactWorkspaceImp::TransferDBLock+25a
CDbLockList::UpdateXactWorkspace+4a
SEParams::UpdateXactWorkspace+7b
CMsqlXactManager::FChangeXactWorkspace+ee
CMsqlXactManager::DefectXactWorkspace+33
CMsqlXactImp::EnlistDTCXact+a5
CResMgrTopExecLevel::Execute+441
process_request+370
SOS_Task::Param::Execute+11b
Special thanks to Gert Drapers (former SQLCAT team member) and Fabricio Voznika of the SQLOS development team for their guidance on the techniques in optimizing and isolating the DTC related performance problems described above.
Anonymous
June 01, 2010
Good article, thanks Mike, can be very helpful. I was wondering: was a 'plain' DTC wait event also part of the top DTC waits?Anonymous
June 05, 2010
Mike, thanks for the interesting article! I was wondering if there were other DTC waits involved as well..especially the plain 'DTC' type wait..Anonymous
July 20, 2011
Hi Mike, If I SELECT map_key, map_value, * FROM sys.dm_xe_map_values WHERE name = 'spinlock_types' I got map_key=61 for map_value lock_hash. I ran it on sql 2008 r2. Does it change on sql 2008r2?


