Ways to see the content of Sealed Management Pack
Sometimes, when authoring management packs, we want to see, learn and even reuse, sealed management packs elements (workflows, modules, scripts and so forth). The operational console does not allow us to see it even when we look at the configuration tab in monitor or rule properties. So, how can MP author may benefit from sealed MP content? ... Ooh, nice of you to ask ;-)
Well, there are several tools for that. In this post we will talk about MP Viewer and Visual Studio with the Authoring Extensions (which is published for some time already…). In fact, Visual Studio is a lot more than only seeing MP content…but, this is a different post ;-)
We can use MP viewer to:
- Load MP and see its inventory like Monitors/Rules/Tasks etc.
- View Content of MP Bundle (MPB) files as described by colleague Stefan Stranger here Viewing contents Management Pack Bundle files with MPViewer
- Unseal MP to see its content in XML (for the developers among us..)
We can use Visual Studio Authoring Extensions to:
- Load and Browse Management Pack and see ALL its elements structured into Service Model, Health Model, Module Types etc.
- See the properties of the MP
Now, let's play:
The MP Viewer
1. Open MP Viewer and load management pack

2. Once the MP is loaded, we can navigate through MP elements on the left side. Here's an example for Unit Monitor 'CPU Percentage Utilization'. In the windows below, we will see the configuration of the Monitor like health states, threshold etc. but, we won't be able to see how it is made, which monitor type, datasource, probe action, unless... (jump to 3)

3. Unsealing MP - when unsealing MP, we can look into the unsealed xml file and find pieces of code we can reuse or just to learn how things done. This requires basic knowledge of xml structure and strong knowledge of SCOM MP schema.

The Visual Studio Authoring Extensions
1. Open New 'Management Pack' Project

2. Solution Explorer shows the default referenced MPs when project is created. We can add more obviously. To see MP structure and content, we will use the 'Management Pack Browser'.
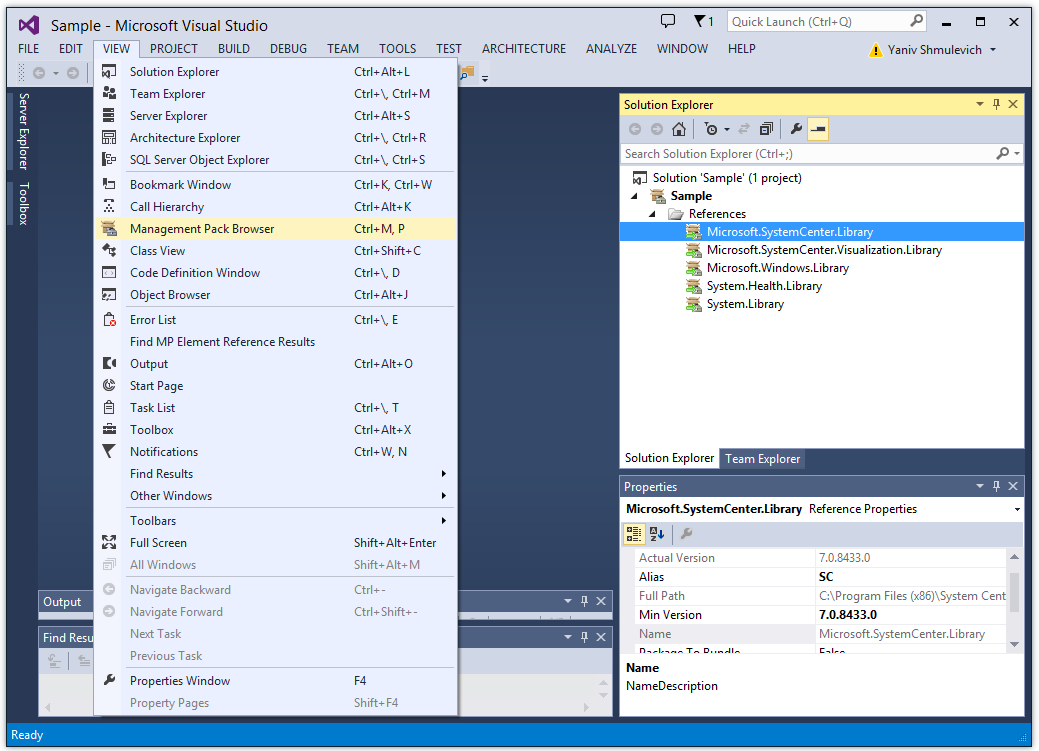
3. Let's say we want to see the content of 'Microsoft.SQLServer.2012.Monitoring'. We will add it to 'References' under project. When done, we will navigate a bit through MP Browser. As you can see, now it is possible to see the whole picture of a MP. In picture below, we navigate to 'Monitor Types' which gives us a full list of them. Hitting specific Monitor Type, and we can see for instance, what Datasource it is using/based and its parameters. Another nice thing is the fact we see the MP properties like version, alias name... sometimes, these are very important to know.

Further more, Probe Action script details...

Ok now ! We all got the idea and there many more to see.
Glad To Share The Goodie (GTSTG)
- Anonymous
March 18, 2015
Great post, helps a lot. simple and clear.