Ask Learn
PreviewPlease sign in to use this experience.
Sign inThis browser is no longer supported.
Upgrade to Microsoft Edge to take advantage of the latest features, security updates, and technical support.
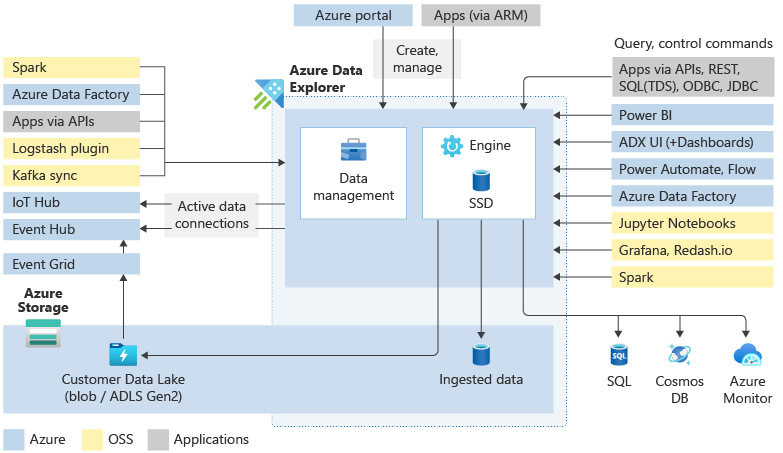
In this unit, we look at how Azure Data Explorer works behind the scenes by discussing the major components of the system. Then, you learn about how to interact with the service by exploring a common workflow:
This knowledge helps you decide if Azure Data Explorer is a good fit for your data needs.

An Azure Data Explorer cluster does all the work to ingest, process, and query your data. The clusters are autoscalable according to your needs. Azure Data Explorer also stores the data on Azure Storage and caches some of this data on the cluster compute nodes to achieve optimal query performance.
Each Azure Data Explorer cluster can hold up to 10,000 databases and each database up to 10,000 tables. The data in each table is stored in data shards also called extents. All data is automatically indexed and partitioned based on the ingestion time. Unlike a relational database, there are no primary foreign key constraints or any other constraints, such as uniqueness. This design means you can store large amounts of varied data. And because of the way it's stored, you get fast access to querying it.
The logical structure of a database is similar to many other relational databases. An Azure Data Explorer database can contain:
Generally speaking, when you interact with Azure Data Explorer, you go through the following workflow: First you ingest your data to get it in the system. Then, you analyze your data. Next, you visualize the results of your analysis. At any time, you may also engage with the data management features. This work with Azure Data Explorer is done through interaction with the cluster. You can access these resources either in the Web UI or by using SDKs.
Data ingestion is the process used to load data records from one or more sources into a table in Azure Data Explorer. Further data manipulation includes matching schema, organizing, indexing, encoding, and compressing the data. The Data Manager then commits the data ingest to the engine, where it's available for query.
In addition to the native Web UI wizard, there are various ingestion tools available. Including the managed pipelines, Event Grid, IoT Hub, and Azure Data Factory. You can use connectors and plugins such as the Logstash plugin, Kafka connector, Power Automate, and Apache Spark connector. You can also use programmatic ingestion using SDKs, or LightIngest.
Data can be ingested in two modes: Batching or Streaming. Batching ingestion is optimized for high ingestion throughput and fast query results. Streaming ingestion allows near real-time latency for small sets of data per table.
Azure Data Explorer uses the proprietary Kusto Query Language (KQL) to analyze data. It's widely used in Microsoft (Azure Monitor - Log Analytics and Application Insights, Microsoft Sentinel, and Microsoft Defender XDR). KQL is optimized for fast-flowing, diverse, big data exploration. Queries reference tables, views, functions, and any other tabular expressions. Including tables in different databases or even clusters. Queries can be run using the Web UI, various query tools, or with one of the Azure Data Explorer SDKs.
Kusto Query Language is an expressive, intuitive, and highly productive query language. It offers a smooth transition from simple one-liners to complex data processing scripts, and supports querying structured, semi-structured, and unstructured (text search) data. There's a wide variety of query language operators and functions (aggregation, filtering, time series functions, geospatial functions, joins, unions, and more) in the language. KQL supports cross-cluster and cross-database queries, and is feature rich from a parsing (json, XML etc.) perspective. In addition, the language natively supports advanced analytics.
The Azure Data Explorer Web UI was designed with big data in mind, enabling you to run queries and build dashboards. It supports a display of up to 500-K records and thousands of columns. It's highly scalable and rich with functionality that helps you draw quick insights from your data. You can also use different visual displays of your data in your Azure Data Explorer Dashboards. You can also display your results using native connectors to some of the leading visualization services available today, such as Power BI and Grafana. Azure Data Explorer also has ODBC and JDBC connector support to tools such as Tableau and Qlik.
Admins want to perform various maintenance and policy tasks on their Azure Data Explorer clusters, and Control commands give them the ability to do so. Using Control commands, they can create new clusters or databases, establish data connections, perform auto scaling, and adjust cluster configurations. They can also control and modify entities, metadata objects, managing permissions, and security policies. In addition, they can modify materialized views (continually updated filtered views of other tables), functions (stored functions and user-defined functions), and the update policy (functions that are triggered following ingestion).
Control commands are run directly on the engine using the WebUI, the Azure portal, various query tools, or one of the Azure Data Explorer SDKs.
Please sign in to use this experience.
Sign in