Note
Access to this page requires authorization. You can try signing in or changing directories.
Access to this page requires authorization. You can try changing directories.
You can debug ASP.NET and ASP.NET Core apps in Visual Studio. The process differs between ASP.NET and ASP.NET Core, and whether you run it on IIS Express or a local IIS server.
Note
The following steps and settings apply only to debugging apps on a local server. Debugging apps on a remote IIS server uses Attach to Process, and ignores these settings. For more information and instructions for remote debugging ASP.NET and ASP.NET Core, see Remote debug ASP.NET Core on a remote IIS computer, and Remote debug Azure App Service.
The built-in Kestrel and IIS Express servers are included with Visual Studio. Kestrel is the default debug server for ASP.NET Core projects, and is preconfigured. IIS Express is the default debug server for ASP.NET.
Prerequisites for local IIS server
You can also debug an ASP.NET or ASP.NET Core app on a local IIS server (version 8.0 or higher) that is configured to run the app. To debug on local IIS, you must meet the following requirements:
If it's not installed, install the ASP.NET and web development workload. (Rerun the Visual Studio Installer, select Modify, and add this workload.)
Run Visual Studio as an administrator.
Install and correctly configure IIS with the appropriate version(s) of ASP.NET and/or ASP.NET Core. For more information on using IIS with ASP.NET Core, see Host ASP.NET Core on Windows with IIS. For ASP.NET, see Install IIS and ASP.NET Modules.
Make sure the app runs on IIS and opens in the browser.
Debug ASP.NET Core apps
A default profile named https or one based on the project name may be present, which are configured for the Kestrel web server. If you're debugging on local IIS instead, make sure you meet the prerequisites for local IIS debugging.
Select the ASP.NET Core project in Visual Studio Solution Explorer and click the Properties icon, or press Alt+Enter, or right-click and choose Properties.
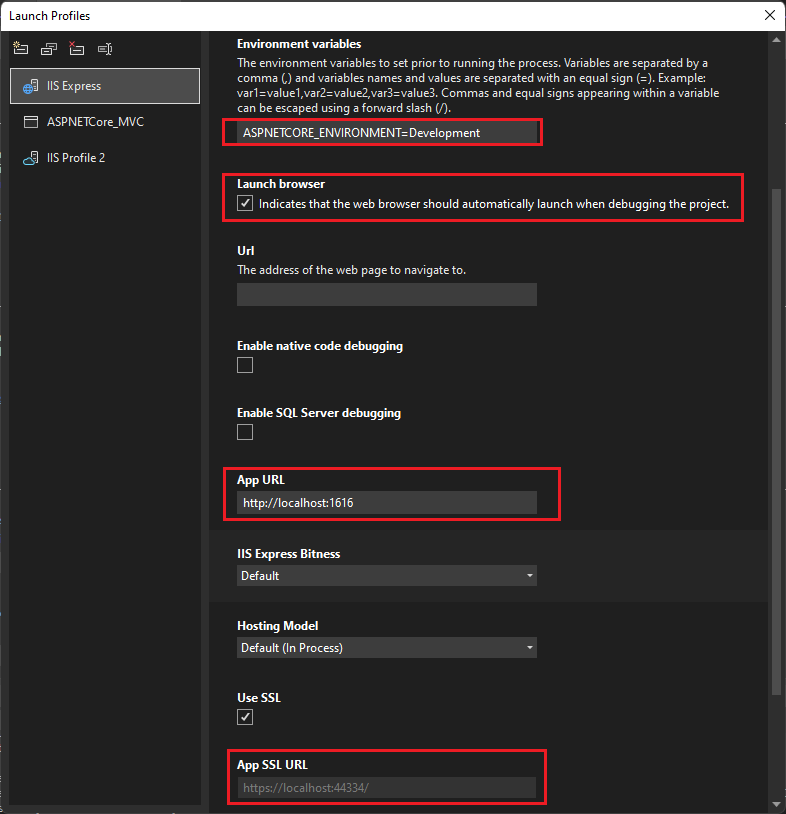
Select the Debug tab and click the link to open the Open debug launch profiles UI.
The UI presented corresponds to the settings in the project's
launchSettings.jsonfile. For more information on this file, see the Development andlaunchSettings.jsonsection in Use multiple environments in ASP.NET Core.Select the profile to configure for debugging.
- For Kestrel, select the https profile or the profile named after the project.
- For IIS Express, select IIS Express from the dropdown.
- For local IIS, select New and create a new IIS profile.
Make sure Launch browser is selected.
Make sure that Url, App URL, and App SSL URL are correct.
Url specifies the location of host URL for .NET Core or .NET 5+. For a profile named after the project (that is, the commandName property in
launchSettings.jsonis Project), the Kestrel server listens to the port specified. For an IIS profile, this is typically the same value as the App URL. For more information, see the IIS launch profile section under Configure the project.App URL and App SSL URL specify the application URL(s).
- For an https profile, the App URL property is typically
https://localhost:7241;http://localhost:5175. - For a profile named after the project, these properties are typically
http://localhost:5000andhttps://localhost:5001. - For IIS Express, the App SSL URL is typically
https://localhost:44334.
- For an https profile, the App URL property is typically
Under Environment variables, make sure that ASPNETCORE_ENVIRONMENT is present with a value of Development. If not, add the variable.

For more information about environment variables, see Environments.
To debug the app, in your project, set breakpoints on some code. In the Visual Studio toolbar, make sure the configuration is set to Debug.
To start debugging, select the profile name in the toolbar, such as https, IIS Express, or <IIS profile name> in the toolbar, select Start Debugging from the Debug menu, or press F5. The debugger pauses at the breakpoints. If the debugger can't hit the breakpoints, see Troubleshoot debugging.
Debug ASP.NET apps
IIS Express is the default, and is preconfigured. If you're debugging on Local IIS, make sure you meet the requirements for local IIS debugging.
Select the ASP.NET project in Visual Studio Solution Explorer and click the Properties icon, or press Alt+Enter, or right-click and choose Properties.
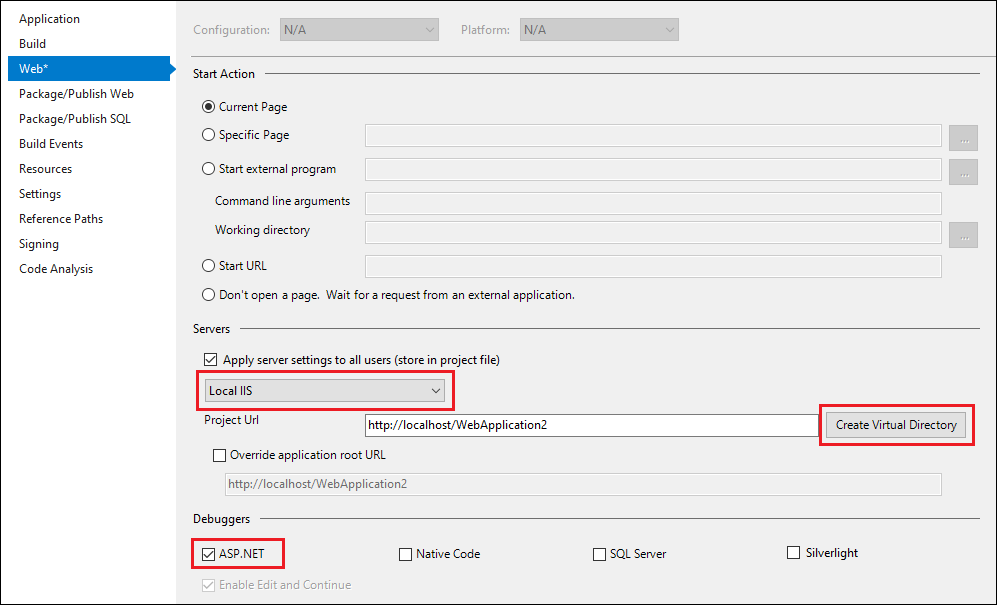
Select the Web tab.
If you don't see the Web tab, see Debug ASP.NET Core apps. The Web tab only appears for ASP.NET Framework.
In the Properties pane, under Servers,
- For Kestrel, select https from the dropdown.
- For IIS Express, select IIS Express from the dropdown.
- For local IIS,
- Select Local IIS from the dropdown.
- Next to the Project URL field, select Create Virtual Directory, if you haven't yet set up the app in IIS.
Under Debuggers, select ASP.NET.

Choose File > Save Selected Items (or press Ctrl+S) to save any changes.
To debug the app, in your project, set breakpoints on some code. In the Visual Studio toolbar, make sure the configuration is set to Debug, and the browser you want appears in IIS Express (<Browser name>) or Local IIS (<Browser name>) in the emulator field.
To start debugging, select IIS Express (<Browser name>) or Local IIS (<Browser name>) in the toolbar, select Start Debugging from the Debug menu, or press F5. The debugger pauses at the breakpoints. If the debugger can't hit the breakpoints, see Troubleshoot debugging.
Troubleshoot debugging
If local IIS debugging can't progress to the breakpoint, follow these steps to troubleshoot.
Start the web app from IIS, and make sure it runs correctly. Leave the web app running.
From Visual Studio, select Debug > Attach to Process or press Ctrl+Alt+P, and connect to the ASP.NET or ASP.NET Core process (typically w3wp.exe or dotnet.exe). For more information, see Attach to Process and How to find the name of the ASP.NET process.
If you can connect and hit the breakpoint by using Attach to Process, but not by using Debug > Start Debugging or F5, a setting is probably incorrect in the project properties. If you use a HOSTS file, make sure it's also configured correctly.
Configure debugging in the web.config file
ASP.NET projects have web.config files by default, which contain both app configuration and launch information, including debug settings. The web.config files must be configured correctly for debugging. The Properties settings in previous sections update the web.config files, but you can also configure them manually.
Note
ASP.NET Core projects do not initially have web.config files, but use appsettings.json and launchSettings.json files for app configuration and launch information. Deploying the app creates a web.config file or files in the project, but they do not typically contain debug information.
Tip
Your deployment process may update the web.config settings, so before trying to debug, make sure the web.config is configured for debugging.
To manually configure a web.config file for debugging:
In Visual Studio, open the ASP.NET project's
web.configfile.Web.configis an XML file, so contains nested sections marked by tags. Locate theconfiguration/system.web/compilationsection. (If thecompilationelement doesn't exist, create it.)Make sure that the
debugattribute in thecompilationelement is set totrue. (If thecompilationelement doesn't contain adebugattribute, add it and set it totrue.)If you are using local IIS instead of the default IIS Express server, make sure that the
targetFrameworkattribute value in thecompilationelement matches the framework on the IIS server.The
compilationelement of theweb.configfile should look like the following example:Note
This example is a partial
web.configfile. There are usually additional XML sections in theconfigurationandsystem.webelements, and thecompilationelement might also contain other attributes and elements.<configuration> ... <system.web> <compilation debug="true" targetFramework="4.6.1" ... > ... </compilation> </system.web> </configuration>
ASP.NET automatically detects any changes to web.config files and applies the new configuration settings. You don't have to restart the computer or the IIS server for changes to take effect.
A website can contain several virtual directories and subdirectories, with web.config files in each one. ASP.NET apps inherit configuration settings from web.config files at higher levels in the URL path. The hierarchical web.config file settings apply to all ASP.NET apps below them in the hierarchy. Setting a different configuration in a web.config file lower in the hierarchy overrides the settings in the higher file.
For example, if you specify debug="true" in www.microsoft.com/aaa/web.config, any app in the aaa folder or in any subfolder of aaa inherits that setting, except if one of those apps overrides the setting with its own web.config file.
Important
Debug mode greatly reduces the performance of your app. When you deploy a production app or conduct performance measurements, set debug="false" in the web.config and specify a Release build.