Events
Power BI DataViz World Championships
Feb 14, 4 PM - Mar 31, 4 PM
With 4 chances to enter, you could win a conference package and make it to the LIVE Grand Finale in Las Vegas
Learn moreThis browser is no longer supported.
Upgrade to Microsoft Edge to take advantage of the latest features, security updates, and technical support.
This article describes what is included in the Purchase spend analysis Microsoft Power BI content. It explains how to access the Power BI reports, and provides information about the data model and entities that are used to build the content.
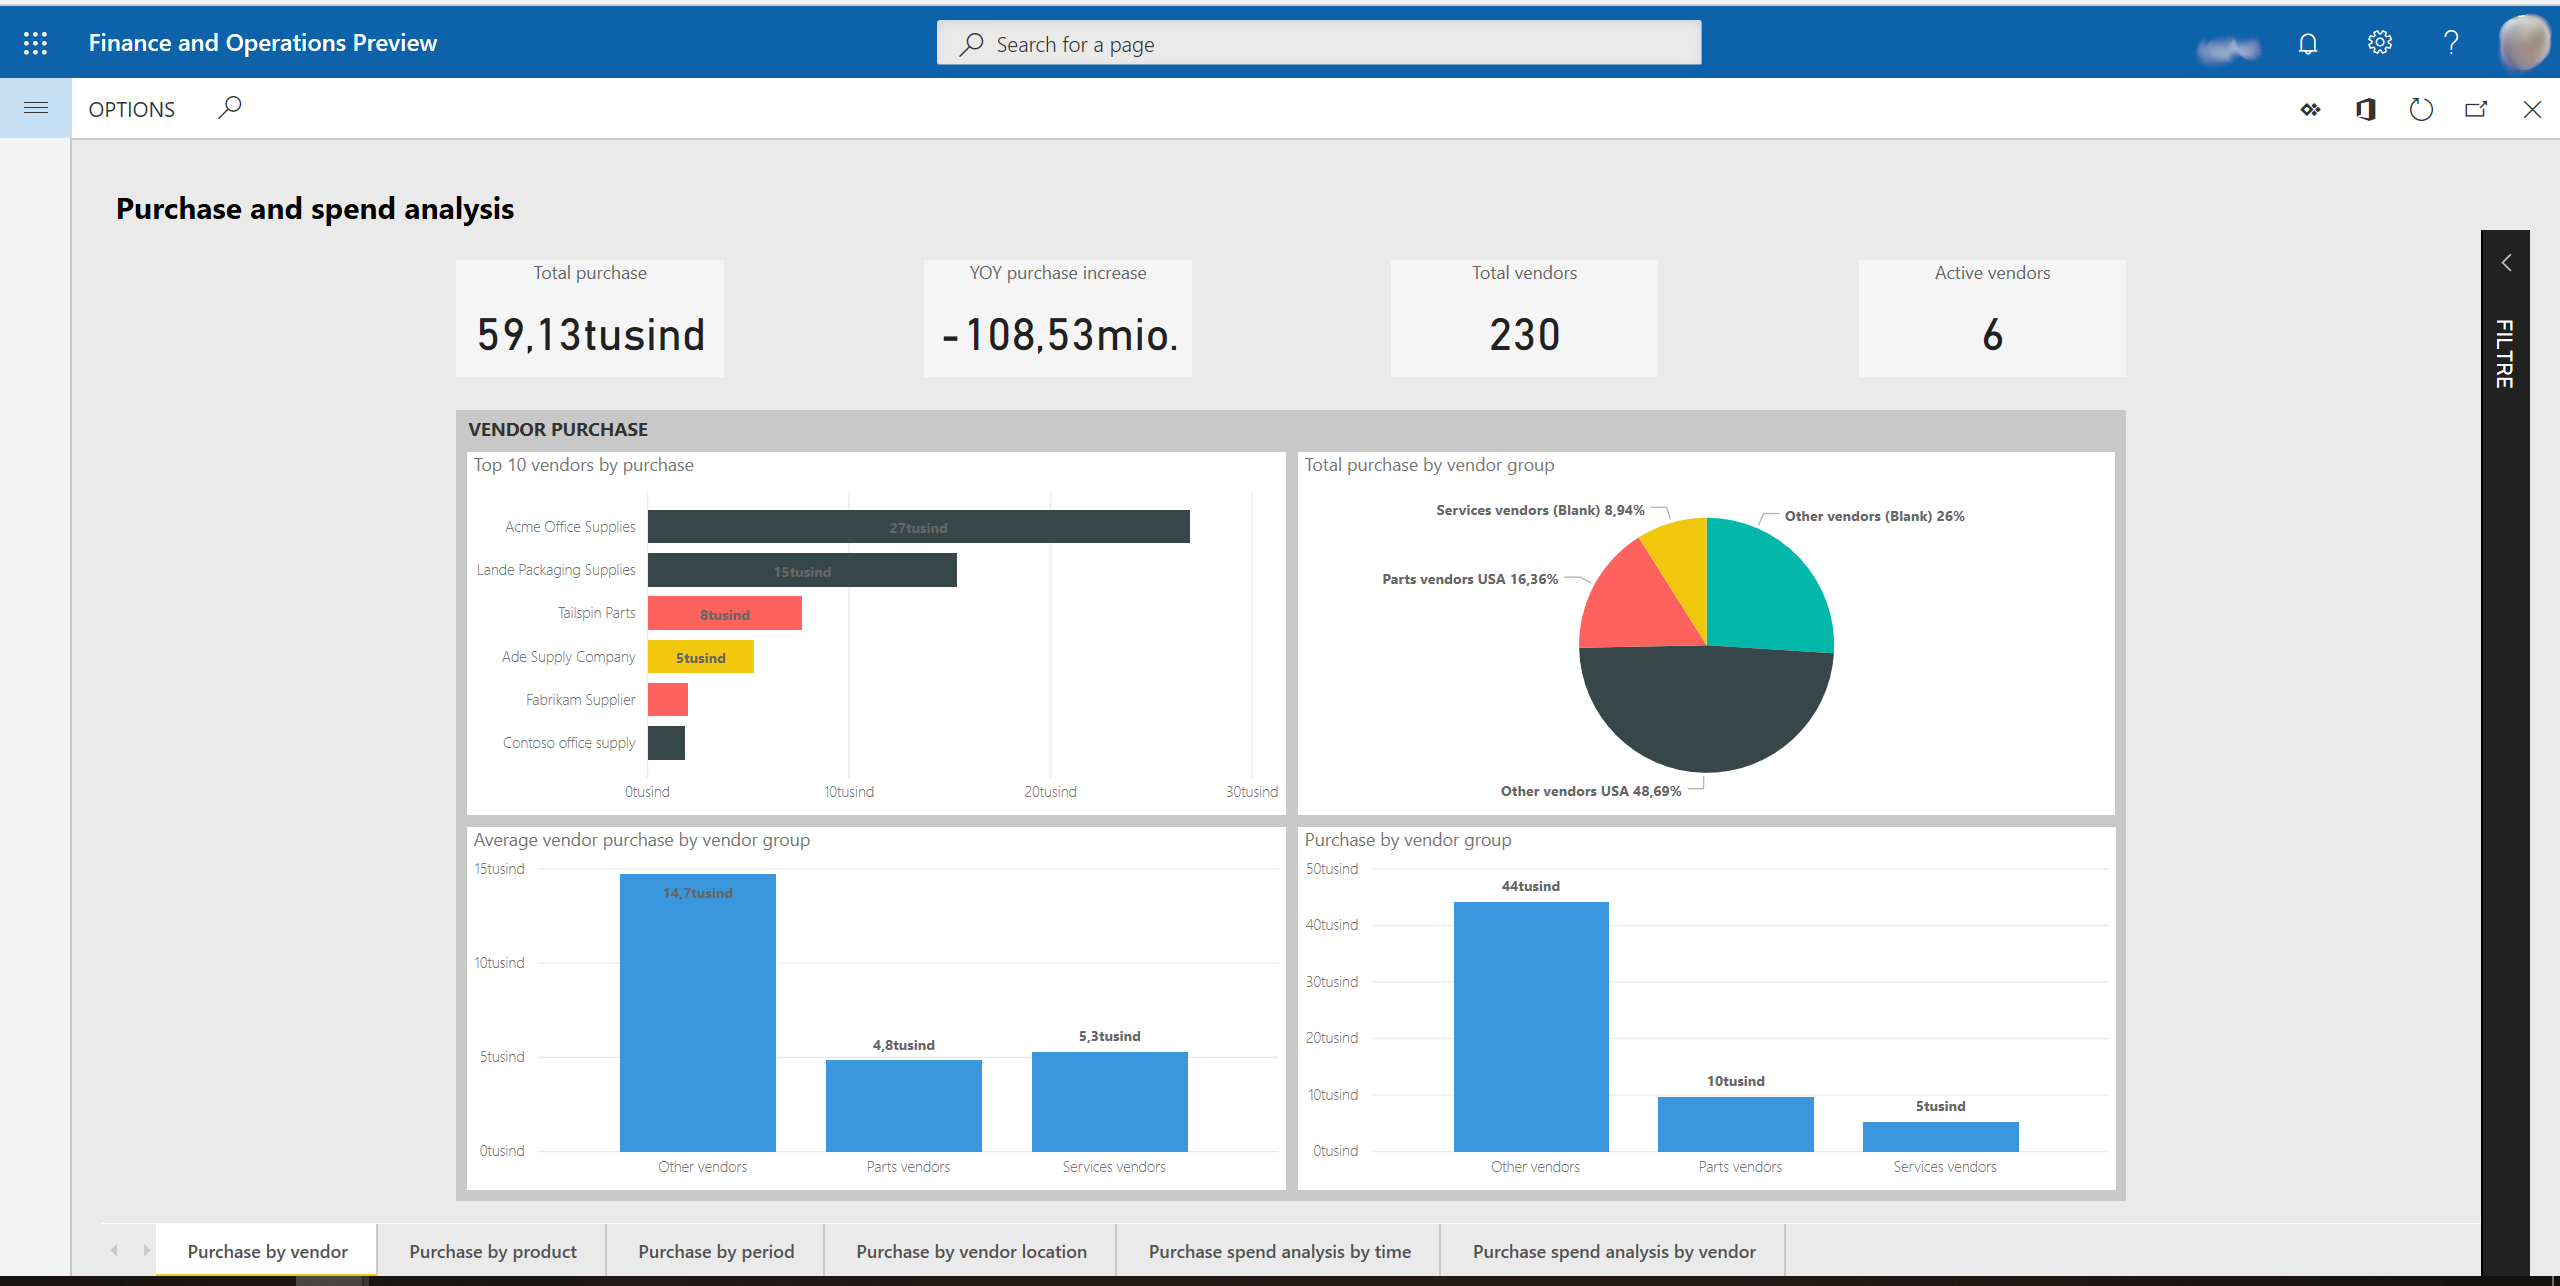
The Purchase spend analysis Power BI content was designed to help purchasing managers and managers who are responsible for budgets keep track of purchase spending. Managers can analyze purchase spending in the following ways:
The content uses purchase transactional data, and provides both an aggregate view of the company-wide purchase figures and a breakdown of purchase spending by vendor and product. Reports highlight changes in purchase spending over time. Therefore, the reports can be used to alert managers about positive and negative spending trends for individual vendors and products. Additionally, charts show purchase spending for different procurement categories and vendor groups. Therefore, category and regional managers can use the charts to help identify changes in spending behavior.
The Purchase spend analysis Power BI content is shown on the Purchase and spend analysis page (Procurement and sourcing > Inquiries and reports > Purchase performance analysis > Purchase and spend analysis).
The Purchase spend analysis Power BI content includes a report that consists of a set of metrics. These metrics are visualized as charts, tiles, and tables.
The following sections provide an overview of the visualizations.
Charts
Tiles
Example
Charts
Tiles
Example

This page shows purchases this year and last year, and growth by procurement category.
Charts
Tiles
Example

Charts
Example

Charts
Example

Charts
Example

The following data is used to fill the report pages in the Purchase spend analysis Power BI content. This data is represented as aggregate measurements that are staged in the Entity store. The Entity store is a Microsoft SQL Server database that is optimized for analytics. For more information, see Power BI integration with Entity store.
The aggregate measurements in this content are the subset of aggregate measurements that were available in the Purchase Cube in Microsoft Dynamics AX 2012 and Microsoft Dynamics AX 2012 R3. To stage the cube's aggregate measurements in the Entity store, you must make them deployable. For more information, see the procedure for staging aggregate measurements in the Entity store in Power BI integration with Entity store. The following key aggregate measurements are available directly from the Invoice lines entity and are used as the basis of the content.
| Entity | Key aggregate measurements | Data source | Field | Description |
|---|---|---|---|---|
| Invoice lines | Purchase | VendInvoiceTrans | SUM(LineAmountMST) | The amount in the accounting currency. |
The following table shows the key measurements in the content that are calculated from the Invoice lines entity.
| Measure | Calculation |
|---|---|
| Purchase current year | Purchase current year = SUM('Invoice lines'[Purchase]) |
| Purchase last year | Purchase last year = CALCULATE(SUM('Invoice lines'[Purchase]), SAMEPERIODLASTYEAR(Dates[Date])) |
| YOY purchase growth | YOY purchase growth = [Purchase current year] – [Purchase last year] |
The following key dimensions in the content are used as filters to slice the aggregate measurements, so that you can achieve more granularity and gain deeper analytical insights.
| Entity | Examples of attributes |
|---|---|
| Vendors | Vendor groups, Vendor country or regions, Vendor name |
| Products | Product number, Product name, Item groups name |
| Procurement categories | Procurement category, Procurement category names |
| Legal entities | Legal entity name |
| Dates | Dates, Year offset |
By default, the content shows data for the current calendar year. However, you can change the date filter in the report filters section. You can also change the company filter.
Events
Power BI DataViz World Championships
Feb 14, 4 PM - Mar 31, 4 PM
With 4 chances to enter, you could win a conference package and make it to the LIVE Grand Finale in Las Vegas
Learn moreTraining
Learning path
Implement finance and operations apps - Training
Plan and design your project methodology to successfully implement finance and operations apps with FastTrack services, data management and more.
Certification
Microsoft Certified: Power BI Data Analyst Associate - Certifications
Demonstrate methods and best practices that align with business and technical requirements for modeling, visualizing, and analyzing data with Microsoft Power BI.