Events
Mar 31, 11 PM - Apr 2, 11 PM
The ultimate Microsoft Fabric, Power BI, SQL, and AI community-led event. March 31 to April 2, 2025.
Register todayThis browser is no longer supported.
Upgrade to Microsoft Edge to take advantage of the latest features, security updates, and technical support.
Dashboards in Dynamics 365 Sales provide an overview of actionable business data that's viewable across the organization. Use dashboards to see important data at a glance.
Dashboards use views, lists, and charts to bring data that's meaningful to you to one place.
To open dashboards, select Dashboards in the site map.
Sales Hub comes with some prebuilt dashboards that you can use to quickly get insights on your sales data and team performance. The dashboards show daily work-related sales numbers, such as the activities you're working on, your sales pipeline, and your open opportunities and leads.
Sales reps or managers use the out-of-the-box Sales Pipeline chart to visualize the revenue for an opportunity based on each pipeline phase. More information: Understand the sales pipeline chart and its phases
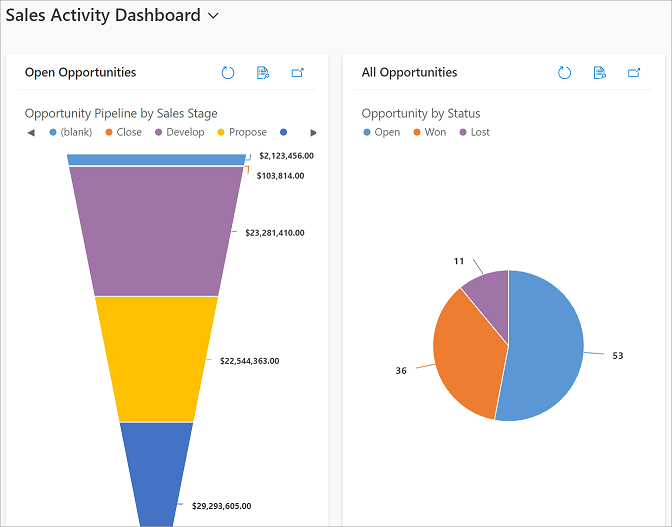
Sales Professional comes with the following prebuilt dashboards that you can use to quickly get insights on your sales data and team performance.
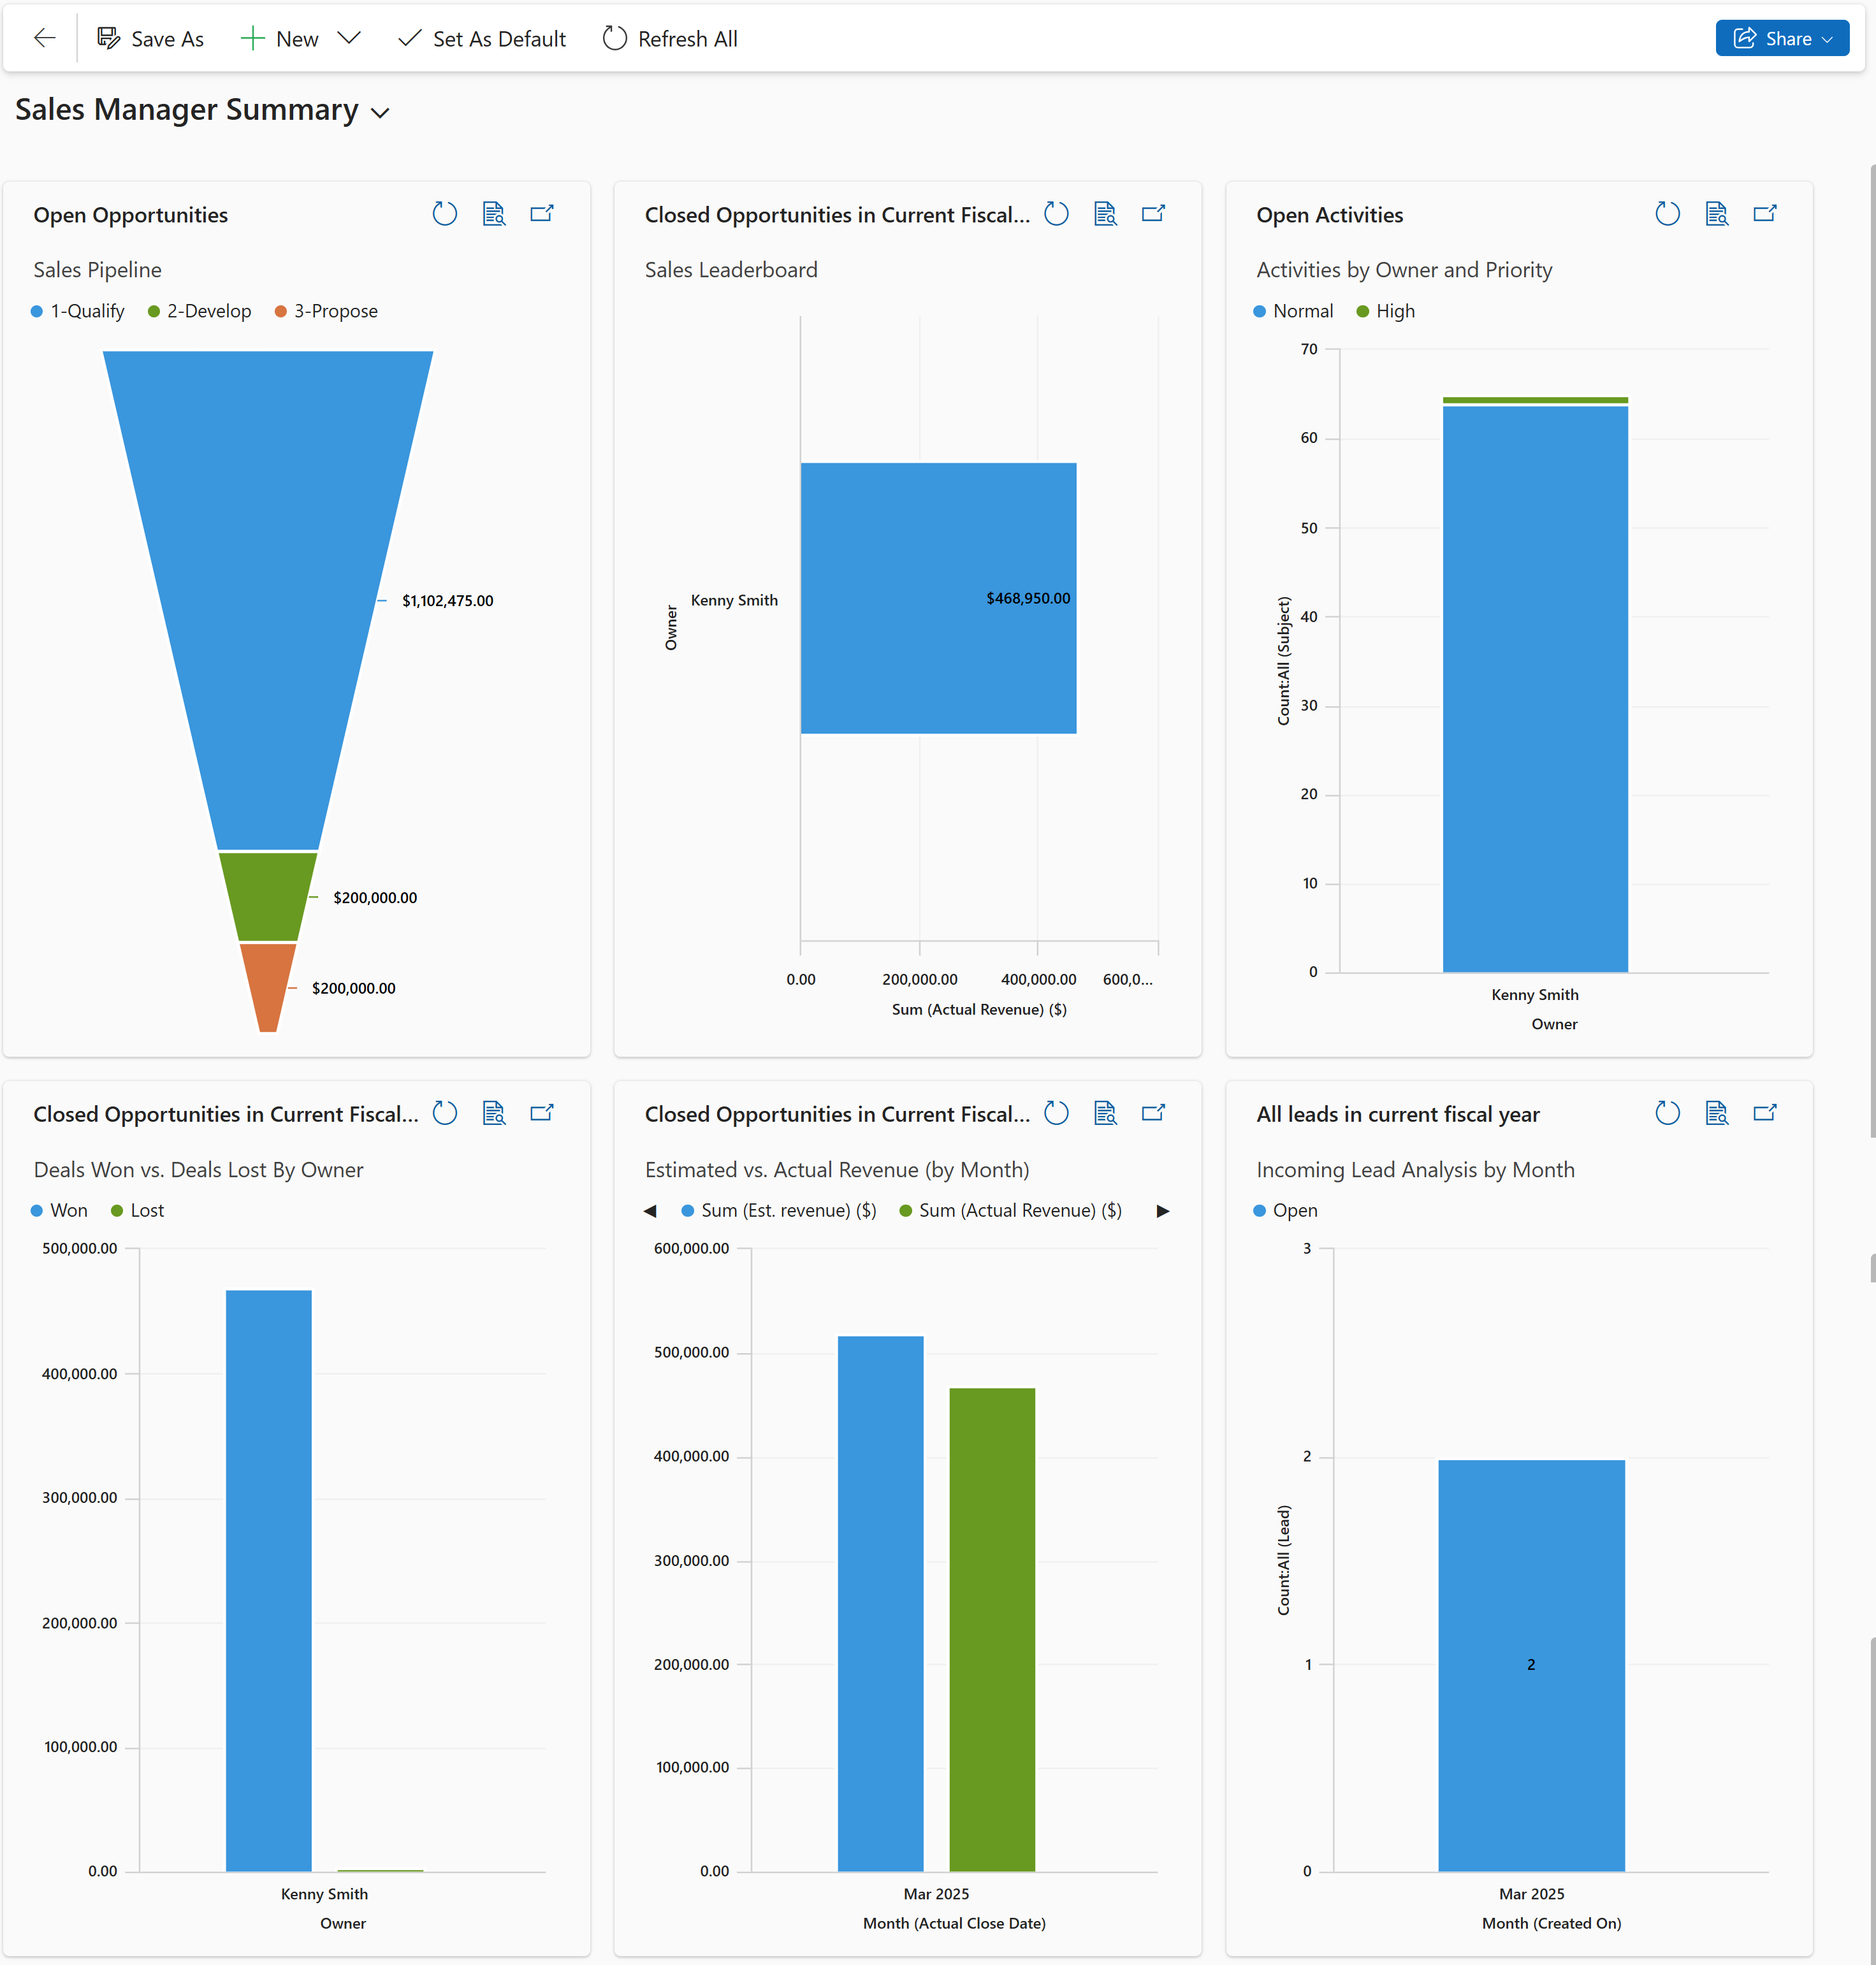
This dashboard shows data that helps sales managers get important insights on how their sales team is doing. The sales pipeline shows open opportunities in different stages.
The Deals Won vs. Deals Lost chart shows the number of opportunities won or lost by an owner. The dashboard also includes charts that show important financial data, such as estimated versus actual revenue by month.
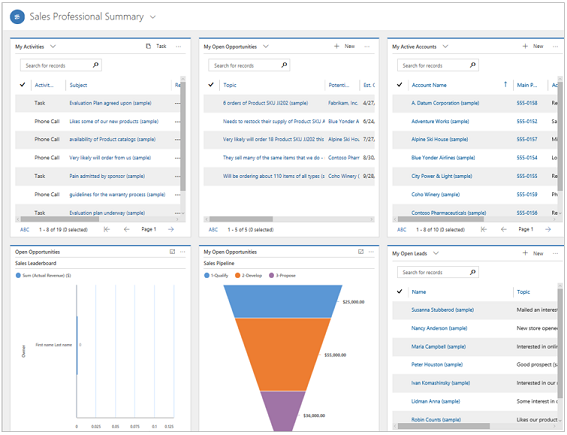
This dashboard shows daily work-related sales numbers, such as the activities you're working on, your sales pipeline, and your open opportunities and leads.
The interactive Sales dashboard helps you review information from various entities and act on it. You can use visual and global filters in the dashboard to quickly get to what's most important.
The Sales dashboard is a multi-stream dashboard, where each stream shows a view of an entity.
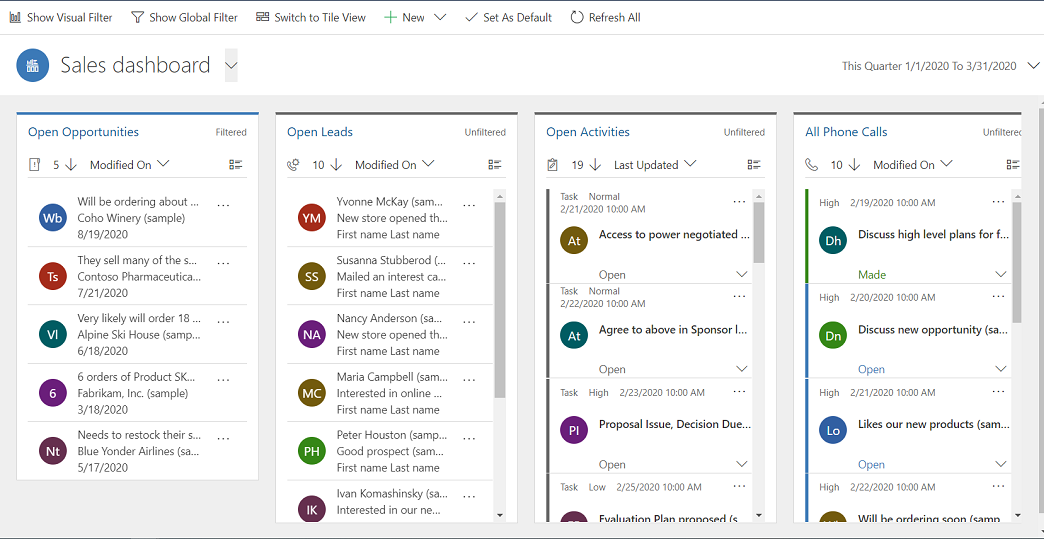
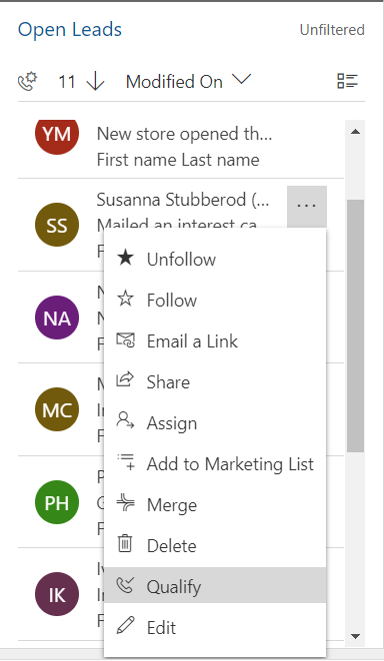
You can take entity-specific actions right from the stream. For example, in the Open Leads stream, select More options. From the More options menu, you can quickly qualify a lead or assign it to other users.
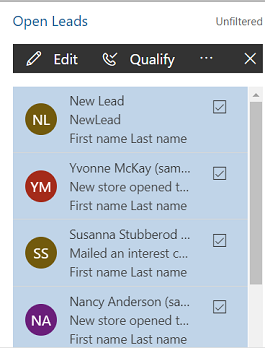
You can select multiple records and take action on all of them at once. Select Select multiple records to perform bulk actions  , select multiple records by selecting the check boxes next to the records, and then select More Commands (...) to show the actions that can be performed on the selected records.
When you select Show Visual Filter in a multi-stream dashboard, you see a row of visual filters at the top with the data streams below.
Visual filters provide a snapshot of key metrics, such as opportunities by account or by rating, or opportunities in different stages of a sales pipeline.
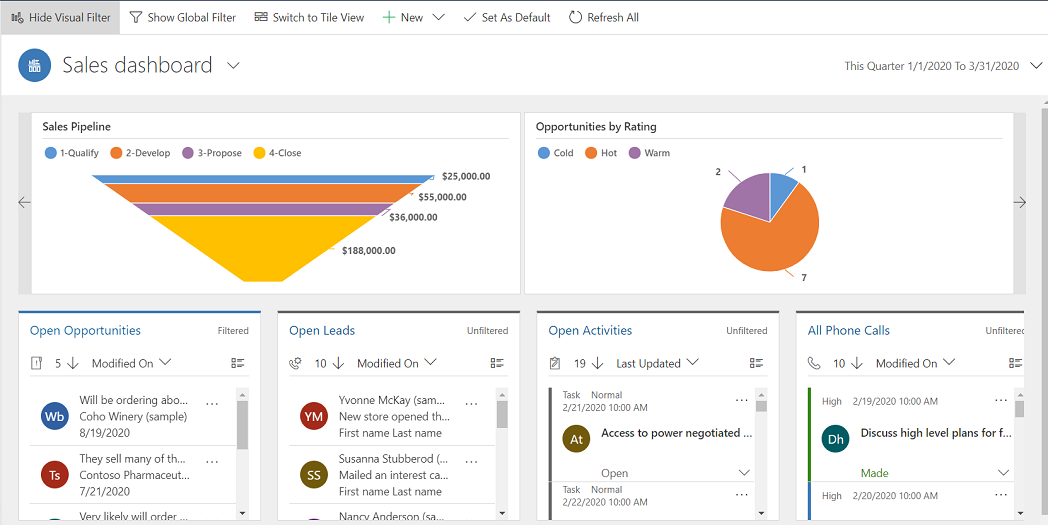
Use visual filters to display the information that interests you most. For example, when you select the Hot area of the Opportunities by Rating chart, the dashboard and the streams are refreshed to show only the opportunities that have a Hot rating.
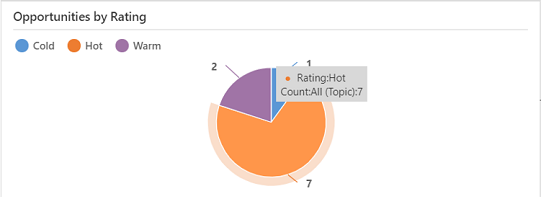
You'll see the filter applied at the top of the charts.

To remove a specific filter, select the Close icon for the applied filter.

To remove all applied filters, select Clear All.
To drill down further into your data, use the global filter. For example, you can apply the global filter to see only those opportunities whose estimated close date is set to a date in the current week.
To apply a global filter, select Show Global Filter on the command bar.
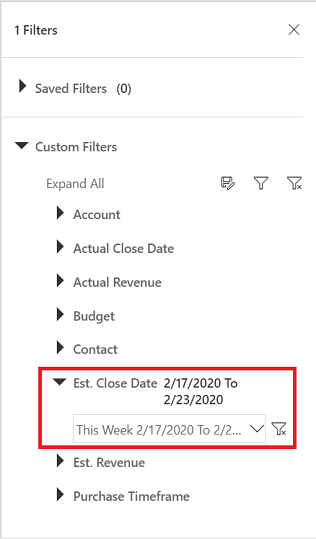
After you choose a filter, select Apply filter ![]() . You can also save this filter for the future by selecting Save as a reusable filter
. You can also save this filter for the future by selecting Save as a reusable filter  .
.
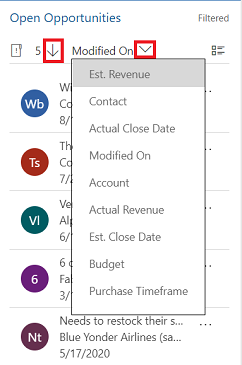
You can easily switch the sort order in the stream by selecting the field on which you want the data to be sorted.
You can use the view selector to select the dashboard of your choice. Select the view selector, and then select the dashboard you want to open from the drop-down list.
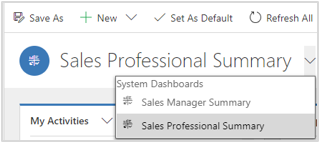
To see a specific dashboard every time you sign in to Sales Professional, set it as the default. To do this, open the dashboard, and then select Set as Default in the site map.
In addition to the dashboards described earlier, some dashboards display information specific to entities. These are available for Account, Contact, Lead, Opportunity, Quote, and Invoice entities. Remember, an entity is the same as a record type.
To see an entity dashboard, go to the list of records for the entity, and then select Open Dashboards on the command bar. For example, when you select Open Dashboard in the list of opportunities, the following dashboard specific to the Opportunity entity is displayed.
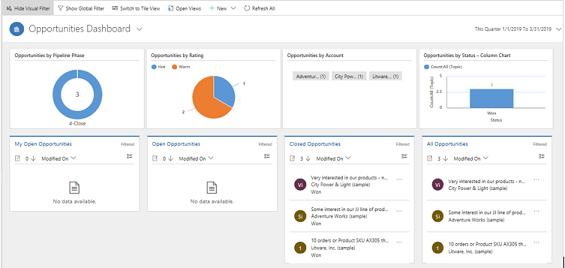
You can use the global or visual filters to show only the data that's important to you.
Events
Mar 31, 11 PM - Apr 2, 11 PM
The ultimate Microsoft Fabric, Power BI, SQL, and AI community-led event. March 31 to April 2, 2025.
Register todayTraining
Learning path
Work with Dynamics 365 Sales learning path - Training
Generate leads, create opportunities, and utilize embedded intelligence with Microsoft Dynamics 365 Sales. This learning path covers the key elements of the Sales app.
Certification
Microsoft Certified: Dynamics 365 Sales Functional Consultant Associate - Certifications
Demonstrate customization of Dynamics 365 Sales to provide clients with tools to manage customer information, gather insights, and automate best practices.