Review edge statistics
These statistics refer to edges in the process undergoing analysis and display their various properties. Edge statistics can be reviewed from the perspective of activities (process map-related edges) as well as from the viewpoint of resources (social chart-related edges).
To review edge statistics:
On the left panel in the opened view, select Statistics.
In the Category dropdown menu, select Edge statistics.
Select the metric for your chart in the dropdown menu in the chart.
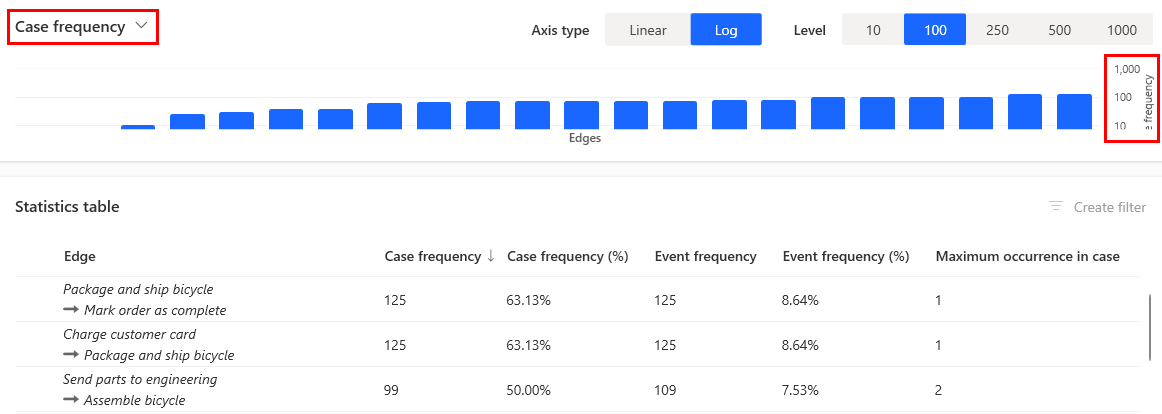
The metrics in the following table are available in the chart.
| Metric | Description |
|---|---|
| Case frequency | Total number of cases containing a particular edge in the process. |
| Case frequency (%) | Percentage of cases containing a particular edge in the process relative to all cases in the process. |
| Event frequency | Total number of each edge occurrence in the process. |
| Event frequency (%) | Percentage of each edge occurrence in the process relative to all edges. |
| Maximum occurrence in case | Largest number of edge repetitions in process instances. |
| Total duration | Total duration of each edge in the process. |
| Total duration (%) | Percentage of the total duration of each edge in the process relative to the total duration for all cases in the process. |
| Mean duration | Average duration of each edge in the process. |
| Mean duration (%) | Average duration of each edge in the process relative to the average duration for all cases in the process. |
| Minimum duration | Shortest duration of each edge in the process. |
| Maximum duration | Longest duration of each edge in the process. |
| Duration range | Difference between the longest and shortest duration of the occurrence of each edge for each edge in the process. |
| Duration std. dev. | Standard deviation of each edge duration in the process. |
| Self-loop count | Number of occurrences of self-loop edges. |
| Self-loop (%) | Percentage of occurrences of self-loop edges relative to their total occurrences in the process. To learn more, go to Rework metrics. |
| Loop count | Number of occurrences of edges in loops. |
| Loop (%) | Percentage of occurrences of edges in loops relative to their total occurrences in the process. |
| Loop inflow | Value of the loop inflow of edges in the process. |
| Loop inflow (%) | Percentage of loop inflow of edges relative to their total occurrences in the process. |
| Loop outflow | Value of loop outflow of edges in the process. |
| Loop outflow (%) | Percentage of loop outflow of edges relative to their total occurrences in the process. |
Besides these standard statistics, the list contains all defined edge-level custom metrics with the continuous output data type.
The summary provides an overview of standard metrics provided by Power Automate Process Mining. The list of these metrics isn't configurable and no additional metrics can be included in this summary row. The table of edges contains standard edge-level metrics, and custom metrics applicable on edge-level. In the table, all mentioned custom metrics are available regardless of their discrete or continuous output data type.
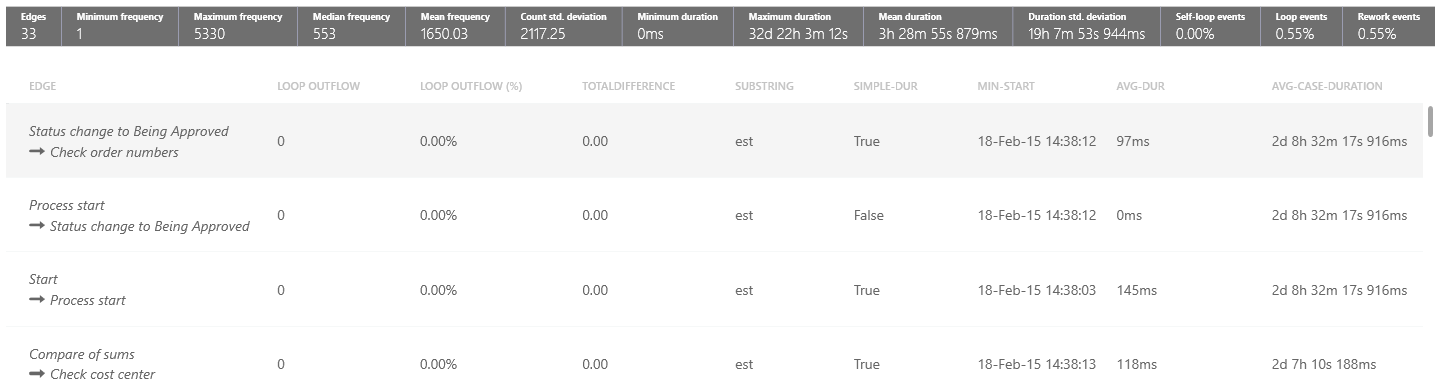
The metrics in the following table are available in the summary header.
| Metric | Description |
|---|---|
| Edges | Total number of unique edges in the view. |
| Minimum frequency | Minimal number of occurrences of an edge in a single case. |
| Maximum frequency | Maximum number of occurrences of an edge in a single case. |
| Median frequency | Median number of occurrences of an edge in a single case. |
| Mean frequency | Mean number of occurrences of an edge in a single case. |
| Count std. deviation | Standard deviation of edge occurrences in a view. |
| Minimum duration, maximum duration | The global minimum and maximum duration of a single edge. |
| Mean duration | The average duration of edges. |
| Duration std. deviation | The standard deviation of edges durations in a view. |
| Self-loop events | Shows the percentage of self-loop edges relative to the total number of edges in the view. A self-loop edge is an edge with the same starting and ending node (activity). |
| Loop events | Shows the percentage of edges in loops relative to the total number of edges in the view. An edge is in the loop if its ending node (activity) is repeated within a case. |
| Rework events | Shows the percentage of edges in rework relative to the total number of edges in the view. Rework edge is edge either in a loop or in a self-loop. |