This article is one in a series of articles describing the deployment path for OT monitoring with Microsoft Defender for IoT, and describes how to configure initial setup settings and activate your OT sensor.
Several initial setup steps can be performed in the browser or via CLI.
Use the browser if you can connect physical cables from your switch to the sensor to identify your interfaces correctly. Make sure to reconfigure your network adapter to match the default settings on the sensor.
Use the CLI if you know your networking details without needing to connect physical cables. Use the CLI if you can only connect to the sensor via iLo / iDrac
Configuring your setup via the CLI still requires you to complete the last few steps in the browser.
Prerequisites
To perform the procedures in this article, you need:
An OT sensor onboarded to Defender for IoT in the Azure portal.
OT sensor software installed on your appliance. Make sure that you've either installed the software yourself or purchased a preconfigured appliance.
The sensor's activation file, which was downloaded after onboarding your sensor. You need a unique activation file for each OT sensor you deploy.
All files downloaded from the Azure portal are signed by root of trust so that your machines use signed assets only.
Note
Activation files expire 14 days after creation. If you onboarded your sensor but didn't upload the activation file before it expired, download a new activation file.
The Defender for IoT | Overview page opens to the Management interface tab.
Define sensor networking details
In the Management interface tab, use the following fields to define network details for your new sensor:
Name
Description
Management interface
Select the interface you want to use as the management interface, to connect to the Azure portal.
To identify a physical interface on your machine, select an interface and then select Blink physical interface LED. The port that matches the selected interface lights up so that you can connect your cable correctly.
IP Address
Enter the IP address you want to use for your sensor. This is the IP address your team uses to connect to the sensor via the browser or CLI.
Subnet Mask
Enter the address you want to use as the sensor's subnet mask.
Default Gateway
Enter the address you want to use as the sensor's default gateway.
DNS
Enter the sensor's DNS server IP address.
Hostname
Enter the hostname you want to assign to the sensor. Make sure that you use the same hostname as is defined in the DNS server.
Enable proxy for cloud connectivity (Optional)
Select to define a proxy server for your sensor.
If you use an SSL/TSL certificate to access the proxy server, select Client certificate and upload your certificate.
When you're done, select Next: Interface configurations to continue.
Define the interfaces you want to monitor
The Interface configurations tab shows all interfaces detected by the sensor by default. Use this tab to turn monitoring on or off per interface, or define specific settings for each interface.
Tip
We recommend that you optimize performance on your sensor by configuring your settings to monitor only the interfaces that are actively in use.
In the Interface configurations tab, do the following to configure settings for your monitored interfaces:
Select the Enable/Disable toggle for any interfaces you want the sensor to monitor. You must select at least one interface to continue.
If you're not sure about which interface to use, select the Blink physical interface LED button to have the selected port blink on your machine. Select any of the interfaces that you've connected to your switch.
(Optional) For each interface you select to monitor, select the Advanced settings button to modify any of the following settings:
Name
Description
Mode
Select one of the following: - SPAN Traffic (no encapsulation) to use the default SPAN port mirroring. - ERSPAN if you're using ERSPAN mirroring.
Enter an optional description for the interface. You'll see this later on in the sensor's System settings > Interface configurations page, and these descriptions may be helpful in understanding the purpose of each interface.
Auto negotiation
Relevant for physical machines only. Use this option to determine which sort of communication methods are used, or if the communication methods are automatically defined between components.
Important: We recommend that you change this setting only on the advice of your networking team.
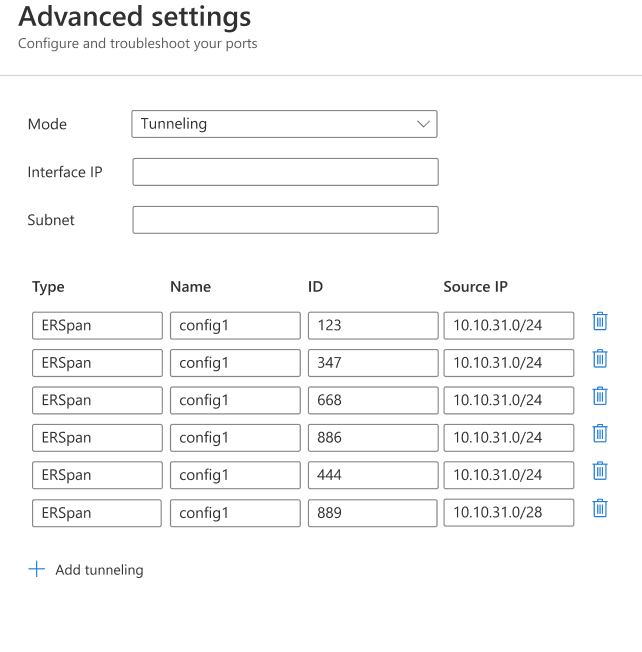
To add ERSPAN tunneling to your interface:
In the Mode option, select Tunneling from the drop-down list.
To configure the tunnel, update the following OT sensor details:
Description (optional).
Interface IP.
Subnet.
For example:
Select Save to save your changes.
Select Next: Reboot > to continue, and then Start reboot to reboot your sensor machine. After the sensor starts again, you're automatically redirected to the IP address you'd defined earlier as your sensor IP address.
Select Cancel to wait for the reboot.
Activate your OT sensor
This procedure describes how to activate your new OT sensor.
If you've configured the initial settings via the CLI until now, you'll start the browser-based configuration at this step. After the sensor reboots, you're redirected to the same Defender for IoT | Overview page, to the Activation tab.
To activate your sensor:
In the Activation tab, select Upload to upload the sensor's activation file that you downloaded from the Azure portal.
Select the terms and conditions option and then select Activate.
Select Next: Certificates.
If you have a connection problem between the cloud-based sensor and the Azure portal during the activation process that causes the activation to fail, a message appears below the Activate button. To solve the connectivity problem select Learn more and the Cloud connectivity pane opens. The pane lists the causes for the problem and recommendations to solve it.
Even without solving the problem you're able to continue to the next stage, by selecting Next: Certificates.
The only connection problem that must be fixed before moving to the next stage, is when a time drift is detected and the sensor isn't synchronized to the cloud. In this case the sensor must be correctly synchronized, as described in the recommendations, before moving to the next stage.
Define SSL/TLS certificate settings
Use the Certificates tab to deploy an SSL/TLS certificate on your OT sensor. We recommend that you use a CA-signed certificate for all production environments.
To define SSL/TLS certificate settings:
In the Certificates tab, select Import trusted CA certificate (recommended) to deploy a CA-signed certificate.
Enter the certificate's name and passphrase, and then select Upload to upload your private key file, certificate file, and an optional certificate chain file.
If you're working on a testing environment, you can also use the self-signed certificate that's generated locally during installation. If you select to use a self-signed certificate, make sure to select the Confirm option about the recommendations.
The information in this article applies to the sensor version 24.1.5. If you are running an earlier version, see configure ERSPAN mirroring.
To configure initial setup settings via CLI:
In the installation screen, after the default networking details are shown, press ENTER to continue.
At the D4Iot login prompt, sign in with the following default credentials:
Username: admin
Password: admin
When you enter your password, the password characters don't display on the screen. Make sure you enter them carefully.
At the prompt, enter a new password for the admin user. Your password must contain lowercase and uppercase alphabetic characters, numbers, and symbols.
When prompted to confirm your password, enter your new password again. For more information, see Default privileged users.
After changing the password, the Sensor Config wizard automatically starts. Continue to step 5.
If you're logging in on subsequent occasions continue to step 4.
To start the Sensor Config wizard, at the prompt type network reconfigure. If you are using the cyberx user, type ERSPAN=1 python3 -m cyberx.config.configure.
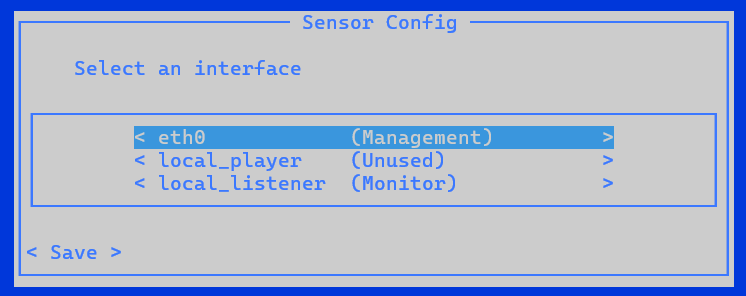
The Sensor Config screen shows the present setup of the interfaces. Ensure that one interface is set as the management interface. In this wizard, use the up or down arrows to navigate, and the SPACE bar to select an option. Press ENTER to advance to the next screen.
Select the interface you want to configure, for example:
In the Select type screen select the new configuration type for this interface.
Important
Make sure that you select only interfaces that are connected.
If you select interfaces that are enabled but not connected, the sensor will show a No traffic monitored health notification in the Azure portal. If you connect more traffic sources after installation and want to monitor them with Defender for IoT, you can add them later via the CLI.
An interface can be set as either Management, Monitor, Tunnel or Unused. You may wish to set an interface as Unused as a temporary setting, to reset it, or if a mistake was made in the original setup.
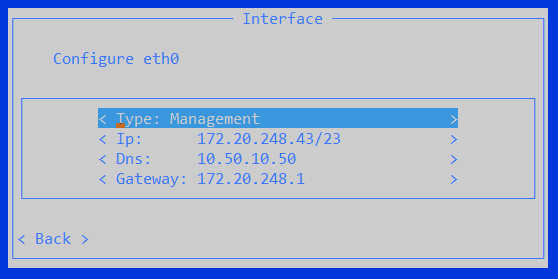
To configure a Management interface:
Select the interface.
Select Management.
Type the sensor's IP address, DNS server IP address and the default Gateway IP address.
Select Back.
To configure a Monitor interface:
Select the interface.
Select Monitor. The Sensor Config screen updates.
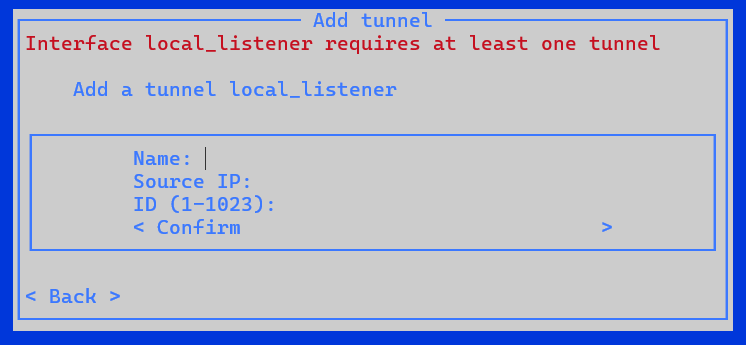
To configure an ERSPAN Tunnel interface:
Select Interface IP and add the IP and Subnet details.
Select Confirm.
Select Tunnels and add a Name, Source IP and an ID numbered between 1 and 1023.
Select Confirm.
To configure an interface as Unused:
Select the interface.
Select the existing status.
Select Unused. The Sensor Config screen updates.
After configuring all of the interfaces, select Save.
Automatic backup folder location
The sensor automatically creates a backup folder. To change the location of the mounted backups you must:
Log in to the sensor using the admin user.
Type the following code in the CLI interface: system backup path and then add the path location, for example /opt/sensor/backup.
The backup runs automatically and might take up to one minute.
Note
During initial setup, options for ERSPAN monitoring ports are available only in the browser-based procedure.
If you're defining your network details via CLI and want to set up ERSPAN monitoring ports, do so afterwards via the sensor's Settings > Interface connections page. For more information, see Update a sensor's monitoring interfaces (configure ERSPAN).
Plan and execute an endpoint deployment strategy, using essential elements of modern management, co-management approaches, and Microsoft Intune integration.

 Blink physical interface LED button to have the selected port blink on your machine. Select any of the interfaces that you've connected to your switch.