Events
Mar 31, 11 PM - Apr 2, 11 PM
The biggest Fabric, Power BI, and SQL learning event. March 31 – April 2. Use code FABINSIDER to save $400.
Register todayThis browser is no longer supported.
Upgrade to Microsoft Edge to take advantage of the latest features, security updates, and technical support.
Sizing a cluster appropriately is critical to the performance of Azure Data Explorer. A static cluster size can lead to underutilization or overutilization, neither of which is ideal. Because demand on a cluster can't be predicted with absolute accuracy, it's better to scale a cluster, adding and removing capacity and CPU resources with changing demand.
There are two workflows for scaling an Azure Data Explorer cluster:
By using horizontal scaling, you can scale the instance count automatically, based on predefined rules and schedules. To specify the autoscale settings for your cluster:
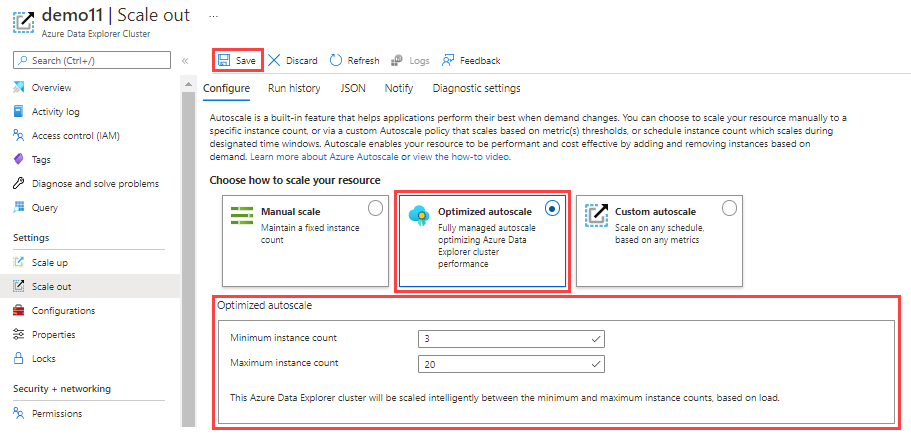
In the Azure portal, go to your Azure Data Explorer cluster resource. Under Settings, select Scale out.
In the Scale out window, select the autoscale method that you want: Manual scale, Optimized autoscale, or Custom autoscale.
In the manual scale option, the cluster has a static capacity that doesn't change automatically. Select the static capacity by using the Instance count bar. The cluster's scaling remains at the selected setting until changed.

Optimized autoscale is the default setting during cluster creation and the recommended scaling method. This method optimizes cluster performance and cost, as follows:
To configure optimized autoscale:
Select Optimized autoscale.
Specify a minimum and maximum instance count. The cluster autoscaling ranges between these values based on load.
Select Save.
Optimized autoscale starts working. Its actions can be viewed in the cluster's activity log in Azure.
Optimized autoscale is managed by either predictive or reactive logic. Predictive logic tracks the usage pattern of the cluster and when it identifies seasonality with high confidence, it manages the cluster's scaling. Otherwise, reactive logic that tracks the actual usage of the cluster is used to make decisions on cluster scale operations based on the current level of resource usage.
The main metrics for both predictive and reactive flows are:
Both predictive and reactive logic are bound to the cluster's size boundaries, the min and max number of instances, as defined in the optimized autoscale configuration. Frequent cluster scale out and scale in operations are undesirable because of the impact on the cluster's resources and the required time for adding or removing instances, as well as rebalancing the hot cache across all nodes.
Predictive logic forecasts the cluster's usage for the next day based on its usage pattern over the last few weeks. The forecast is used to create a schedule of scale in or scale out operations to adjust the cluster's size ahead of time. This allows the cluster scaling and data rebalancing to complete in time for when the load changes. This logic is especially effective for seasonal patterns, such as daily or weekly usage spikes.
However, in scenarios where there is a unique spike in usage that exceeds the forecast, optimized autoscale will fall back on reactive logic. When this happens, scale in or scale out operations are performed ad hoc based on the latest level of resource usage.
Scale out
When the cluster approaches a state of overutilization, a scale out operation will take place to maintain optimal performance. A scale out operation is performed when at least one of the following conditions occurs:
Scale in
When the cluster is underutilized, a scale in operation will take place to lower cost while maintaining optimal performance. Multiple metrics are used to verify that it's safe to scale in the cluster.
To ensure that there's no overloading of resources, the following metrics are evaluated before scale in is performed:
Note
The scale in logic requires a 1-day evaluation before implementation of optimized scale in. This evaluation takes place once every hour. If an immediate change is needed, use manual scale.
Although optimized autoscale is the recommended scaling option, Azure custom autoscale is also supported. By using custom autoscale, you can scale your cluster dynamically based on metrics that you specify. Use the following steps to configure custom autoscale.

In the Autoscale setting name box, enter a name, such as Scale-out: cache utilization.
For Scale mode, select Scale based on a metric. This mode provides dynamic scaling. You can also select Scale to a specific instance count.
Select + Add a rule.
In the Scale rule section on the right, enter values for each setting.
Criteria
| Setting | Description and value |
|---|---|
| Time aggregation | Select an aggregation criteria, such as Average. |
| Metric name | Select the metric you want the scale operation to be based on, such as Cache Utilization. |
| Time grain statistic | Choose between Average, Minimum, Maximum, and Sum. |
| Operator | Choose the appropriate option, such as Greater than or equal to. |
| Threshold | Choose an appropriate value. For example, for cache utilization, 80 percent is a good starting point. |
| Duration (in minutes) | Choose an appropriate amount of time for the system to look back when calculating metrics. Start with the default of 10 minutes. |
Action
| Setting | Description and value |
|---|---|
| Operation | Choose the appropriate option to scale in or scale out. |
| Instance count | Choose the number of nodes or instances you want to add or remove when a metric condition is met. |
| Cool down (minutes) | Choose an appropriate time interval to wait between scale operations. Start with the default of five minutes. |
Select Add.
In the Instance limits section on the left, enter values for each setting.
| Setting | Description and value |
|---|---|
| Minimum | The number of instances that your cluster won't scale below, regardless of utilization. |
| Maximum | The number of instances that your cluster won't scale above, regardless of utilization. |
| Default | The default number of instances. This setting is used if there are problems with reading the resource metrics. |
Select Save.
You've now configured horizontal scaling for your Azure Data Explorer cluster. Add another rule for vertical scaling. If you need assistance with cluster scaling issues, open a support request in the Azure portal.
Events
Mar 31, 11 PM - Apr 2, 11 PM
The biggest Fabric, Power BI, and SQL learning event. March 31 – April 2. Use code FABINSIDER to save $400.
Register todayTraining
Module
Dynamically meet changing web app performance requirements with autoscale rules - Training
Respond to periods of high activity by incrementally adding resources, and then removing these resources when activity drops, to reduce costs.
Certification
Microsoft Certified: Azure Database Administrator Associate - Certifications
Administer an SQL Server database infrastructure for cloud, on-premises and hybrid relational databases using the Microsoft PaaS relational database offerings.
Documentation
This article describes steps to scale up and scale down an Azure Data Explorer cluster based on changing demand.
Quickstart: Create an Azure Data Explorer cluster and database - Azure Data Explorer
In this quickstart, you learn how to create an Azure Data Explorer cluster and database.
Optimize for high concurrency with Azure Data Explorer - Azure Data Explorer
In this article, you learn to optimize your Azure Data Explorer setup for high concurrency.