New usability features for Boards, Pipelines and Reporting
Article
With this update, we add a new feature to the work item save button in Boards. In Pipelines, we added actions to the Pipelines overview page to make it easier to rerun failed jobs or entire stages. We've also made, the Analytics views feature in reporting generally available to all organizations.
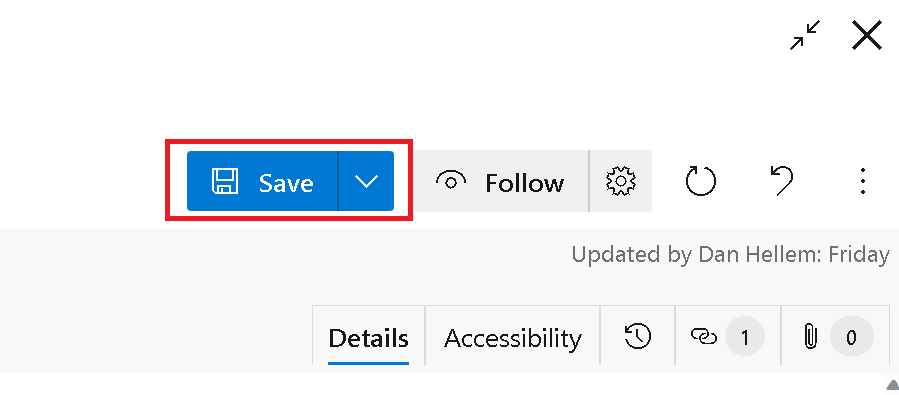
We added a small usability feature to the work item save button. The button choice between “Save” and “Save and Close” is now sticky for the next time you save a work item. This prevents making an extra click if you prefer “Save” over “Save and Close”.
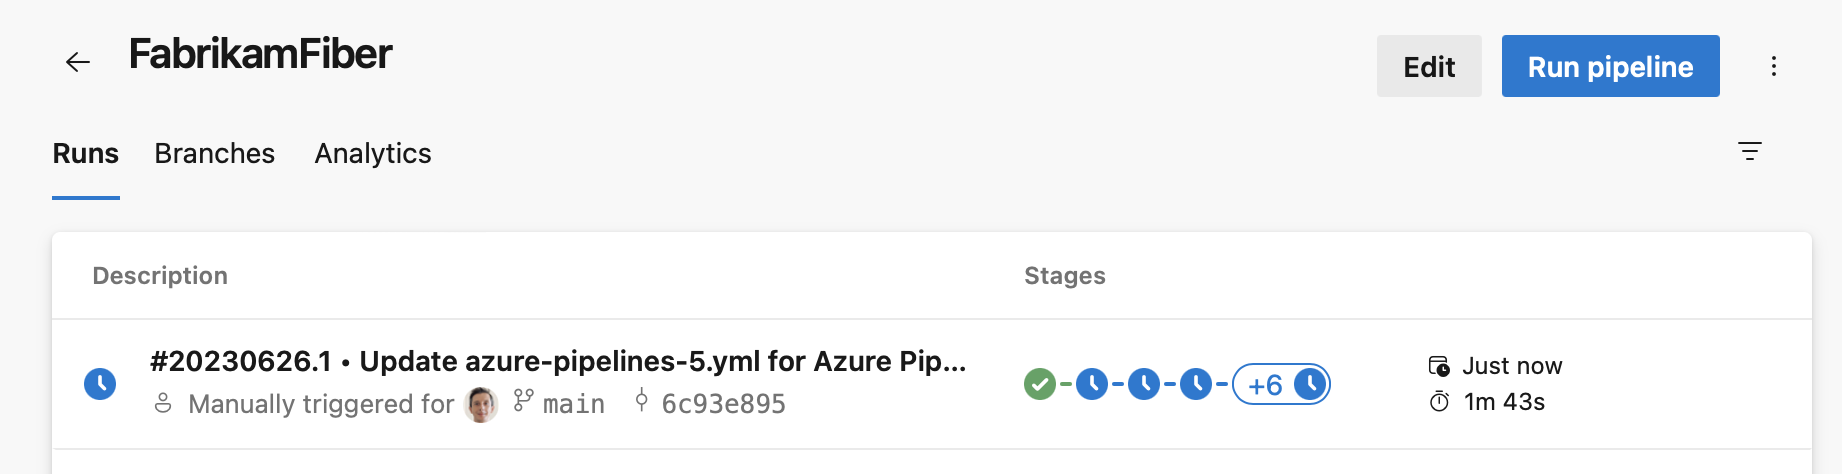
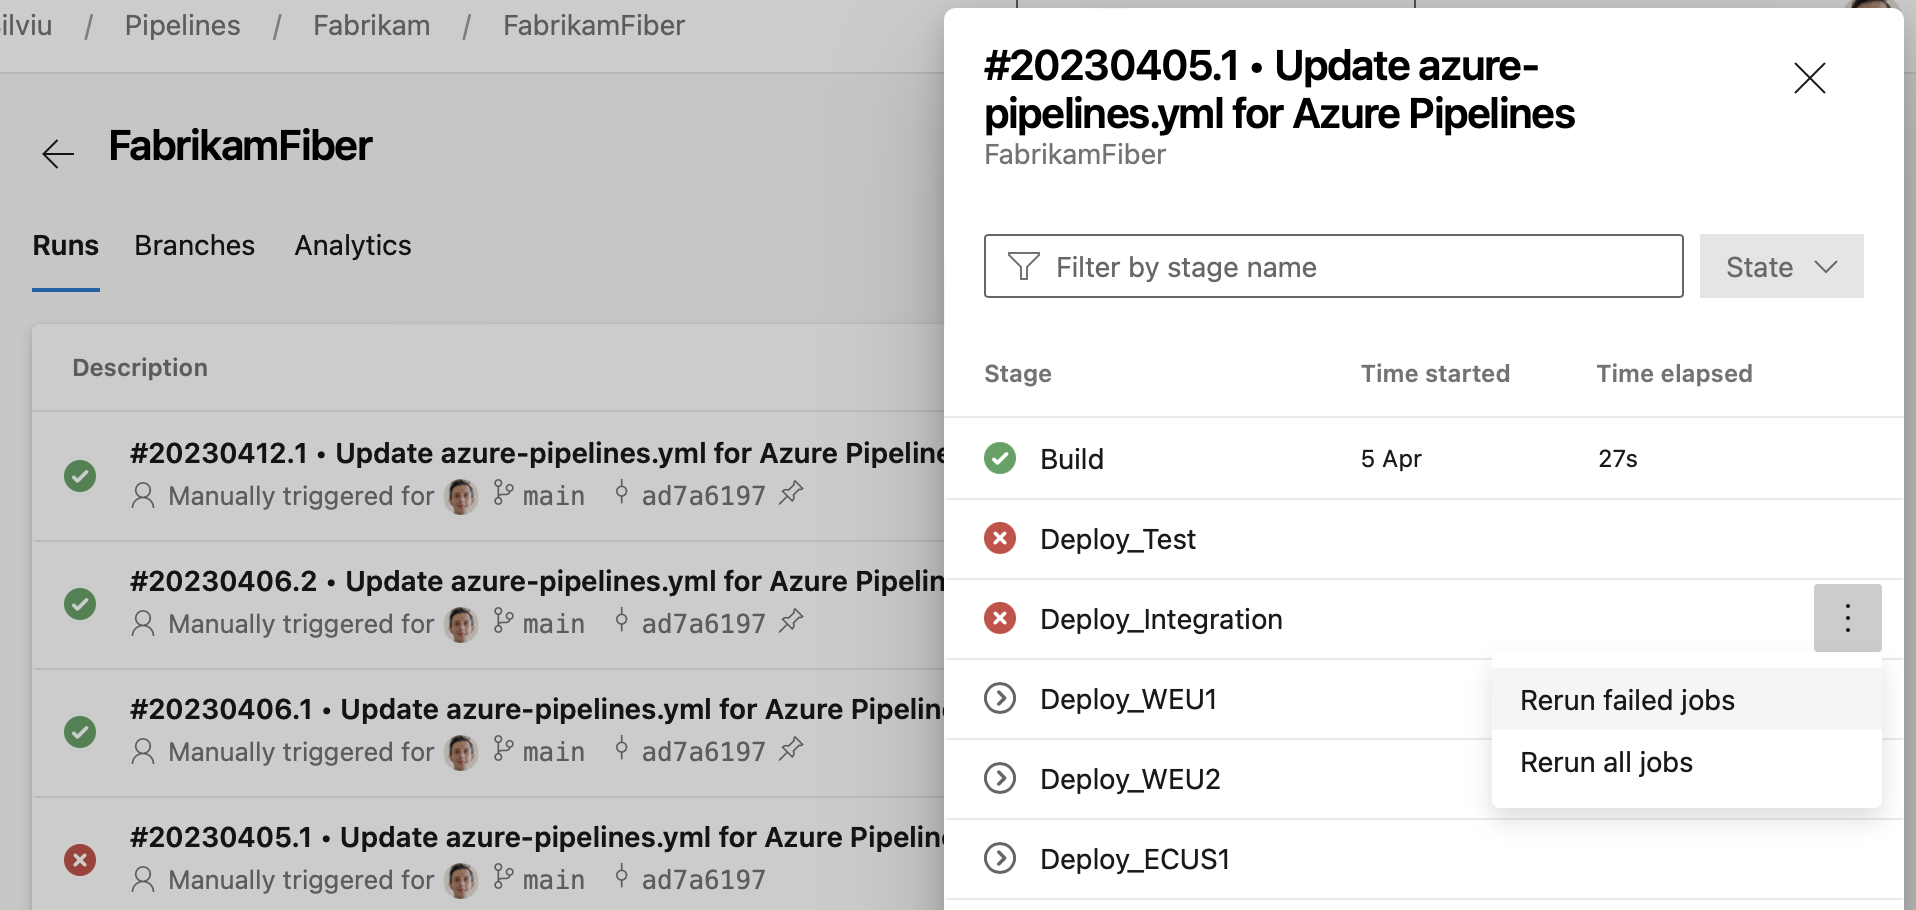
A pipeline's Runs screen gives you quick access to all a runs stages. In this sprint, we've added a stages panel from where you can perform actions for each stage. For example, you can easily rerun failed jobs or rerun the entire stage. The panel is available when not all stages fit in the user interface, as you can see in the following screenshot.
When you click on the '+' sign in the stages column, the stages panel shows up, and then you can perform stage actions.
Reporting
Analytics Views are now generally available
The Analytics Views feature has been in a preview state for an extended period of time. Today we are happy to announce that this feature is now generally available to all organizations.
In the navigation, Analytics views moved from the Overview tab to the Boards tab.
An Analytics view provides a simplified way to specify the filter criteria for a Power BI report based on Analytics data. If you are not familiar with Analytics Views, here is some documentation to get you caught up:
This certification measures your ability to accomplish the following technical tasks: Design and implement processes and communications, design and implement a source control strategy, design and implement build and release pipelines, develop a security and compliance plan, and implement an instrumentation strategy.