Monitor the performance of models deployed to production
APPLIES TO:
 Azure CLI ml extension v2 (current)
Python SDK azure-ai-ml v2 (current)
Azure CLI ml extension v2 (current)
Python SDK azure-ai-ml v2 (current)
In Azure Machine Learning, you can use model monitoring to continuously track the performance of machine learning models in production. Model monitoring provides you with a broad view of monitoring signals. It also alerts you to potential issues. When you monitor signals and performance metrics of models in production, you can critically evaluate the inherent risks of your models. You can also identify blind spots that might adversely affect your business.
In this article, you see how to perform the following tasks:
- Set up out-of-box and advanced monitoring for models that are deployed to Azure Machine Learning online endpoints
- Monitor performance metrics for models in production
- Monitor models that are deployed outside Azure Machine Learning or deployed to Azure Machine Learning batch endpoints
- Set up custom signals and metrics to use in model monitoring
- Interpret monitoring results
- Integrate Azure Machine Learning model monitoring with Azure Event Grid
The Azure CLI and the
mlextension to the Azure CLI, installed and configured. For more information, see Install and set up the CLI (v2).A Bash shell or a compatible shell, for example, a shell on a Linux system or Windows Subsystem for Linux. The Azure CLI examples in this article assume that you use this type of shell.
An Azure Machine Learning workspace. For instructions to create a workspace, see Set up.
A user account that has at least one of the following Azure role-based access control (Azure RBAC) roles:
- An Owner role for the Azure Machine Learning workspace
- A Contributor role for the Azure Machine Learning workspace
- A custom role that has
Microsoft.MachineLearningServices/workspaces/onlineEndpoints/*permissions
For more information, see Manage access to Azure Machine Learning workspaces.
For monitoring an Azure Machine Learning managed online endpoint or Kubernetes online endpoint:
A model that's deployed to the Azure Machine Learning online endpoint. Managed online endpoints and Kubernetes online endpoints are supported. For instructions for deploying a model to an Azure Machine Learning online endpoint, see Deploy and score a machine learning model by using an online endpoint.
Data collection enabled for your model deployment. You can enable data collection during the deployment step for Azure Machine Learning online endpoints. For more information, see Collect production data from models deployed for real-time inferencing.
For monitoring a model that's deployed to an Azure Machine Learning batch endpoint or deployed outside Azure Machine Learning:
- A means to collect production data and register it as an Azure Machine Learning data asset
- A means to update the registered data asset continuously for model monitoring
- (Recommended) Registration of the model in an Azure Machine Learning workspace, for lineage tracking
Model monitoring jobs are scheduled to run on serverless Spark compute pools. The following Azure Virtual Machines instance types are supported:
- Standard_E4s_v3
- Standard_E8s_v3
- Standard_E16s_v3
- Standard_E32s_v3
- Standard_E64s_v3
To specify a virtual machine instance type when you follow the procedures in this article, take the following steps:
When you use the Azure CLI to create a monitor, you use a YAML configuration file. In that file, set the create_monitor.compute.instance_type value to the type that you want to use.
Consider a scenario in which you deploy your model to production in an Azure Machine Learning online endpoint and enable data collection at deployment time. In this case, Azure Machine Learning collects production inference data and automatically stores it in Azure Blob Storage. You can use Azure Machine Learning model monitoring to continuously monitor this production inference data.
You can use the Azure CLI, the Python SDK, or the studio for an out-of-box setup of model monitoring. The out-of-box model monitoring configuration provides the following monitoring capabilities:
- Azure Machine Learning automatically detects the production inference data asset that's associated with an Azure Machine Learning online deployment and uses the data asset for model monitoring.
- The comparison reference data asset is set as the recent, past production inference data asset.
- Monitoring setup automatically includes and tracks the following built-in monitoring signals: data drift, prediction drift, and data quality. For each monitoring signal, Azure Machine Learning uses:
- The recent, past production inference data asset as the comparison reference data asset.
- Smart default values for metrics and thresholds.
- A monitoring job is configured to run on a regular schedule. That job acquires monitoring signals and evaluates each metric result against its corresponding threshold. By default, when any threshold is exceeded, Azure Machine Learning sends an alert email to the user who set up the monitor.
To set up out-of-box model monitoring, take the following steps.
In the Azure CLI, you use az ml schedule to schedule a monitoring job.
Create a monitoring definition in a YAML file. For a sample out-of-box definition, see the following YAML code, which is also available in the azureml-examples repository.
Before you use this definition, adjust the values to fit your environment. For
endpoint_deployment_id, use a value in the formatazureml:<endpoint-name>:<deployment-name>.# out-of-box-monitoring.yaml $schema: http://azureml/sdk-2-0/Schedule.json name: credit_default_model_monitoring display_name: Credit default model monitoring description: Credit default model monitoring setup with minimal configurations trigger: # perform model monitoring activity daily at 3:15am type: recurrence frequency: day #can be minute, hour, day, week, month interval: 1 # #every day schedule: hours: 3 # at 3am minutes: 15 # at 15 mins after 3am create_monitor: compute: # specify a spark compute for monitoring job instance_type: standard_e4s_v3 runtime_version: "3.3" monitoring_target: ml_task: classification # model task type: [classification, regression, question_answering] endpoint_deployment_id: azureml:credit-default:main # azureml endpoint deployment id alert_notification: # emails to get alerts emails: - abc@example.com - def@example.comRun the following command to create the model:
az ml schedule create -f ./out-of-box-monitoring.yaml


Azure Machine Learning provides many capabilities for continuous model monitoring. For a comprehensive list of this functionality, see Capabilities of model monitoring. In many cases, you need to set up model monitoring that supports advanced monitoring tasks. The following section provides a few examples of advanced monitoring:
- The use of multiple monitoring signals for a broad view
- The use of historical model training data or validation data as the comparison reference data asset
- Monitoring of the N most important features and individual features
Feature importance represents the relative importance of each input feature to a model's output. For example, temperature might be more important to a model's prediction than elevation. When you turn on feature importance, you can provide visibility into which features you don't want drifting or having data quality issues in production.
To turn on feature importance with any of your signals, such as data drift or data quality, you need to provide:
- Your training data asset as the
reference_datadata asset. - The
reference_data.data_column_names.target_columnproperty, which is the name of your model's output column, or prediction column.
After you turn on feature importance, you see a feature importance for each feature that you monitor in Azure Machine Learning studio.
You can turn alerts on or off for each signal by setting the alert_enabled property when you use the Python SDK or the Azure CLI.
You can use the Azure CLI, the Python SDK, or the studio to set up advanced model monitoring.
Create a monitoring definition in a YAML file. For a sample advanced definition, see the following YAML code, which is also available in the azureml-examples repository.
Before you use this definition, adjust the following settings and any others to meet the needs of your environment:
- For
endpoint_deployment_id, use a value in the formatazureml:<endpoint-name>:<deployment-name>. - For
pathin reference input data sections, use a value in the formatazureml:<reference-data-asset-name>:<version>. - For
target_column, use the name of the output column that contains values that the model predicts, such asDEFAULT_NEXT_MONTH. - For
features, list the features likeSEX,EDUCATION, andAGEthat you want to use in an advanced data quality signal. - Under
emails, list the email addresses that you want to use for notifications.
# advanced-model-monitoring.yaml $schema: http://azureml/sdk-2-0/Schedule.json name: fraud_detection_model_monitoring display_name: Fraud detection model monitoring description: Fraud detection model monitoring with advanced configurations trigger: # perform model monitoring activity daily at 3:15am type: recurrence frequency: day #can be minute, hour, day, week, month interval: 1 # #every day schedule: hours: 3 # at 3am minutes: 15 # at 15 mins after 3am create_monitor: compute: instance_type: standard_e4s_v3 runtime_version: "3.3" monitoring_target: ml_task: classification endpoint_deployment_id: azureml:credit-default:main monitoring_signals: advanced_data_drift: # monitoring signal name, any user defined name works type: data_drift # reference_dataset is optional. By default referece_dataset is the production inference data associated with Azure Machine Learning online endpoint reference_data: input_data: path: azureml:credit-reference:1 # use training data as comparison reference dataset type: mltable data_context: training data_column_names: target_column: DEFAULT_NEXT_MONTH features: top_n_feature_importance: 10 # monitor drift for top 10 features alert_enabled: true metric_thresholds: numerical: jensen_shannon_distance: 0.01 categorical: pearsons_chi_squared_test: 0.02 advanced_data_quality: type: data_quality # reference_dataset is optional. By default reference_dataset is the production inference data associated with Azure Machine Learning online endpoint reference_data: input_data: path: azureml:credit-reference:1 type: mltable data_context: training features: # monitor data quality for 3 individual features only - SEX - EDUCATION alert_enabled: true metric_thresholds: numerical: null_value_rate: 0.05 categorical: out_of_bounds_rate: 0.03 feature_attribution_drift_signal: type: feature_attribution_drift # production_data: is not required input here # Please ensure Azure Machine Learning online endpoint is enabled to collected both model_inputs and model_outputs data # Azure Machine Learning model monitoring will automatically join both model_inputs and model_outputs data and used it for computation reference_data: input_data: path: azureml:credit-reference:1 type: mltable data_context: training data_column_names: target_column: DEFAULT_NEXT_MONTH alert_enabled: true metric_thresholds: normalized_discounted_cumulative_gain: 0.9 alert_notification: emails: - abc@example.com - def@example.com- For
Run the following command to create the model:
az ml schedule create -f ./advanced-model-monitoring.yaml


When you use Azure Machine Learning model monitoring, you can track the performance of your models in production by calculating their performance metrics. The following model performance metrics are currently supported:
- For classification models:
- Precision
- Accuracy
- Recall
- For regression models:
- Mean absolute error (MAE)
- Mean squared error (MSE)
- Root mean squared error (RMSE)
Output data for the production model (the model's predictions) with a unique ID for each row. If you use the Azure Machine Learning data collector to collect production data, a correlation ID is provided for each inference request for you. The data collector also offers the option of logging your own unique ID from your application.
Note
For Azure Machine Learning model performance monitoring, we recommend that you use the Azure Machine Learning data collector to log your unique ID in its own column.
Ground truth data (actuals) with a unique ID for each row. The unique ID for a given row should match the unique ID for the model output data for that particular inference request. This unique ID is used to join your ground truth data asset with the model output data.
If you don't have ground truth data, you can't perform model performance monitoring. Ground truth data is encountered at the application level, so it's your responsibility to collect it as it becomes available. You should also maintain a data asset in Azure Machine Learning that contains this ground truth data.
(Optional) A prejoined tabular data asset with model output data and ground truth data already joined together.
Azure Machine Learning generates a correlation ID for you when you meet the following criteria:
- You use the Azure Machine Learning data collector to collect production inference data.
- You don't supply your own unique ID for each row as a separate column.
The generated correlation ID is included in the logged JSON object. However, the data collector batches rows that are sent within short time intervals of each other. Batched rows fall within the same JSON object. Within each object, all rows have the same correlation ID.
To differentiate between the rows in a JSON object, Azure Machine Learning model performance monitoring uses indexing to determine the order of the rows within the object. For example, if a batch contains three rows and the correlation ID is test, the first row has an ID of test_0, the second row has an ID of test_1, and the third row has an ID of test_2. To match your ground truth data asset unique IDs with the IDs of your collected production inference model output data, apply an index to each correlation ID appropriately. If your logged JSON object only has one row, use correlationid_0 as the correlationid value.
To avoid using this indexing, we recommend that you log your unique ID in its own column. Put that column within the pandas data frame that the Azure Machine Learning data collector logs. In your model monitoring configuration, you can then specify the name of this column to join your model output data with your ground truth data. As long as the IDs for each row in both data assets are the same, Azure Machine Learning model monitoring can perform model performance monitoring.
To understand the concepts that are associated with model performance monitoring, consider the following example workflow. It applies to a scenario in which you deploy a model to predict whether credit card transactions are fraudulent:
- Configure your deployment to use the data collector to collect the model's production inference data (input and output data). Store the output data in a column called
is_fraud. - For each row of the collected inference data, log a unique ID. The unique ID can come from your application, or you can use the
correlationidvalue that Azure Machine Learning uniquely generates for each logged JSON object. - When the ground truth (or actual)
is_frauddata is available, log and map each row to the same unique ID that's logged for the corresponding row in the model's output data. - Register a data asset in Azure Machine Learning, and use it to collect and maintain the ground truth
is_frauddata. - Create a model performance monitoring signal that uses the unique ID columns to join the model's production inference and ground truth data assets.
- Compute the model performance metrics.
After you satisfy the prerequisites for model performance monitoring, take the following steps to set up model monitoring:
Create a monitoring definition in a YAML file. The following sample specification defines model monitoring with production inference data. Before you use this definition, adjust the following settings and any others to meet the needs of your environment:
- For
endpoint_deployment_id, use a value in the formatazureml:<endpoint-name>:<deployment-name>. - For each
pathvalue in an input data section, use a value in the formatazureml:<data-asset-name>:<version>. - For the
predictionvalue, use the name of the output column that contains values that the model predicts. - For the
actualvalue, use the name of the ground truth column that contains the actual values that the model tries to predict. - For the
correlation_idvalues, use the names of the columns that are used to join the output data and the ground truth data. - Under
emails, list the email addresses that you want to use for notifications.
# model-performance-monitoring.yaml $schema: http://azureml/sdk-2-0/Schedule.json name: model_performance_monitoring display_name: Credit card fraud model performance description: Credit card fraud model performance trigger: type: recurrence frequency: day interval: 7 schedule: hours: 10 minutes: 15 create_monitor: compute: instance_type: standard_e8s_v3 runtime_version: "3.3" monitoring_target: ml_task: classification endpoint_deployment_id: azureml:loan-approval-endpoint:loan-approval-deployment monitoring_signals: fraud_detection_model_performance: type: model_performance production_data: input_data: path: azureml:credit-default-main-model_outputs:1 type: mltable data_column_names: prediction: is_fraud correlation_id: correlation_id reference_data: input_data: path: azureml:my_model_ground_truth_data:1 type: mltable data_column_names: actual: is_fraud correlation_id: correlation_id data_context: ground_truth alert_enabled: true metric_thresholds: tabular_classification: accuracy: 0.95 precision: 0.8 alert_notification: emails: - abc@example.com- For
Run the following command to create the model:
az ml schedule create -f ./model-performance-monitoring.yaml


You can also monitor models that you deploy to Azure Machine Learning batch endpoints or that you deploy outside Azure Machine Learning. If you don't have a deployment but you have production data, you can use the data to perform continuous model monitoring. To monitor these models, you must be able to:
- Collect production inference data from models deployed in production.
- Register the production inference data as an Azure Machine Learning data asset, and ensure continuous updates of the data.
- Provide a custom data preprocessing component and register it as an Azure Machine Learning component if you don't use the data collector to collect data. Without this custom data preprocessing component, the Azure Machine Learning model monitoring system can't process your data into a tabular form that supports time windowing.
Your custom preprocessing component must have the following input and output signatures:
| Input or output | Signature name | Type | Description | Example value |
|---|---|---|---|---|
| input | data_window_start |
literal, string | The data window start time in ISO8601 format | 2023-05-01T04:31:57.012Z |
| input | data_window_end |
literal, string | The data window end time in ISO8601 format | 2023-05-01T04:31:57.012Z |
| input | input_data |
uri_folder | The collected production inference data, which is registered as an Azure Machine Learning data asset | azureml:myproduction_inference_data:1 |
| output | preprocessed_data |
mltable | A tabular data asset that matches a subset of the reference data schema |
For an example of a custom data preprocessing component, see custom_preprocessing in the azuremml-examples GitHub repo.
For instructions for registering an Azure Machine Learning component, see Register component in your workspace.
After you register your production data and preprocessing component, you can set up model monitoring.
Create a monitoring definition YAML file that's similar to the following one. Before you use this definition, adjust the following settings and any others to meet the needs of your environment:
- For
endpoint_deployment_id, use a value in the formatazureml:<endpoint-name>:<deployment-name>. - For
pre_processing_component, use a value in the formatazureml:<component-name>:<component-version>. Specify the exact version, such as1.0.0, not1. - For each
path, use a value in the formatazureml:<data-asset-name>:<version>. - For the
target_columnvalue, use the name of the output column that contains values that the model predicts. - Under
emails, list the email addresses that you want to use for notifications.
# model-monitoring-with-collected-data.yaml $schema: http://azureml/sdk-2-0/Schedule.json name: fraud_detection_model_monitoring display_name: Fraud detection model monitoring description: Fraud detection model monitoring with your own production data trigger: # perform model monitoring activity daily at 3:15am type: recurrence frequency: day #can be minute, hour, day, week, month interval: 1 # #every day schedule: hours: 3 # at 3am minutes: 15 # at 15 mins after 3am create_monitor: compute: instance_type: standard_e4s_v3 runtime_version: "3.3" monitoring_target: ml_task: classification endpoint_deployment_id: azureml:fraud-detection-endpoint:fraud-detection-deployment monitoring_signals: advanced_data_drift: # monitoring signal name, any user defined name works type: data_drift # define production dataset with your collected data production_data: input_data: path: azureml:my_production_inference_data_model_inputs:1 # your collected data is registered as Azure Machine Learning asset type: uri_folder data_context: model_inputs pre_processing_component: azureml:production_data_preprocessing:1.0.0 reference_data: input_data: path: azureml:my_model_training_data:1 # use training data as comparison baseline type: mltable data_context: training data_column_names: target_column: is_fraud features: top_n_feature_importance: 20 # monitor drift for top 20 features alert_enabled: true metric_thresholds: numerical: jensen_shannon_distance: 0.01 categorical: pearsons_chi_squared_test: 0.02 advanced_prediction_drift: # monitoring signal name, any user defined name works type: prediction_drift # define production dataset with your collected data production_data: input_data: path: azureml:my_production_inference_data_model_outputs:1 # your collected data is registered as Azure Machine Learning asset type: uri_folder data_context: model_outputs pre_processing_component: azureml:production_data_preprocessing:1.0.0 reference_data: input_data: path: azureml:my_model_validation_data:1 # use training data as comparison reference dataset type: mltable data_context: validation alert_enabled: true metric_thresholds: categorical: pearsons_chi_squared_test: 0.02 alert_notification: emails: - abc@example.com - def@example.com- For
Run the following command to create the model.
az ml schedule create -f ./model-monitoring-with-collected-data.yaml
When you use Azure Machine Learning model monitoring, you can define a custom signal and implement any metric of your choice to monitor your model. You can register your custom signal as an Azure Machine Learning component. When your model monitoring job runs on its specified schedule, it computes the metrics that are defined within your custom signal, just as it does for the data drift, prediction drift, and data quality prebuilt signals.
To set up a custom signal to use for model monitoring, you must first define the custom signal and register it as an Azure Machine Learning component. The Azure Machine Learning component must have the following input and output signatures.
The component input data frame should contain the following items:
- An
mltablestructure that contains the processed data from the preprocessing component. - Any number of literals, each representing an implemented metric as part of the custom signal component. For example, if you implement the
std_deviationmetric, you need an input forstd_deviation_threshold. Generally, there should be one input with the name<metric-name>_thresholdper metric.
| Signature name | Type | Description | Example value |
|---|---|---|---|
production_data |
mltable | A tabular data asset that matches a subset of the reference data schema | |
std_deviation_threshold |
literal, string | The respective threshold for the implemented metric | 2 |
The component output port should have the following signature:
| Signature name | Type | Description |
|---|---|---|
signal_metrics |
mltable | The mltable structure that contains the computed metrics. For the schema of this signature, see the next section, signal_metrics schema. |
The component output data frame should contain four columns: group, metric_name, metric_value, and threshold_value.
| Signature name | Type | Description | Example value |
|---|---|---|---|
group |
literal, string | The top-level logical grouping to be applied to the custom metric | TRANSACTIONAMOUNT |
metric_name |
literal, string | The name of the custom metric | std_deviation |
metric_value |
numerical | The value of the custom metric | 44,896.082 |
threshold_value |
numerical | The threshold for the custom metric | 2 |
The following table shows example output from a custom signal component that computes the std_deviation metric:
| group | metric_value | metric_name | threshold_value |
|---|---|---|---|
| TRANSACTIONAMOUNT | 44,896.082 | std_deviation | 2 |
| LOCALHOUR | 3.983 | std_deviation | 2 |
| TRANSACTIONAMOUNTUSD | 54,004.902 | std_deviation | 2 |
| DIGITALITEMCOUNT | 7.238 | std_deviation | 2 |
| PHYSICALITEMCOUNT | 5.509 | std_deviation | 2 |
To see an example of a custom signal component definition and metric computation code, see custom_signal in the azureml-examples repo.
For instructions for registering an Azure Machine Learning component, see Register component in your workspace.
After you create and register your custom signal component in Azure Machine Learning, take the following steps to set up model monitoring:
Create a monitoring definition in a YAML file that's similar to the following one. Before you use this definition, adjust the following settings and any others to meet the needs of your environment:
- For
component_id, use a value in the formatazureml:<custom-signal-name>:1.0.0. - For
pathin the input data section, use a value in the formatazureml:<production-data-asset-name>:<version>. - For
pre_processing_component:- If you use the data collector to collect your data, you can omit the
pre_processing_componentproperty. - If you don't use the data collector and want to use a component to preprocess production data, use a value in the format
azureml:<custom-preprocessor-name>:<custom-preprocessor-version>.
- If you use the data collector to collect your data, you can omit the
- Under
emails, list the email addresses that you want to use for notifications.
# custom-monitoring.yaml $schema: http://azureml/sdk-2-0/Schedule.json name: my-custom-signal trigger: type: recurrence frequency: day # Possible frequency values include "minute," "hour," "day," "week," and "month." interval: 7 # Monitoring runs every day when you use the value 1. create_monitor: compute: instance_type: "standard_e4s_v3" runtime_version: "3.3" monitoring_signals: customSignal: type: custom component_id: azureml:my_custom_signal:1.0.0 input_data: production_data: input_data: type: uri_folder path: azureml:my_production_data:1 data_context: test data_window: lookback_window_size: P30D lookback_window_offset: P7D pre_processing_component: azureml:custom_preprocessor:1.0.0 metric_thresholds: - metric_name: std_deviation threshold: 2 alert_notification: emails: - abc@example.com- For
Run the following command to create the model:
az ml schedule create -f ./custom-monitoring.yaml
After you configure your model monitor and the first run finishes, you can view the results in Azure Machine Learning studio.
In the studio, under Manage, select Monitoring. In the Monitoring page, select the name of your model monitor to see its overview page. This page shows the monitoring model, endpoint, and deployment. It also provides detailed information about configured signals. The following image shows a monitoring overview page that includes data drift and data quality signals.

Look in the Notifications section of the overview page. In this section, you can see the feature for each signal that breaches the configured threshold for its respective metric.
In the Signals section, select data_drift to see detailed information about the data drift signal. On the details page, you can see the data drift metric value for each numerical and categorical feature that your monitoring configuration includes. If your monitor has more than one run, you see a trend line for each feature.
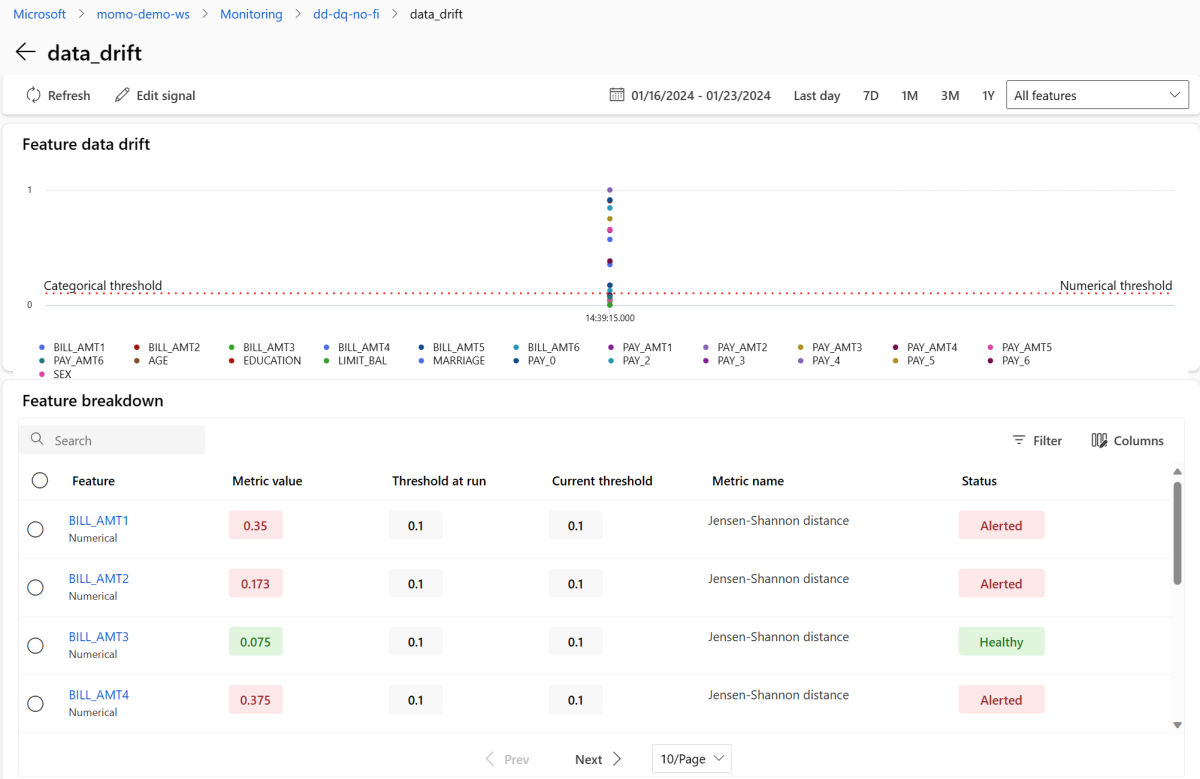
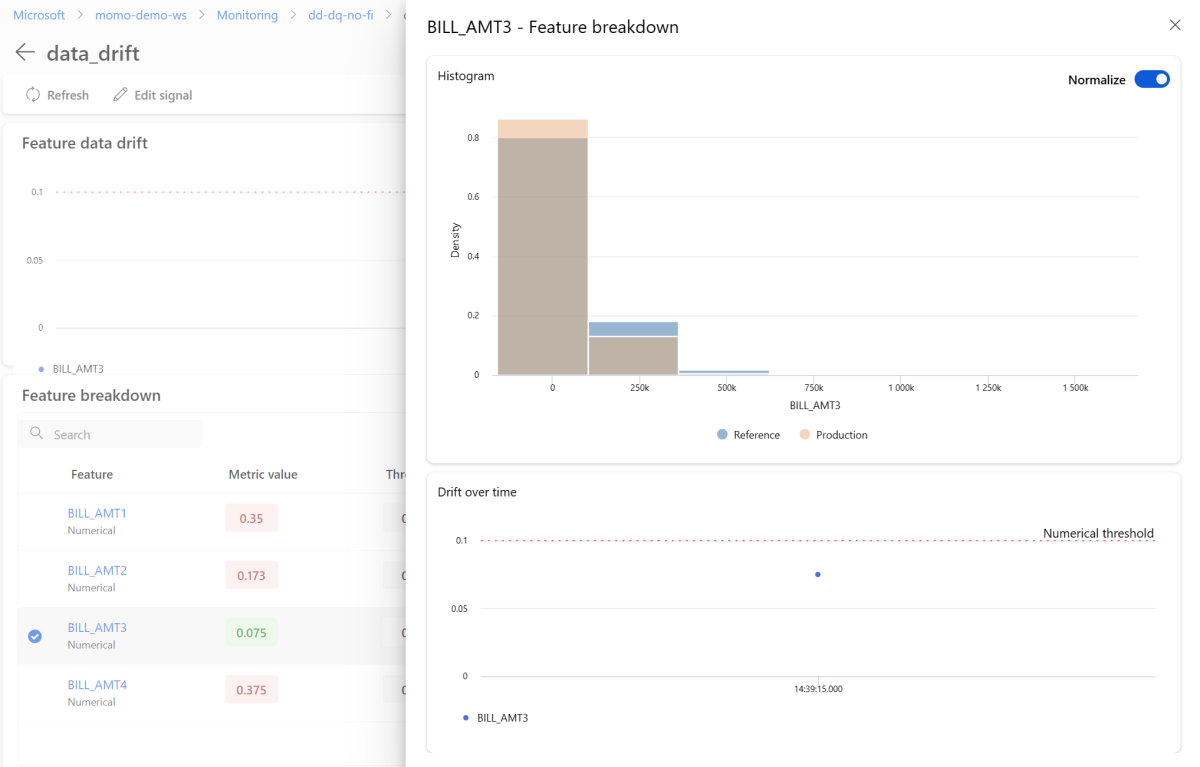
On the details page, select the name of an individual feature. A detailed view opens that shows the production distribution compared to the reference distribution. You can also use this view to track drift over time for the feature.
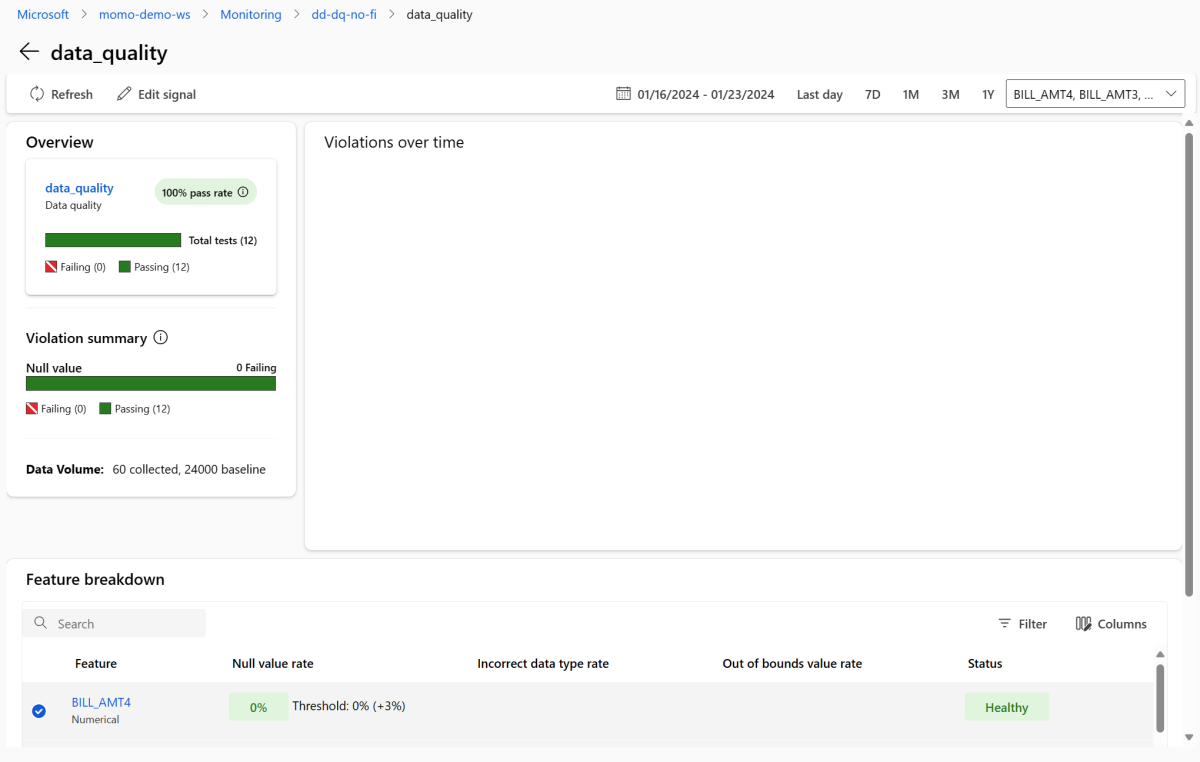
Return to the monitoring overview page. In the Signals section, select data_quality to view detailed information about this signal. On this page, you can see the null value rates, out-of-bounds rates, and data type error rates for each feature that you monitor.


Model monitoring is a continuous process. When you use Azure Machine Learning model monitoring, you can configure multiple monitoring signals to obtain a broad view into the performance of your models in production.
When you use Event Grid, you can configure events that are generated by Azure Machine Learning model monitoring to trigger applications, processes, and CI/CD workflows. You can consume events through various event handlers, such as Azure Event Hubs, Azure Functions, and Azure Logic Apps. When your monitors detect drift, you can take action programmatically, such as by running a machine learning pipeline to retrain a model and redeploy it.
To integrate Azure Machine Learning model monitoring with Event Grid, take the steps in the following sections.
If you don't have an Event Grid system topic to use for monitoring, create one. For instructions, see Create, view, and manage Event Grid system topics in the Azure portal.
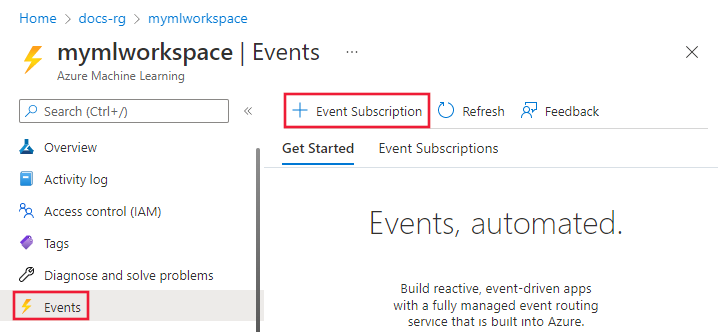
In the Azure portal, go to your Azure Machine Learning workspace.
Select Events, and then select Event Subscription.
Next to Name, enter a name for your event subscription, such as MonitoringEvent.
Under Event Types, select only Run status changed.
Warning
Select only Run status changed for the event type. Don't select Dataset drift detected, which applies to data drift v1, not Azure Machine Learning model monitoring.
Select the Filters tab. Under Advanced Filters, select Add new filter, and then enter the following values:
- Under Key, enter data.RunTags.azureml_modelmonitor_threshold_breached.
- Under Operator, select String contains.
- Under Value, enter has failed due to one or more features violating metric thresholds.

When you use this filter, events are generated when the run status of any monitor in your Azure Machine Learning workspace changes. The run status can change from completed to failed or from failed to completed.
To filter at the monitoring level, select Add new filter again, and then enter the following values:
- Under Key, enter data.RunTags.azureml_modelmonitor_threshold_breached.
- Under Operator, select String contains.
- Under Value, enter the name of a monitor signal that you want to filter events for, such as credit_card_fraud_monitor_data_drift. The name that you enter must match the name of your monitoring signal. Any signal that you use in filtering should have a name in the format
<monitor-name>_<signal-description>that includes the monitor name and a description of the signal.
Select the Basics tab. Configure the endpoint that you want to serve as your event handler, such as Event Hubs.
Select Create to create the event subscription.

After you capture events, you can view them on the event handler endpoint page:

You can also view events in the Azure Monitor Metrics tab:
