Note
Access to this page requires authorization. You can try signing in or changing directories.
Access to this page requires authorization. You can try changing directories.
Dashboards are collections of charts relating to Microsoft Dataverse tables.
There are two types of dashboards, user dashboards and system dashboards. An app user can create a dashboard visible only to them in the app areas where they have privileges.
An admin or customizer creates or customizes system dashboards that, when published, are visible to all app users. A user can choose to set their user dashboard as their default dashboard and override the system dashboard.
Dashboard interactivity
Dashboards can be standard or interactive.
Standard dashboards support adding one or more unrelated components such as charts or lists.
Interactive dashboards provide the capability for users to act on a particular row directly from the dashboard. This article focuses on standard system dashboards. For information about interactive dashboards, see Configure model-driven app interactive experience dashboards.
Create a new standard dashboard
Sign in to Power Apps.
Select Solutions in the left navigation pane, and then open the unmanaged solution you want or create a new one. If the item isn’t in the side panel pane, select …More and then select the item you want.
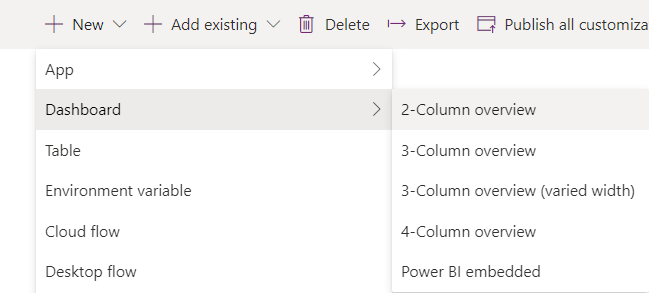
On the toolbar select New, select Dashboard, and then choose one of the following layouts:
- 2-column overview
- 3-column overview
- 3-column overview (varied width)
- 4-column overview
- Power BI embedded
If you select Power BI embedded, go to Create or edit a Power BI embedded system dashboard. Otherwise, in the Dashboard: New page, enter a name for the dashboard.
In one of the component sections, select the icon for a chart or a list.
Up to six components can be included in a dashboard.
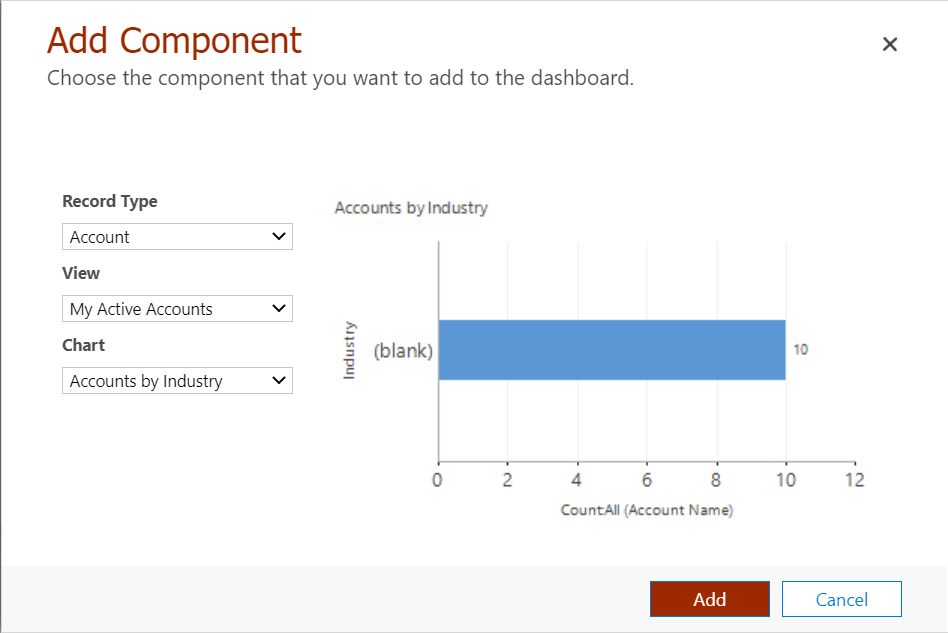
For example, to add a chart, select the chart icon on the tile of the dashboard canvas where the chart needs to appear. Then, in the Add Component dialog, select values for Record Type, View, and Chart. Then select Add to add the chart to the dashboard. For information about how to create a chart, see Create a model-driven app system chart.
When you finish adding components to the dashboard, select Save and then Close.
On the solution toolbar, select Publish.
Edit an existing dashboard
Sign in to Power Apps.
Select Solutions in the left navigation pane, and then open the solution you need. If the item isn’t in the side panel pane, select …More and then select the item you want.
In the list of solution components, open the dashboard, select one of the component areas, and then on the toolbar select Edit Component.
In the Set Properties dialog box, make changes to a chart or list such as change the table, default view, or add a chart selector. When done, select OK.
For more information about setting dashboard component properties, see Set properties for a chart or list included in a dashboard.
When the changes are complete, select Save and then select Close.
On the solution toolbar, select Publish.
Note
Lists in the dashboard designer don't display a data preview.