WinDbg is the latest version of WinDbg with more modern visuals, faster windows, a full-fledged scripting experience, built with the extensible debugger data model front and center.
Note
Formerly released as WinDbg Preview in the Microsoft Store, WinDbg leverages the same underlying engine as WinDbg (Classic) and supports all the same commands, extensions, and workflows.
General features
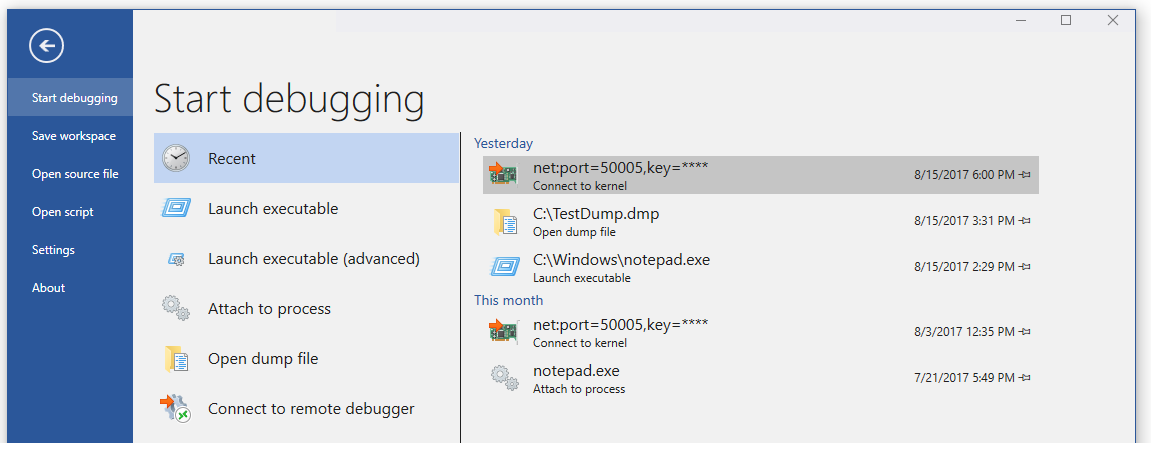
Connection setup and recall - Recent targets and session configurations are saved. They can be quickly restarted from the file menu.
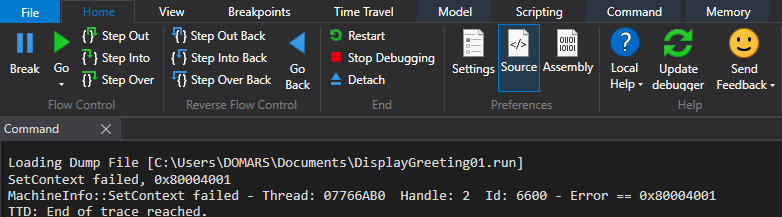
Dark theme - Go to File > Settings to enable the dark theme.
Keyboard navigation - Use Ctrl+Tab to easily navigate between windows with just your keyboard.
Performance improvements - Tool windows load asynchronously and can be canceled. When you run a command, WinDbg can stop the loading of your locals, watch, or other windows.
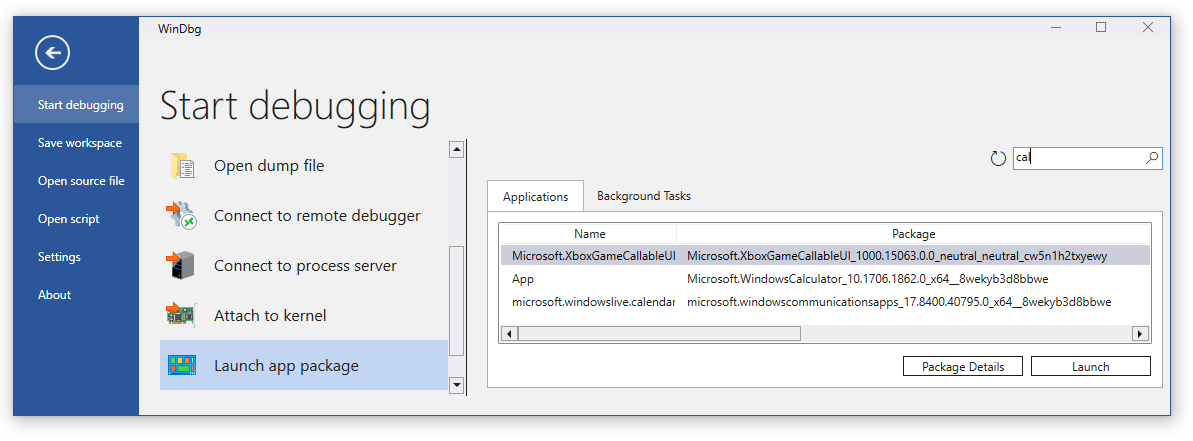
Start debugging view
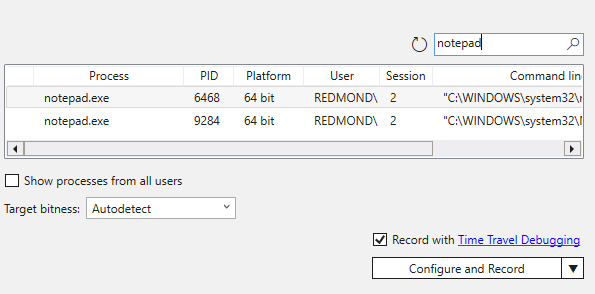
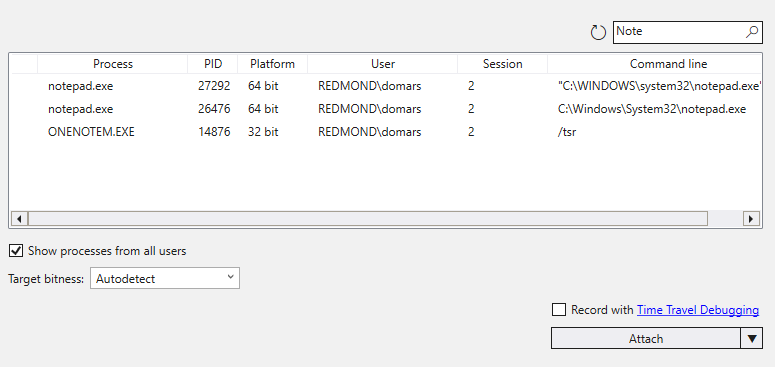
Integrated Time Travel Debugging (TTD) - Use the "Record with Time Travel Debugging" checkbox when launching or attaching to a process. WinDbg will set up TTD, start recording, and open the trace afterwards.
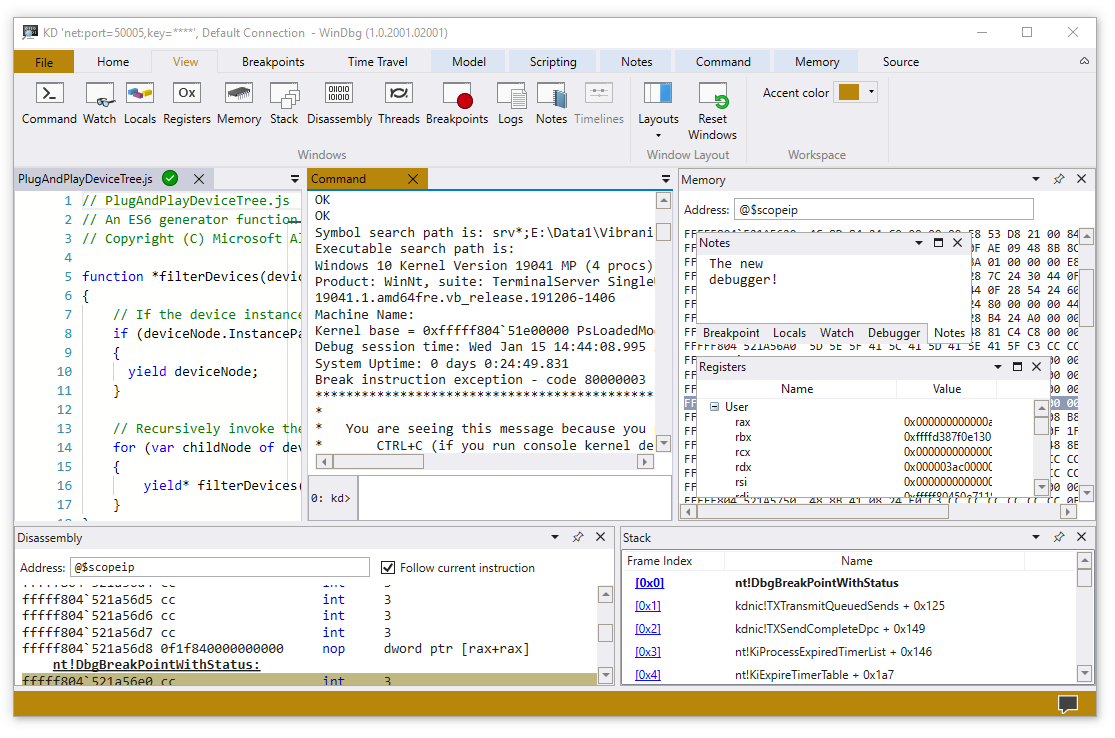
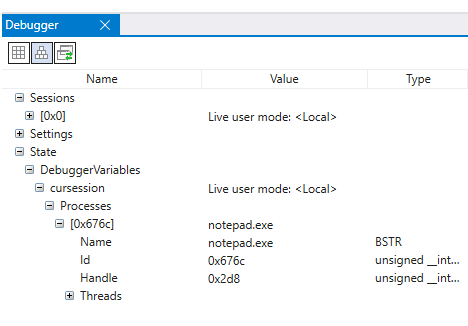
Data model - The model window provides an expandable and browsable version of dx and dx -g, letting you create powerful tables on-top of your NatVis, JavaScript, and LINQ queries.
Locals and watch - The locals and watch windows are both based off the data model that is used by the dx command. This means they benefit from the same features as other data model windows.
Memory - The memory window has highlighting and improved scrolling.
Logs - This is an under the covers log of the WinDbg internals. It can be viewed for troubleshooting or to monitor long running commands.
Providing feedback
Your feedback helps our team guide WinDbg's development and prioritize features.
To report any bugs or suggest a new feature, you can follow the feedback button in the ribbon to go to the GitHub page where you can file a new issue.
Other resources
For information on what's new in the most recent release, see Release notes.
Review these topics to install and configure WinDbg:
Learn how to efficiently debug your .NET app by using Visual Studio to fix your bugs quickly. Use the interactive debugger within Visual Studio to analyze and fix your C# applications.