Events
Microsoft 365 Community Conference
May 6, 2 PM - May 9, 12 AM
Skill up for the era of AI at the ultimate community-led Microsoft 365 event, May 6-8 in Las Vegas.
Learn moreThis browser is no longer supported.
Upgrade to Microsoft Edge to take advantage of the latest features, security updates, and technical support.
The Microsoft 365 Reports dashboard shows you the activity overview across the products in your organization. It enables you to drill in to individual product level reports to give you more granular insight about the activities within each product. Check out the Reports overview topic.
In the Project activity report, you can understand the activity of every user licensed to use Microsoft Project by looking at their interaction with Project. It also helps you to understand the level of collaboration going on by looking at the number of projects visited and tasks created or edited.
You can use this report to see the activity and usage of Project in your environment. You will see four summary charts in this report: 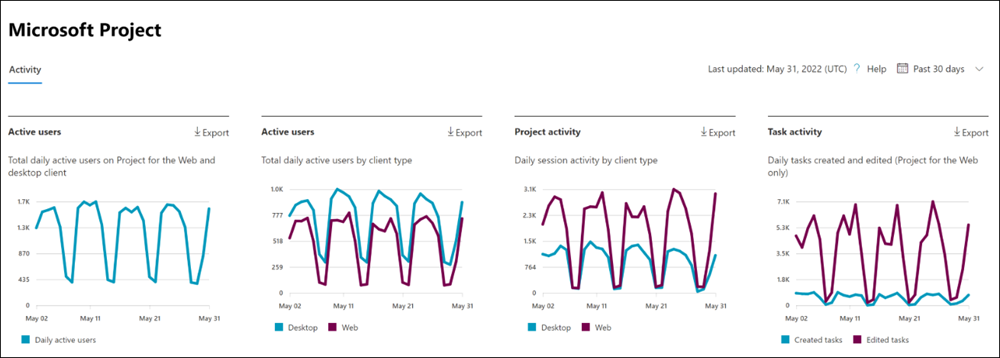
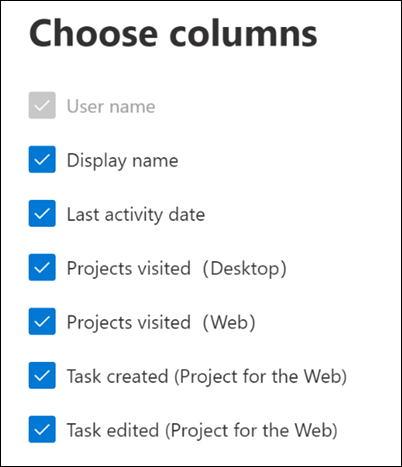
The report also has a table that shows activity for each project user in your environment.
Select Choose columns to add or remove columns from the table.
You can also export the report data into an Excel .csv file by selecting the Export link. This exports data of all users and enables you to do simple sorting and filtering for further analysis.
The Project activity report can be viewed for trends over the last 7 days, 30 days, 90 days, or 180 days. If you select a particular day in the report, the per user data table will be updated accordingly to display users' usage on that day. However, this feature only works for the most recent 28 days.
If users or admins have their privacy settings set to Neither, we do not have accurate metrics for the Project activity chart for the Project Online desktop client. The numbers shown will be undercounted. For more information on privacy settings, see Use policy settings to manage privacy controls for Microsoft 365 Apps for enterprise.
The following are definitions for each metric in the user activity table.
| Item | Description |
|---|---|
| User name | The user's principal name. |
| Display name | The full name of the user. |
| Last activity date | The latest date the user in that row had activity in Project, including any of the activities in the summary reports. |
| Projects visited (Desktop) | The number of projects opened by the user in the Project Online desktop client during the time range selected in the top right of the page. |
| Projects visited (Web) | The number of projects visited by the user in Project for the Web during the time range selected in the top right of the page. |
| Tasks created (Web) | The number of tasks created by the user in Project for the Web during the time range selected in the top right of the page. |
| Tasks edited (Web) | The number of tasks edited by the user in Project for the Web during the time range selected in the top right of the page. |
| Other | This value is true if the user has performed an activity in Project Online desktop client or in Project for the Web (that is not covered by the other columns) in the time range selected in the top right of the page. If the user has not, this value is false. |
Events
Microsoft 365 Community Conference
May 6, 2 PM - May 9, 12 AM
Skill up for the era of AI at the ultimate community-led Microsoft 365 event, May 6-8 in Las Vegas.
Learn moreTraining
Module
Monitor your Microsoft Teams environment - Training
Learn about different reports and dashboards to monitor your Teams environment, including Microsoft 365 and Teams usage reports, Microsoft Adoption Score, Microsoft Entra ID, access reviews, and Microsoft 365 network connectivity dashboard.
Certification
Microsoft 365 Certified: Teams Administrator Associate - Certifications
Demonstrate skills to plan, deploy, configure, and manage Microsoft Teams to focus on efficient and effective collaboration and communication in a Microsoft 365 environment.