Events
Power BI DataViz World Championships
Feb 14, 4 PM - Mar 31, 4 PM
With 4 chances to enter, you could win a conference package and make it to the LIVE Grand Finale in Las Vegas
Learn moreThis browser is no longer supported.
Upgrade to Microsoft Edge to take advantage of the latest features, security updates, and technical support.
APPLIES TO: ![]() Power BI Desktop
Power BI Desktop ![]() Power BI service
Power BI service
To see the data being used to create a visual, you can display that data in Power BI, or export it to Excel. This article shows you how to export to Excel. Data can be exported to Excel from a Power BI dashboard tile and from a report visual.
Important
Not all data can be viewed or exported by all users. There are safeguards that report designers and administrators use when building dashboards and reports. Some data is restricted, hidden, or confidential, and cannot be seen or exported without special permissions. If you're a designer or admin, select the tab for Admin and designer controls for exporting.
If you do have permissions to the data, you can see, and export the data that Power BI uses to create a visualization.
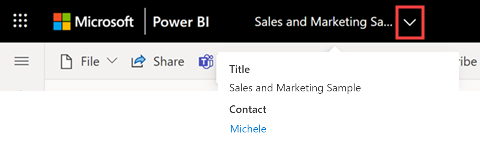
If you don't have permissions to the data, you can't export or open in Excel. Often, data is confidential or limited to specific users. For details, see the Considerations and limitations section at the end of this document. If you're working in the Power BI service, you can contact your Power BI administrator, or you can look up the contact information for the dashboard owner to request export permissions. To find the owner, select the dropdown next to the report title.
Report owners can classify and label reports using sensitivity labels from Microsoft Purview Information Protection. If the sensitivity label has protection settings, Power BI applies these protection settings when exporting report data to Excel, PowerPoint, or PDF files. Only authorized users are able to open protected files.
Security and Power BI administrators can use Microsoft Defender for Cloud Apps to monitor user access and activity, perform real-time risk analysis, and set label-specific controls. For example, organizations can use Microsoft Defender for Cloud Apps to configure a policy that prevents users from downloading sensitive data from Power BI to unmanaged devices.
Open a dashboard in the Power BI service and select a tile with a visual.
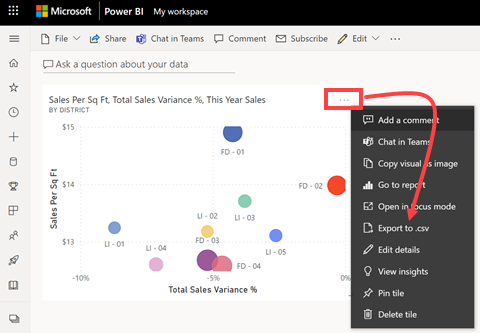
From the upper right corner of the tile, open the More options (...) dropdown and select Export to .csv.
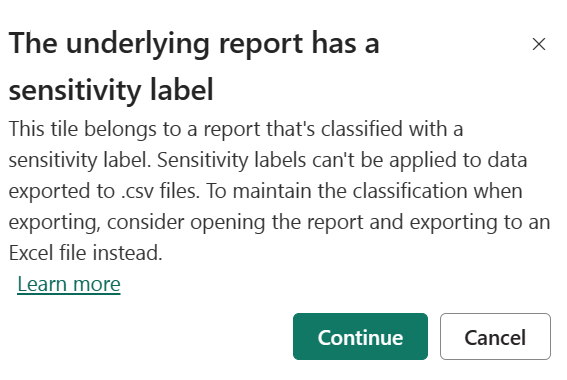
If the tile was pinned from a report with a sensitivity label, you see this warning. Consider the sensitivity of your content before deciding whether to export or not. To export data with a sensitivity label, open the report page that contains the original visual and export the data from there instead.
Power BI exports the data to a .csv file. If you filtered the visualization, then the .csv export is filtered as well. Your browser prompts you to save or open the file. By default, your export is saved to your local Downloads folder.
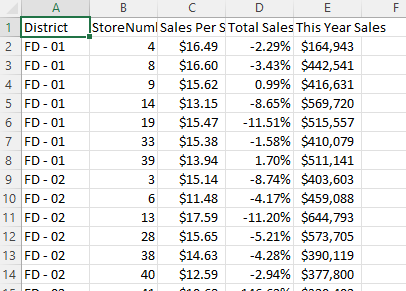
Open the .csv file in Excel.
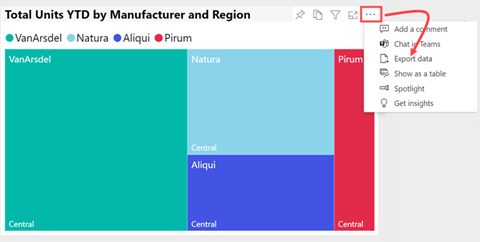
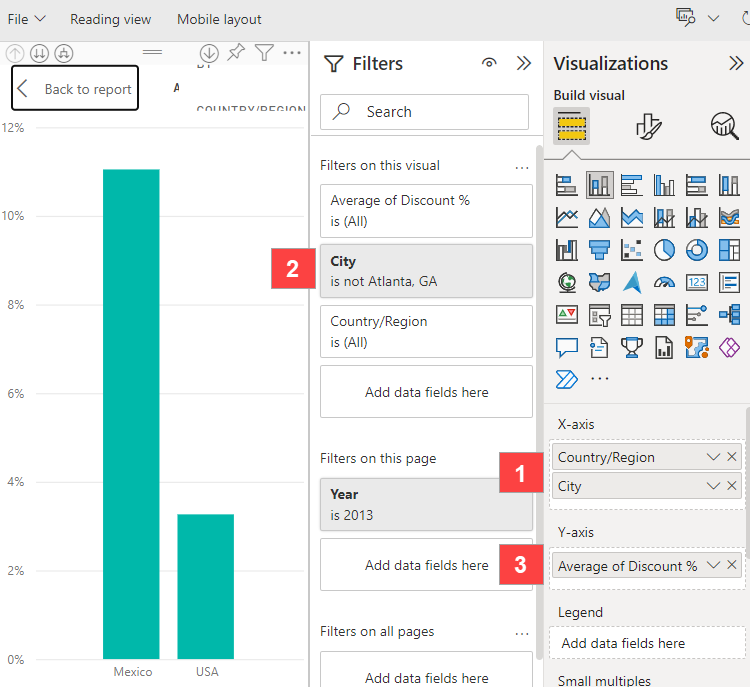
You have many more options when exporting data from a report visual in the Power BI service. To illustrate the different options, create a stacked column chart that includes:
Now we're ready to try out two different options for exporting data. Select More options (...) in the upper-right corner of the visual, then choose Export data.
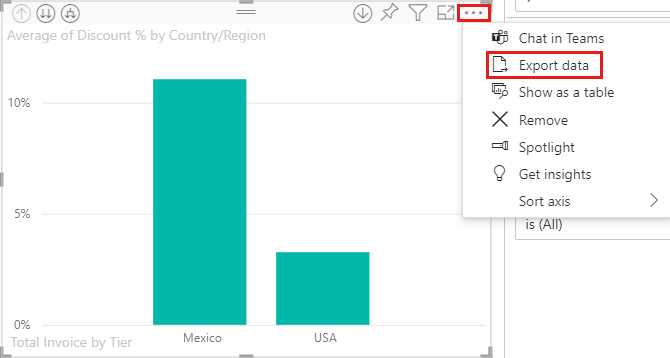
Power BI gives you the option to export the summarized data or underlying data. Since your visualization has an aggregate (you changed count to average), you have two options:
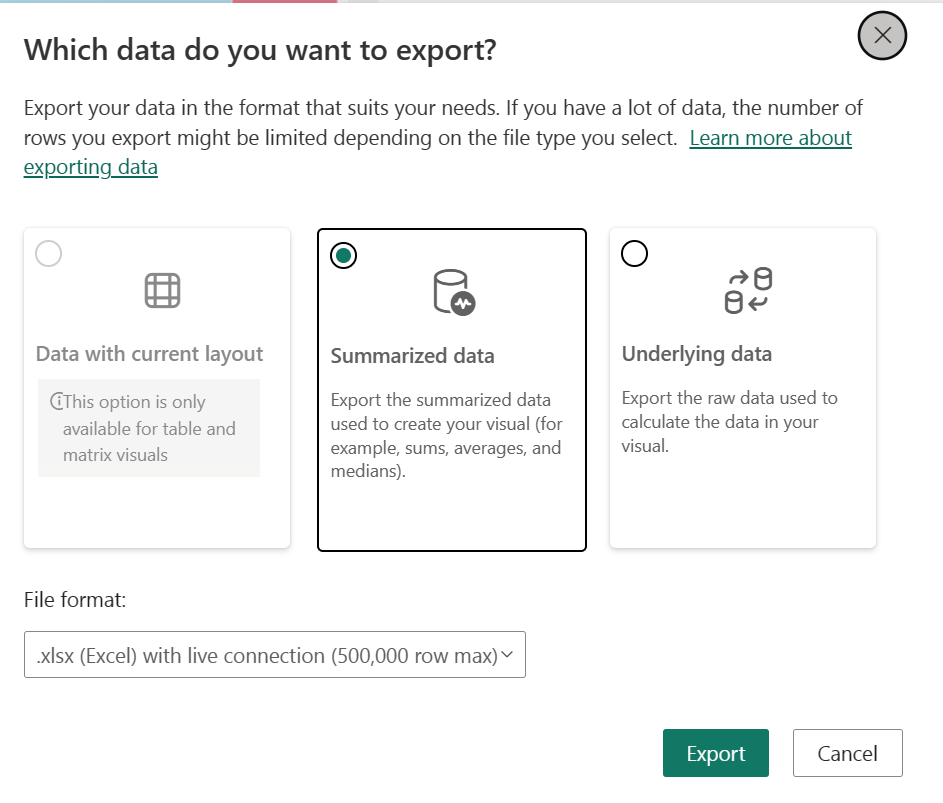
Select the option for Summarized data if you want to export data for what you see in that visual. This type of export shows you only the data (columns and measures) that is being used to create the visual. Since this visual has a hierarchy, your export contains aggregated data for the full hierarchy. So, even though your current view of the chart shows two columns (two Country/Regions), your summarized data display four rows--one for each City in the hierarchy.
If the visual has filters applied, then the data you export is also filtered. If your visual has aggregates (sum, average, and so on), the export is also aggregated.
Select the File format for your export. You have three options. The first two support sensitivity labels. The third option, exporting to .csv, doesn't support sensitivity labels.
For help understanding aggregates, see Aggregates in Power BI.
Note
In Power BI Desktop, you only have the option to export summarized data as a .csv file. When you select Export, your browser prompts you to save the file. Once saved, open the file in Excel. If you're using the Power BI app in Microsoft Teams, you may not receive the same prompts. Your exported file is saved in your local Downloads folder or in a folder that you specify.
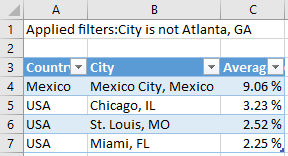
In this example, our Excel export shows one total for each city. Since we filtered out Atlanta, it isn't included in the results. The first row of our spreadsheet shows the filters that Power BI used when extracting the data.
All the data used by the hierarchy is exported, not simply the data used for the current drill level for the visual. For example, we haven't yet drilled down to the city level, but our export includes city data as well as country/region data.
Our exported data is aggregated. We get a total percentage, one row, for each city.
Since we applied filters to the visualization, the exported data exports as filtered. Notice that the first row displays Applied filters: City isn't Atlanta, GA.
Select this option if you want to see the data in the visual and other data from the semantic model (see chart later in this article for details). If your visualization has an aggregate, selecting Underlying data removes the aggregate. In this example, the Excel export shows one row for every single City row in our semantic model and the discount percent for that single entry. Power BI flattens the data it doesn't aggregate it.
For some data, underlying is disabled. Build permissions may be required to see more data than is currently displayed in the visual (underlying data). These permissions protect the data from being inappropriately viewed, reused, or shared with anyone other than the intended audience.
When you select Export, your browser prompts you to save the file. Once saved, open the file in Excel. If you're using the Power BI app in Microsoft Teams, you may not receive the same prompts. Your exported file is saved in your local Downloads folder or in a folder that you specify.
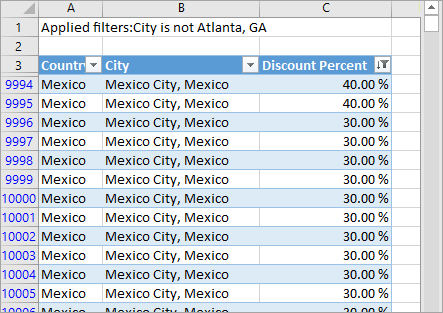
This screenshot shows you only a small portion of the Excel file; it has more than 100,000 rows.
All the data used by the hierarchy is exported, not simply the data used for the current drill level for the visual. For example, we haven't yet drilled down to the city level, but our export includes both city and country/region data.
Since we applied filters to the visual, the exported data exports as filtered. Notice that the first row displays Applied filters: City isn't Atlanta, GA. Notice that in some specific cases the first row might display a filter that isn't being applied in the data that follows. See the next section for details.
What you see when you select Underlying data can vary. Understanding these details may require the help of your admin or IT department. In Power BI Desktop or the Power BI service, in the reporting view, a measure shows in the Fields list with a calculator icon.  . Measures can be created in Power BI Desktop.
| Visual contains | What you see in export |
|---|---|
| Aggregates | the first aggregate and nonhidden data from the entire table for that aggregate |
| Aggregates | related data - if the visual uses data from other data tables that are related to the data table that contains the aggregate (as long as that relationship is *:1 or 1:1) |
| Measures | all measures in the visual and all measures from any data table containing a measure used in the visual |
| Measures | all nonhidden data from tables that contain that measure (as long as that relationship is *:1 or 1:1) |
| Measures only | all nonhidden columns from all related tables (to expand the measure) |
| Measures only | summarized data for any duplicate rows for model measures |
Important
Export underlying data doesn't include datetime / variations columns or include numeric columns if there is an aggregation. Additionally, visual calculation results are not included.
Power BI report designers control the types of data export options that are available for their consumers. The choices are:
Allow end users to export summarized data from the Power BI service or Power BI Report Server.
Allow end users to export both summarized and underlying data from the service or Report Server.
Don't allow end users to export any data from the service or Report Server.
Important
We recommend that report designers revisit old reports and manually reset the export option as needed.
To set these options:
Start in Power BI Desktop.
From the upper left corner, select File > Options and Settings > Options.
Under CURRENT FILE, select Report settings.
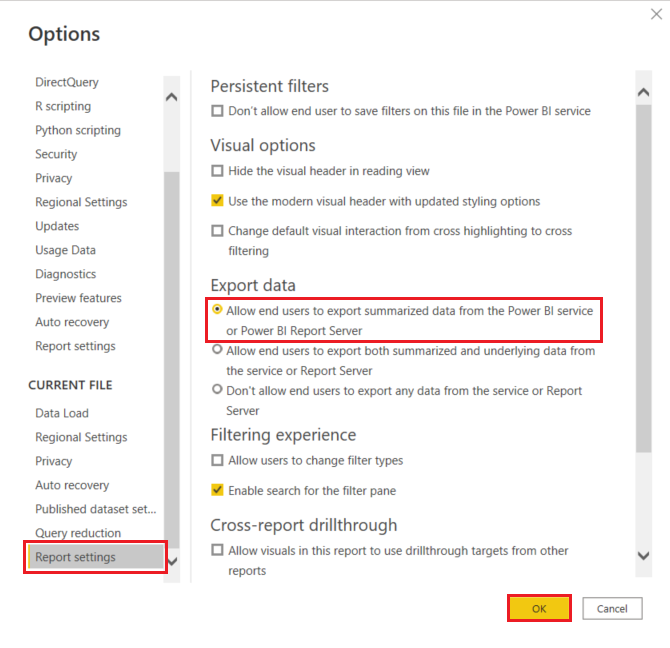
Make your selection from the Export data section.
You can also update this setting in the Power BI service.
It's important to note that if the Power BI admin portal settings conflict with the report settings for export data, the admin settings override the export data settings.
These considerations and limitations apply to Power BI Desktop and the Power BI service, including Power BI Pro and Premium.
There are many considerations related to exporting to Excel. Exporting is one of those features that report designers and Power BI administrators may disable for individuals or even for an entire organization. They disable it to ensure that private data isn't exposed to the wrong audience.
If you find that you can't use this feature, reach out to the report owner and your administrator. They can explain why you can't export data from a particular visual or from all visuals. It may be that this feature is purposely disabled and perhaps they can enable it for you. Other times, there may be particular reasons an export doesn't work. It could be related to permissions, data contents, data type, visual type, how the designer named the fields, and more. When contacting the report owner or administrator, refer them to these articles: Admin tenant settings, Row level security, and Data protection.
When you're exporting data to Excel, the speed of download of the generated workbook can vary depending on network bandwidth.
The maximum number of rows that Power BI Desktop and Power BI service can export to a .csv file is 30,000.
The export to a .csv file will not contain any subtotal or total rows.
The maximum number of rows that the applications can export to an .xlsx file is 150,000. The actual number may be lower than 150,000 depending on query limits and visual types.
For export from matrix visuals using Data with current layout, the export limit is 150,000 data intersections. Data intersections are the common points where different sets of data overlap. For example, if you have a list of customers who bought laptops and another list of customers who bought tablets, the intersection would be the customers who bought both laptops and tablets. For a table visual, each row has one data intersection. For a matrix visual, each row can have 1 or more data intersections, so the exported rows count can be less than 150,000. (For example, if a matrix visual has three data intersections per row, the maximum row count is 150,000 / 3 = 50,000 rows.) The message "Exported data exceeded the allowed volume. Some data may have been omitted." is added at the footer of the Excel file when the limit is hit. To avoid this scenario, consider limiting the dimensions or filtering the data.
Export using Underlying data doesn't work if:
the version is older than 2016.
the tables in the model don't have a unique key.
an administrator or report designer has disabled this feature.
you enable the Show items with no data option for the visualization Power BI is exporting.
For export from matrix visuals using Data with current layout, consider the following.
Matrices with columns and/or values but no rows are exported as having rows and/or values but no columns.
Matrices with only one row and/or values but no columns are exported as table (no right border separator).
If the Switch values to rows formatting option is set to 'On' in Power BI for a table or matrix visual, the visual format isn't preserved when data is exported to Excel
If the Row subtotals toggle is set to 'Off' in Power BI Desktop for a matrix visual, but the matrix visual has expanded and collapsed sections, exported data contains subtotals for rows. To work around this issue, use the Expand | All command from the visual's context menu.
When you're using DirectQuery, the maximum amount of data that Power BI can export is 16-MB uncompressed data. An unintended result may be that you export less than the maximum number of rows of 150,000. This result can happen if:
There are too many columns. Try reducing the number of columns and exporting again.
There's data that is difficult to compress.
Other factors are at play that increase file size and decrease the number of rows Power BI can export.
If the visualization uses data from more than one data table, and no active relationship exists for those tables in the data model, Power BI only exports data for the first table.
The granularity of data exported to Excel using the Data with current layout and Summarized data options are identical and the only difference between the options is the shape of the data in Excel. For example, in a matrix visual, the Data with current layout preserves the shape of the visual as shown in Power BI when data is exported to Excel while the Summarized data option exports the same data but as a flat table of rows and columns.
When you export datetime data from Power BI, the format of the datetime changes to match the datetime format of your local machine. For example, let's say that the report designer formatted the datetime as DDMMYYYY, which is the default regional format for their locale. When you open that report on your machine and export the data to Excel, the datetime shows as MMDDYY, which is your default regional datetime format.
Power BI custom visuals and R visuals aren't currently supported.
In Power BI, you can rename a field (column) by double-clicking the field and typing a new name. Power BI refers to the new name as an alias. It's possible that a Power BI report can end up with duplicate field names, but Excel doesn't allow duplicates. So when Power BI exports the data to Excel, the field aliases revert to their original field (column) names.
If there are Unicode characters in the .csv file, the text in Excel may not display properly. Examples of Unicode characters are currency symbols and foreign words. You can open the file in Notepad and the Unicode displays correctly. If you want to open the file in Excel, the workaround is to import the .csv. To import the file into Excel:
Open Excel.
Go to the Data tab.
Select Get external data > From text.
Go to the local folder where the file is stored and select the .csv.
When you're exporting to .csv, certain characters are escaped with a leading ' to prevent script execution when opened in Excel. This happens when:
Power BI admins can disable the export of data.
Dynamic Formatting is not supported with this feature as the exported data doesn't preserve this formatting in Excel. Also, visual-specific formatting such as percent of grand total for a measure isn't preserved in Excel.
Whether model level formatting or visual level formatting is preserved in an export depends on the type of export:
| Export type | Model level format preserved | Visual level format preserved |
|---|---|---|
| Export to Excel | Yes | Yes |
| Connected Tables | No | No |
| Export to CSV | Yes | Yes |
Visual calculation results are included in all exports, except when exporting underlying data. Fields that are hidden on the visual are never included, except when exporting underlying data.
When using embed for your customers, export data from a visual doesn't work in the following cases:
Long running queries through a Gateway may timeout with the error "Executing the query for export data operation resulted in an error".
More questions? Try asking the Power BI Community.
Events
Power BI DataViz World Championships
Feb 14, 4 PM - Mar 31, 4 PM
With 4 chances to enter, you could win a conference package and make it to the LIVE Grand Finale in Las Vegas
Learn moreTraining
Module
Export data from Dataverse and use Microsoft Excel to edit records - Training
Discover how to export and edit Microsoft Dataverse table data using Excel files, while understanding security concepts.
Certification
Microsoft Certified: Power BI Data Analyst Associate - Certifications
Demonstrate methods and best practices that align with business and technical requirements for modeling, visualizing, and analyzing data with Microsoft Power BI.